
For each type of deadlock, we’ll review ‘typical’ deadlock graphs and discuss the signature that distinguishes each one, so that you can recognize it if you see it on your own systems. We’ll also consider the root causes of each type of deadlock, the code patterns that make them a possibility, how to avoid them recurring, and the need to deal with deadlocks, and all other SQL Server errors gracefully, with error handling and retries.
The Difference between Severe Blocking and Deadlocking
In my experience, developers and DBAs often think that their SQL Server instance is experiencing deadlocks when, really, it is experiencing severe blocking.
Blocking occurs when session A requests a lock on a resource (typically a row, page or table), but SQL Server cannot grant that lock because session B already holds a non-compatible lock on that resource.
For example, let’s assume that session B is in the process of modifying a row in the Invoices table. The session’s associated process (thread) currently holds an Intent-Exclusive (IX) lock on both the table and the page that contains the row, and an X lock on the row. Simultaneously, session A needs to read a few pages on same table. Its associated process acquires an Intent-Shared (IS) lock on the table (since IS and IX lock mode are compatible) and then attempts to acquire an S lock on the pages it needs to read. However, session B’s process holds an IX lock on one of the pages that contains some of the rows session A needs. S locks and IX locks are incompatible, and so session B’s thread blocks session A’s until the former completes its work and releases the locks.
Lock modes and lock compatibility
I don’t have space in this piece for a fuller discussion of lock modes and compatibility. See Further Reading at the end of the article for some useful references.
This is a transient situation and can be completely resolved by the session B completing its work and releasing its locks. It is possible to have extensive blocking chains where multiple sessions are blocked waiting for a session that itself is blocked waiting for another session that is blocked and so on, repeating multiple time. However, at the head of the blocking chain will be a head ‘blocker’ that is not waiting for a lock. It may be waiting for some other resource, such as a latch, memory, or IO, but at least one session will not be waiting for a lock, and the blocking chain will clear as soon as the head blocker can continue processing.
A deadlock is different; it occurs when two or more sessions are waiting for each other, in such a way that none can complete. A deadlock can be viewed as a circular lock chain, where every single process in the blocking chain is waiting for one or more other processes in that same blocking chain.
Consider the simplest possible deadlock, with two sessions, two processes and two resources (later sections will demonstrate deadlocks that are more complex). A deadlock occurs in two steps. In the first, each of the two processes requests and acquires a lock. This will be within a transaction, explicit or not, and hence neither process will release these locks immediately.
In the second step, each of the two processes requests a lock on the resource on which the competing session holds a lock that is incompatible with the requested lock.
At this point, process 1 cannot continue until it receives the lock that it wants on page 1:4224. It cannot get that lock until process 2 finishes and releases its lock on that page. Process 2 cannot continue until it receives the lock that it wants on page 1:1370. It cannot get that lock until process 1 finishes and releases its lock on that page.
At this point, neither process can proceed; we have a deadlock. Without intervention, these two processes would sit forever waiting for each other. Fortunately, SQL Server automatically detects deadlocks and intervenes on our behalf.
SQL Server’s Automatic Deadlock Detection and Resolution
SQL Server’s lock monitor has a deadlock detector that periodically checks the locks to see if there are any circular locking chains. If it finds any, it selects one of the sessions associated with a suspended thread, kills it, rolls back its transaction and releases its locks. This allows the other session to continue executing.
The killed session, known as the deadlock victim, receives error 1205:
Transaction (Process ID 75) was deadlocked on resources with another process and has been chosen as the deadlock victim. Rerun the transaction.
The lock monitor picks the deadlock victim based, firstly, on the setting of DEADLOCK_PRIORITY for each session and, secondly (in the event of a tie) on the amount of work that it will take to roll back each of the open transactions.
The DEADLOCK_PRIORITY is a session-scoped setting that establishes the relative importance that the session completes its work should it become embroiled in a deadlock. It can be set to HIGH, NORMAL or LOW, with NORMAL being the default. If we’d prefer SQL Server not to pick a certain session as a deadlock victim, we can set its DEADLOCK_PRIORITY to high.
Integer values for DEADLOCK_PRIORITY
We can also set the DEADLOCK_PRIORITY to any integer value between -10 and +10, HIGH is equivalent to +5, NORMAL to 0 and LOW to -5. I recommend sticking with the named options. If someone is setting very fine-grained deadlock granularities, for example setting sessions to deadlock priorities 2, 3 or 7, there is likely a larger problem at play (i.e. lots of deadlocks and someone spending a lot of time prioritizing which processes are most important, rather than fixing what is causing the deadlocks).
If two sessions deadlock, the lock monitor will select as the deadlock victim the one with the lower value for DEADLOCK_PRIORITY. If each has identical values for DEADLOCK_PRIORITY, then the lock monitor considers the resources required to roll back the ‘competing’ transactions; the one that requires the least work to roll back will be the deadlock victim. The lock monitor takes no account of how long a transaction has been running or how much work it has done; just the cost of rolling it back. If a deadlock occurs between session A, which has been running a SELECT for an hour, and session B that is running a single-row UPDATE, and both have the same DEADLOCK_PRIORITY, session A will be the deadlock victim as it made no data changes and hence costs nothing to roll back.
Preventing Deadlocks
It’s convenient that SQL Server will detect and resolve deadlocks automatically, but that doesn’t mean a DBA can just ignore them. After all, the deadlock victim may well be an important business operation and its failure to run will cause considerable disruption.
A DBA needs to know when a deadlock occurs in one of their SQL Server instances by alerting on 1205 errors, to capture the information, the deadlock graph, which will detail which processes were involved in the deadlock, and then set about trying to ensure that it does not occur again.
How to Capture a SQL Server Deadlock Graph
A deadlock graph shows us the sessions and resources that were involved in a deadlock. Rather than repeat information ably covered elsewhere, I’m going to refer you to Jonathan Kehayias’ article, Handling Deadlocks in SQL Server, for background details of the various techniques by which to capture deadlock graphs, including various Trace Flags, the Profiler deadlock graph event, Service Broker event notifications, and Extended Events.
Prior to SQL Server 2008, if a deadlock occurred in SQL Server, we’d have to enable trace flags, or set up a server-side trace, and wait for the deadlock to recur. In SQL Server 2008 and later, we can retrieve deadlock graphs retrospectively from the extended events system_health session. I used the technique in this article, as frankly it is the most straightforward way to get the deadlock graphs, using Jonathan’s query. Listing 1 shows how to return the deadlock graph from the ring_buffer target thesystem_health event session (the code download also contains the equivalent code for the event_file target). This version of the query is specific to SQL Server 2012; see the previously referenced article for the 2008 version.
|
1 2 3 4 5 6 7 8 9 10 11 12 13 14 |
SELECT XEvent.query('(event/data/value/deadlock)[1]') AS DeadlockGraph FROM ( SELECT XEvent.query('.') AS XEvent FROM ( SELECT CAST(target_data AS XML) AS TargetData FROM sys.dm_xe_session_targets st JOIN sys.dm_xe_sessions s ON s.address = st.event_session_address WHERE s.name = 'system_health' AND st.target_name = 'ring_buffer' ) AS Data CROSS APPLY TargetData.nodes ('RingBufferTarget/event[@name="xml_deadlock_report"]') AS XEventData ( XEvent ) ) AS src; |
Listing 1: Returning the deadlock graph from the system_health event session
The deadlock graph obtained from the system_health extended events session is extremely similar both to the error log output for traceflag 1222 and to the XML captured by SQL Profiler when it is tracing for the deadlock graph event.
How to Read a Deadlock Graph
In the next section, we’ll start our tour of common types of deadlocks and their resolution. In order to follow along, you’ll need to know your way around a deadlock graph, so let’s take a brief tour.
I generated an example deadlock by executing two stored procedures, UpdateCustomerLatestOrderStatus and AddOrder (which we’ll use again, and discuss in more detail, later) though any simple deadlock will do at this early stage, since we’re only interested at this stage in the overall structure of the resulting deadlock graph.
Generate a deadlock and then run retrieve the deadlock graph, for example by running Listing 1 to retrieve it from the system_health event session. Figure 1 shows my deadlock graph, in XML format.
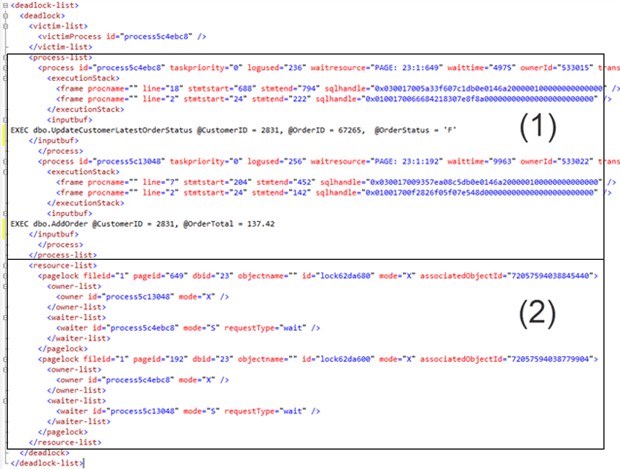
Figure 1: A sample deadlock graph showing the processes and resources sections
The Extended Events live data viewer, built into SSMS in SQL Server 2012, as well as tools such as Profiler, can present a GUI representation of the deadlock graph. However, I prefer looking at the ‘raw’ XML version. While most of the information in the deadlock graph is accessible from the GUI representation, it’s not as easy to find and is not all in one place. I find myself clicking on the various sessions and resources multiple times to get the whole picture.
An XML deadlock graph has two main sections, labelled (1) and (2) in Figure 1.
- Processes section – details all the processes involved in the deadlock, what they were running, what isolation level they were in and more
- Resources section – lists all the resources that were involved in the deadlock, which locks each process acquired and which locks they requested.
I like to start by looking at the resources section, to see which resources the processes were fighting over and what types of locks they were requesting. Once I have a picture of what locks were involved, then I go back and look at the details of the processes to see what they were doing.
There will be at least two entries here, but there may be more. Each entry starts with a description of the resource and then lists the processes that either held a lock on that resource or requested a lock on that resource. Locks here will mainly be key, RID, page or table, with more exotic range locks possible if the query was running under SERIALIZABLE isolation. It’s also possible to have non-lock related resources here, especially if either a query was running in parallel. Start by noting the granularity and mode of the locks and the objects involved. Are there table level locks held or requested? How many different tables are involved? How many indexes are involved?
Next, we move on to the processes section, which contains an entry for every thread involved in the deadlock. Notice that I say thread, not session, because if a session is running a parallel query, it can appear multiple times in this section. This section of the graph provides a wealth of information, including login names, host names, isolation level, times, session settings and more.
The most useful information, generally, is the isolation level under which each query was running and the details of which statement completed the deadlock. I say ‘completed’ the deadlock, because the statement listed in the deadlock graph can be just the one that the session was running at the point that the deadlock detector identified that this session was part of a deadlock.
Common types of SQL Server Deadlocks
Here we begin our dissection of the most common types of SQL Server deadlock. We’ll review deadlock graphs for each, discuss what distinguishes each type, and then consider what causes them and how to avoid them in future.
In each case, the deadlock graphs I present are representative of real graphs, produced on real SQL Server instances operating under concurrent workloads. Some require some tricks and contrivances to reproduce on an isolated test instance, other are simply very hard to reproduce ‘on demand. The code download for this article contains code samples that will allow you to reproduce the reader-writer, writer-writer, key lookup and serializable deadlock types.
However, please bear in mind, firstly, that your output won’t match exactly what I present in this article, though the basic signature will be similar. Secondly, that the code download examples are contrived specifically to produce the deadlock. They in no way represent code you’d hope or expect to see on a production system.
Reader-Writer Deadlocks
A reader-writer deadlock is a deadlock between a statement that is reading and a statement that is performing some form of data modification.
When you look at the resources involved, you’ll see that the signature of this form of deadlock is locks that are all either a shared (S) lock granted and an exclusive (X) lock requested or an X lock granted and an S lock requested.
In its default isolation level (READ COMMITTED), SQL Server hold S locks only until the statement completes. As such, reader-writer deadlocks are most prevalent in code that has data modifications followed by a select query, within a transaction, or in code that has requested a higher isolation level, meaning that SQL Server holds S locks till the end of the transaction, either intentionally or because the client libraries default to a higher isolation level.
There is one very easy fix for this form of deadlock, and that is to use a row-version based isolation level, either READ COMMITTED SNAPSHOT or SNAPSHOT. In the row-version based isolation levels, readers do not take locks and instead use row versions for isolation. No shared locks means no reader-writer deadlocks.
Transaction Isolation levels
Again, there is not room in this article for a more detailed description of the different transaction isolation levels, and how each prevents read phenomena, such as dirty reads, non-repeatable reads and so on. See Further Reading.
The sample deadlock graph in Figure 1 is, in fact, one generated by a reader-writer deadlock and we’re going to drill into the details of that graph here. As discussed earlier, we’ll start with the resources section.
|
1 2 3 4 5 6 7 8 9 10 11 12 13 14 15 16 17 18 19 |
<resource-list> <pagelock fileid="1" pageid="649" dbid="23" objectname="" id="lock5e00300"" mode="X" associatedObjectId="72057594038845440"> <owner-list> <owner id="process5c13048"""" mode="X" /> </owner-list> <waiter-list> <waiter id="process5c4ebc8"""" mode="S" requestType="wait" /> </waiter-list> </pagelock> <pagelock fileid="1" pageid="192" dbid="23" objectname="" id="lock62da600"" mode="X" associatedObjectId="7205759403877904"> <owner-list> <owner id="process5c4ebc8"""" mode="X" /> </owner-list> <waiter-list> <waiter id="process5c13048"""" mode="S" requestType="wait" /> </waiter-list> </pagelock> </resource-list> |
Listing 2: The resources section for a reader-writer deadlock
We have two processes here, for the moment I’m going to call them 48 and c8 (the last two letters of their owner_id). There are two resources, page 649 in database 23 and page 192 in database 23. With no object name given for the page lock (key locks and object locks give the name), we’re going to have to do a little bit of work to do to identify the table.
The first step, however, is to identify the database, using the db_name() function. Once we have the database name, we can use the associatedObjectID (which in this case is not an objectID) to get the table name.
|
1 2 3 4 5 6 |
SELECT OBJECT_NAME(p.object_id) AS TableName , i.name AS IndexName FROM sys.partitions AS p INNER JOIN sys.indexes AS i ON p.object_id = i.object_id AND p.index_id = i.index_id WHERE partition_id = 72057594038845440 |
Listing 3: Obtaining object names from partition IDs.
We can identify the second resource the same way and it turns out that the involved tables were Customers and Orders, the clustered index of both.
To work out the sequence of events that lead to the deadlock, we look at the owner-list and waiter-list for each resource. The process listed in the owner-list is the one that had the lock, the process or processes in the waiter-list are the ones that had requested the lock and were waiting for it.
Using those lists, we can see that Process 48 had an exclusive lock on the page in Orders and Process c8 had an exclusive lock on the page in Customers. That was the first step. Then Process 48 requested a read lock on the locked page in Customers and Process c8 requested a read lock on the locked page in Orders.
At this point, even without looking at the processes section, there’s enough information to consider potential fixes. If the order of either, or both, sets of statements were reversed and the queries are running in READCOMMITTED, then this deadlock wouldn’t occur because under that isolation level shared locks are released no later than the end of the query that requested the locks and so the shared locks would be released before the update started. If we could move either SELECT outside the transaction, then this deadlock wouldn’t occur. These won’t necessarily be the actual solutions implemented, but they’re worth keeping in mind.
For now, however, let’s move on to the process section. In Listing 4, I’ve removed some bits from the XML to keep the size down and applied some manual formatting to make the listing easier to read on the page.
|
1 2 3 4 5 6 7 8 9 10 11 12 13 14 15 16 17 18 19 20 21 22 23 24 25 26 27 28 29 30 31 32 33 34 35 36 37 38 39 40 41 42 43 44 45 46 47 48 49 |
<process-list> <process id="process5c4ebc8"""" waitresource="PAGE: 23:1:649" waittime="2377" ownerId="533054" transactionname="user_transaction" lasttranstarted="2013-09-27T17:38:55.823" XDES="0x8a8c0e80" lockMode="S" schedulerid="8" kpid="7464" status="suspended" spid="52" sbid="0" ecid="0" priority="0" trancount="2" lastbatchstarted="2013-09-27T17:38:55.823" lastbatchcompleted="2013-09-27T17:38:55.770" clientapp="Microsoft SQL Server Management Studio - Query" hostname="MyHost" hostpid="6188" loginname="MyLogin" isolationlevel="read committed (2)" xactid="533054" currentdb="23" lockTimeout="4294967295" clientoption1="671090784" clientoption2="390200"> <executionStack> <frame procname="" line="18" stmtstart="688" stmtend="794" sqlhandle="0x030017005a33f607c1db0e0146a200000100000000000000" /> <frame procname="" line="2" stmtstart="24" stmtend="222" sqlhandle="0x0100170066684218307e8f8a000000000000000000000000" /> </executionStack> <inputbuf> EXEC dbo.UpdateCustomerLatestOrderStatus @CustomerID= 2831, @OrderStatus = 'F' </inputbuf> </process> <process id="process5c13048"""" waitresource="PAGE: 23:1:192" waittime="6290" ownerId="533059" transactionname="user_transaction" lasttranstarted="2013-09-27T17:39:01.863" XDES="0x8c4eae80" lockMode="S" schedulerid="2" kpid="6180" status="suspended" spid="57" sbid="0" ecid="0" priority="0" trancount="3" lastbatchstarted="2013-09-27T17:39:01.863" lastbatchcompleted="2013-09-27T17:39:00.773" clientapp="Microsoft SQL Server Management Studio - Query" hostname="MyHost" hostpid="6188" loginname="MyLogin" isolationlevel="read committed (2)" xactid="533059" currentdb="23" lockTimeout="4294967295" clientoption1="671090784" clientoption2="390200"> <executionStack> <frame procname="" line="7" stmtstart="204" stmtend="452" sqlhandle="0x030017009357ea08c5db0e0146a200000100000000000000" /> <frame procname="" line="2" stmtstart="24" stmtend="142" sqlhandle="0x01001700f2826f05f07e548d000000000000000000000000" /> </executionStack> <inputbuf> EXEC dbo.AddOrder @CustomerID= 2831, @OrderTotal = 137.42 </inputbuf> </process> </process-list> |
Listing 4: The processes section for a reader-writer deadlock
There’s a lot of information in there. To start, the process ID matches the process IDs listed in the resources section. We can see the client application, host name and login name of both sessions. If multiple applications use the server, this can help narrow down the culprit. Occasionally, you may find that the deadlocks originate from ad-hoc queries from Management Studio. In this case, fixing the deadlock may be as simple as asking the user to stop running that query or to run it elsewhere or at another time.
We can see that the transactionname is user_transaction, indicating that the code formed part of an unnamed, explicit transaction.
The waitresource shows the database, objects and pages on which the processes are deadlocked, and reflect what we saw in the resources section. If the isolationlevel indicates that an application or procedure has requested a higher isolation level, it’s worth investigating whether or not this is a true requirement, or just a default, but unnecessary, setting.
The input buffer (inputbuf) lists which statements each session sent to SQL Server. In both cases, in this example, it’s a call to a stored procedure, so our next step is to investigate these procedures. Process c8calls the procedure UpdateCustomerLatestOrderStatus and process 48 calls the procedure AddOrder.
|
1 2 3 4 5 6 7 8 9 10 11 12 13 14 15 16 17 18 19 20 21 22 23 24 25 26 27 28 29 30 31 32 33 34 35 36 37 38 39 40 41 42 43 44 45 46 47 48 49 50 51 |
CREATE PROCEDURE UpdateCustomerLatestOrderStatus ( @CustomerID INT , @OrderStatus CHAR(1) ) AS BEGIN TRANSACTION UPDATE Customers SET LatestOrderStatus = @OrderStatus WHERE CustomerID = @CustomerID SELECT * FROM Orders WHERE CustomerID = @CustomerID COMMIT GO CREATE PROCEDURE AddOrder ( @CustomerID INT , @OrderTotal NUMERIC(10, 2) ) AS BEGIN TRANSACTION INSERT INTO Orders ( CustomerID , OrderDate , OrderTotal , OrderStatus ) VALUES ( @CustomerID, GETDATE() , @OrderTotal , 'A' ); SELECT CustomerID, CustomerName , RegionID , OrderLimit , 'A' AS LatestOrderStatus FROM dbo.Customers AS c WHERE CustomerID = @CustomerID UPDATE Customers SET LatestOrderStatus = 'A' WHERE CustomerID = @CustomerID; COMMIT GO |
Listing 5: The UpdateCustomerLatestOrderStatus and AddOrder stored procedures
For the purposes of this article, please try to ignore the complete lack of error handling in these procedures. If they were real production code, there would be a lot more verification, error handling and checks. If they also appear oddly written, that’s intentional as I wrote them in a way that ensured they would cause a deadlock.
To understand the deadlock, we need to match the code that ran to the locks listed in the resources section of the deadlock graph.
We’ll start with process c8, which the resources section told us had taken an exclusive (X) lock on a page in Customers and then requested a Shared (S) lock on a page in Orders. Since UpdateCustomerLatestOrderStatus contains only two queries, we can deduce easily that the X lock this process hold results from the update of customers and the shared lock it requested results from the select on Orders.
Process 48 first took an X lock on the page in Orders, which would be the INSERT into Orders. It then requested an S lock to perform a select against customers, but could not proceed as process c8 had an incompatible lock on the page it needed. As this point, we had a deadlock and process 48 never even reached the subsequent update of customers.
Now we know what caused the deadlock, it’s relatively easy, in this case, to prevent it. Let’s start with the UpdateCustomerLatestOrderStatus stored procedure. The explicit transaction in this procedure is only necessary if there are multiple data modification statements that need to form an atomic unit, or if the result of the update modification could affect the result of the subsequent select. In fact, we have a single data modification followed by a select on a different table, which will return the same results regardless of whether the update commits or rolls back. We can also safely say that there’s no trigger because there are no indication of it in the deadlock graph (it would appear in the executionStack sub-section).
In short, we can remove the explicit transaction, as shown in Listing 6.
|
1 2 3 4 5 6 7 8 9 |
CREATE PROCEDURE UpdateCustomerLatestOrderStatus ( @CustomerID INT, @OrderStatus CHAR(1) ) AS UPDATE Customers SET LatestOrderStatus = @OrderStatus WHERE CustomerID = @CustomerID SELECT * FROM Orders WHERE CustomerID = @CustomerID GO |
Listing 6: Remove the explicit transaction from UpdateCustomerLatestOrderStatus
This procedure can no longer cause the deadlock. However, to be sure, let’s fix the AddOrder procedure too. This one’s a little harder.
The select is against the same rows as the update right after it. If we look at what it’s doing, the select is returning the customer row as it will be after the update completes (it’s specifying the LatestOrderStatus as A, which is the value to which the update sets it).
There’s a potential bug here though. If that update never commits, the select may return ‘dirty’ data. This may be the developer’s intent but probably isn’t, so I’ll move the select outside the transaction and remove the hardcoded value for LatestOrderStatus, just letting the select return the value that’s in the table.
|
1 2 3 4 5 6 7 8 9 10 11 12 13 14 15 16 17 18 |
CREATE PROCEDURE AddOrder (@CustomerID INT, @OrderTotal NUMERIC(10,2)) AS BEGIN TRANSACTION INSERT INTO Orders (CustomerID, OrderDate, OrderTotal, OrderStatus) VALUES (@CustomerID, GETDATE(), @OrderTotal, 'A'); UPDATE Customers SET LatestOrderStatus = 'A' WHERE CustomerID = @CustomerID; COMMIT SELECT CustomerID , CustomerName , RegionID , OrderLimit , LatestOrderStatus FROM dbo.Customers AS c WHERE CustomerID= @CustomerIDGO |
Listing 7: Modifying the AddOrder stored procedure to prevent deadlocks
If the exact current behavior is required and correct, I could instead move the select so that it runs as-is, after the transaction commits.
Now these procedures will no longer deadlock, but there is still one potential problem. These two procedures still access the same objects but in different orders. UpdateCustomerLatestOrderStatus touches Customers first then Orders, and AddOrder does the reverse order. If a future change wraps the first procedure’s contents in a transaction again, they may well start deadlocking again.
One general rule for preventing deadlocks is always access objects in the same order, so let’s make one more fix to UpdateCustomerLatestOrderStatus.
|
1 2 3 4 5 6 7 8 9 10 |
CREATE PROCEDURE UpdateCustomerLatestOrderStatus ( CustomerIDINT, @OrderStatus CHAR(1) ) AS SELECT * FROM Orders WHERE CustomerID= @CustomerID UPDATE Customers SET LatestOrderStatus = @OrderStatus WHERE CustomerID= @CustomerID GO |
Listing 8: Modifying UpdateCustomerLatestOrderStatus so that it accesses objects in the same order as AddOrder
That should ensure that these two procedures never deadlock again.
Writer-Writer Deadlocks
In a writer-writer deadlock both the granted lock and requested lock on a resource are update or exclusive locks. In other words, both operations attempt data modifications.
One important thing to note when investigating writer-writer deadlocks is that SQL Server holds exclusive locks until the transaction commits, unlike shared locks which in the default read committed isolation level SQL Server holds no longer than the end of the statement (and can in fact be released as soon as it reads the row, before the statement completed).
Note also that the Snapshot isolation levels won’t help us with writer-writer deadlocks, as these levels affect only SQL Server’s behavior with regard to S locks. SQL Server will still take exclusive locks for data modifications.
This aside, we adopt more or less the same approach to fixing a writer-writer deadlock as we did for fixing a reader-writer deadlock, so I’m not going to go into immense detail. Again, we’ll start with the resources section of the deadlock graph.
|
1 2 3 4 5 6 7 8 9 10 11 12 13 14 15 16 17 18 19 20 |
<resource-list> <pagelock fileid="1" pageid="649" dbid="23" objectname="" id="lock61fb800"" mode="X" associatedObjectId="72057594038845440"> <owner-list> <owner id="process5e3ae08"""" mode="X" /> </owner-list> <waiter-list> <waiter id="process5e4ebc8"""" mode="X" requestType="wait" /> </waiter-list> </pagelock> <pagelock fileid="1" pageid="192" dbid="23" objectname="" id="lock61fa180"" mode="X" associatedObjectId="72057594038779904"> <owner-list> <owner id="process5e4ebc8"""" mode="X" /> </owner-list> <waiter-list> <waiter id="process5e3ae08"""" mode="X" requestType="wait" /> </waiter-list> </pagelock> </resource-list> |
Listing 9: The resources section of a writer-writer deadlock
All locks involved are exclusive (X) locks. This means we can’t consider one of the snapshot isolation levels, nor will we be able to fix this by moving statements outside of a transaction.
Once again, we see that two processes (c8 and 08) engaged in the deadlock. Once again, we use the db_name() function and Listing 3 to identify the objects involved and it’s the tables Orders and Customers.
According to the resource section, the order of events was as follows
- process
08takes an exclusive lock on a page inOrders - process
c8takes an exclusive lock on a page inCustomers - process
08requests an exclusive lock on a page inCustomers - process
c8requests an exclusive lock on a page inOrders.
The processes section is near identical to the one for the reader-writer deadlock with the primary difference being in the content of the input buffers.
|
1 2 3 4 5 6 7 8 9 10 11 12 13 14 15 16 17 18 19 20 21 22 23 24 25 26 27 28 29 30 31 32 33 34 |
<process-list> <process id="process5e4ebc8"""" waitresource="PAGE: 23:1:649" waittime="2499" transactionname="user_transaction" lockMode="X" status="suspended" spid="57" clientapp="Microsoft SQL Server Management Studio - Query" hostname="MyHost" loginname="MyLogin" isolationlevel="read committed (2)" currentdb="23"> <executionStack> <frame procname="" line="11" stmtstart="412" stmtend="554" sqlhandle="0x03001700cc7bde093cad600152a200000100000000000000" /> <frame procname="" line="2" stmtstart="24" stmtend="146" sqlhandle="0x0100170033cf901120240080000000000000000000000000" /> </executionStack> <inputbuf> EXEC dbo.DispatchOrder @CustomerID= 2831, @OrderID = 100097 </inputbuf> </process> <process id="process5e3ae08"""" waitresource="PAGE: 23:1:192" waittime="2500" transactionname="user_transaction" lockMode="X" schedulerid="6" status="suspended" spid="54" clientapp="Microsoft SQL Server Management Studio - Query" hostname="MyHost" loginname="MyLogin" isolationlevel="read committed (2)" currentdb="23"> <executionStack> <frame procname="" line="11" stmtstart="512" stmtend="672" sqlhandle="0x030017009357ea0869a9600152a200000100000000000000" /> <frame procname="" line="2" stmtstart="24" stmtend="142" sqlhandle="0x01001700f2826f05a0b8d485000000000000000000000000" /> </executionStack> <inputbuf> EXEC dbo.AddOrder @CustomerID= 2831, @OrderTotal = 137.42 </inputbuf> </process> </process-list> |
Listing 10: Processes section of a deadlock graph for a writer-writer deadlock
It’s our old friend AddOrder, fixed to prevent reader-writer deadlock, but now engaged in a writer-writer deadlock with a different procedure, DispatchOrder, shown in Listing 11.
|
1 2 3 4 5 6 7 8 9 10 11 12 13 14 15 16 17 18 19 20 21 22 23 |
ALTER PROCEDURE dbo.DispatchOrder ( @CustomerID INT , @OrderID INT ) AS BEGIN TRANSACTION UPDATE Customers SET LatestOrderStatus = 'D' WHERE CustomerID= @CustomerID; UPDATE dbo.Orders SET OrderStatus = 'D' WHERE OrderID = @OrderID; SELECT * FROM dbo.Customers AS c INNER JOIN dbo.Orders AS o ON c.CustomerID= o.CustomerID WHERE c.CustomerID= @CustomerID AND OrderID = @OrderID; COMMIT GO |
Listing 11: The DispatchOrder stored procedure
The sequence of the deadlock is as follows
- Process
08, runningAddOrder, takes an exclusive lock on the page inOrders. - Process
c8, runningDispatchOrder, takes an exclusive lock on the page inCustomers - Process
08requests an exclusive lock on the page inCustomers. - Process
c8requests an exclusive lock on the page inOrders, resulting in a deadlock - The
SELECTinDispatchOrderwas never reached
Once again, the root cause is accessing the same objects in different orders. At this point, if this were a real system, I’d be making a change to the coding standards document mandating that all transactions access the Orders table before the Customers table.
To fix this deadlock I’m going to make two changes. First, pull the select outside of the transaction so that it returns the committed data, rather than returning data containing modifications that might roll back. Second, I’m going to ensure that DispatchOrder, like the other two accesses Orders first and then Customers.
|
1 2 3 4 5 6 7 8 9 10 11 12 13 14 15 16 17 18 19 20 21 22 23 |
ALTER PROCEDURE dbo.DispatchOrder ( @CustomerID INT , @OrderID INT ) AS BEGIN TRANSACTION UPDATE dbo.Orders SET OrderStatus = 'D' WHERE OrderID = @OrderID; UPDATE Customers SET LatestOrderStatus = 'D' WHERE CustomerID= @CustomerID; COMMIT SELECT * FROM dbo.Customers AS c INNER JOIN dbo.Orders AS o ON c.CustomerID= o.CustomerID WHERE c.CustomerID= @CustomerID AND OrderID = @OrderID; GO |
Listing 12: Modifying DispatchOrders to avoid deadlocks
Since a transaction is, by definition, an atomic operation, which of the two updates runs first or second has no impact on the overall results, at least in cases like this where the two updates are independent. As such, the change I’ve made won’t change the behavior of the procedure.
So far, I’ve made no mention of tuning the procedures simply because the sample procedures that I wrote to simulate deadlock-prone code are already about as optimal as possible. However, when dealing with deadlocks generally, tuning the procedures is a critical part of the solution, even if there’s an obvious cause, as in these examples. Any time a query takes more locks than necessary, or holds locks longer than necessary, there’s an increased chance it will deadlock with another processes, and the busier the server, the higher the chance that will happen.
Of course, query tuning is a huge topic, and not specific to deadlocks, so I’m not going to cover it here. See the Further Reading section at the end of this article for some useful references.
Key Lookup Deadlocks
Technically key-lookup deadlocks are a special case of reader-writer deadlocks, but they are worth addressing separately as, unlike the earlier examples, this type of deadlock does not require that the processes are running multiple statements within a transaction. With a key lookup deadlock, it’s perfectly possible for a session running a single select to deadlock with a session running a single update statement. The reason this is possible relates to both SQL Server’s index architecture and the order in which the query processor runs operations.
Let’s look at an example deadlock graph for a key lookup deadlock. As is our custom, we’ll review the resources section first.
|
1 2 3 4 5 6 7 8 9 10 11 12 13 14 15 16 17 18 19 20 21 22 23 24 |
<resource-list> <keylock hobtid="72057594039435264" dbid="9 objectname="Sales.dbo.Invoices" indexname="PK__Invoices__D796AAD530676176" id="lock2d4163680"" mode="X" associatedObjectId="72057594039435264"> <owner-list> <owner id="process2efb09498"""" mode="X" /> </owner-list> <waiter-list> <waiter id="process2f8025498"""" mode="S" requestType="wait" /> </waiter-list> </keylock> <keylock hobtid="72057594039566336" dbid="9" objectname="Sales.dbo.Invoices" indexname="idx_InvoiceNumber" id="lock2d4125b00"" mode="S" associatedObjectId="72057594039566336"> <owner-list> <owner id="process2f8025498"""" mode="S" /> </owner-list> <waiter-list> <waiter id="process2efb09498"""" mode="X" requestType="wait" /> </waiter-list> </keylock> </resource-list> |
Listing 13: Resources section of a Key Lookup deadlock graph
One key point to note about the resources section is that there’s only one table involved, and two indexes on that table:
- Process
2f8025498holds a shared lock on the non-clustered index (idx_InvoiceNumber) and has requested a shared lock on the clustered index - Process
2efb09498holds an exclusive lock on the clustered index and has requested an exclusive lock on the non-clustered index
Listing 14 shows the processes section of the deadlock graph.
|
1 2 3 4 5 6 7 8 9 10 11 12 13 14 15 16 17 18 19 20 21 22 23 24 25 26 27 28 29 30 31 32 33 34 35 36 37 38 39 40 41 42 43 44 45 46 47 48 49 50 51 52 53 54 55 56 57 58 59 |
<process-list> <process id="process2f8025498"""" waitresource="KEY: 9:72057594039435264 (8dc78ed22838)" waittime="88" transactionname="SELECT" lasttranstarted="2013-12-02T17:21:19.553" lockMode="S" status="suspended" spid="52" trancount="0" lastbatchstarted="2013-12-02T17:21:19.553" lastbatchcompleted="2013-12-02T17:21:19.543" clientapp="Microsoft SQL Server Management Studio - Query" isolationlevel="read committed (2)"> <executionStack> <frame procname="adhoc" line="2" stmtstart="36" sqlhandle="0x0200000077d420286f1fc24c07ab8080072e05f2a9b935df 0000000000000000000000000000000000000000"> SELECT * FROM [dbo].[Invoices] [i] WHERE [InvoiceNumber]=@1 AND [InvoiceStatus] = @2 </frame> <frame procname="adhoc" line="2" stmtstart="4" sqlhandle="0x02000000960a0f2f4fd7272c5b1fee4358bbef0855443168 0000000000000000000000000000000000000000"> SELECT * FROM [dbo].[Invoices] [i] WHERE [InvoiceNumber]=@1 AND [InvoiceStatus] = @2 </frame> </executionStack> <inputbuf> SELECT * FROM [dbo].[Invoices] [i] WHERE [InvoiceNumber]=@1 AND [InvoiceStatus] = @2 </inputbuf> </process> <process id="process2efb09498"""" taskpriority="0" logused="464" waitresource="KEY: 9:72057594039566336 (33435b6b6461)" waittime="88" ownerId="393249" transactionname="UPDATE" lasttranstarted="2013-12-02T17:21:19.553" XDES="0x2ef64cd28" lockMode="X" schedulerid="4" kpid="1372" status="suspended" spid="54" sbid="0" ecid="0" priority="0" trancount="2" lastbatchstarted="2013-12-02T17:21:19.553" lastbatchcompleted="2013-12-02T17:21:19.553" clientapp="Microsoft SQL Server Management Studio - Query" isolationlevel="read committed (2)" xactid="393249" currentdb="9" lockTimeout="4294967295" clientoption1="671090784" clientoption2="390200"> <executionStack> <frame procname="adhoc" line="2" stmtstart="118" sqlhandle="0x020000009c6576269d7106a424dbe6c5a8df7ee031492564 0000000000000000000000000000000000000000"> UPDATE [dbo].[Invoices] set [InvoiceStatus] = @1 WHERE [InvoiceID]=@2 </frame> <frame procname="adhoc" line="2" stmtstart="4" sqlhandle="0x020000001da1c102d03e54b379f71b19ec42a91e6d0eaad7 0000000000000000000000000000000000000000"> UPDATE [dbo].[Invoices] set [InvoiceStatus] = @1 WHERE [InvoiceID]=@2 </frame> </executionStack> <inputbuf> UPDATE [dbo].[Invoices] set [InvoiceStatus] = @1 WHERE [InvoiceID]=@2 </inputbuf> </process> </process-list> |
Listing 14: Processes section of a Key Lookup deadlock graph
The process list reveals only two statements, a query and an update. We can see from the executionStack that, this time, we’re dealing with ad-hoc SQL. We see each statement listed twice in the executionStack (once as the entire batch submitted, once as the statement that completed the deadlock) and again in the inputbuf (as the command sent to SQL Server). The two statements are as follows:
|
1 2 |
SELECT * FROM [dbo].[Invoices] [i] WHERE [InvoiceNumber]=@1 AND [InvoiceStatus] = @2 |
And:
|
1 2 |
UPDATE [dbo].[Invoices] set [InvoiceStatus] = @1 WHERE [InvoiceID]=@2 |
There are no other queries involved here, no explicit transactions. These are two individual statements deadlocking.
Process 2f8025498 is reading the Invoices table via the non-clustered index, which happens to be non-covering. As such, it also needs to retrieve data from the clustered index. In such cases, SQL Server’s query processor first takes a lock on the non-clustered index, reading the index rows, then takes locks on the associated rows in the clustered index and performs the lookup.
When a data modification occurs, SQL Server first locks and modifies the rows in the clustered index, and then locates the non-clustered indexes that it needs to change, takes locks on those rows and modifying them. As a result, we can have a race condition that can lead to a deadlock.
In this case, the SELECT, using a non-covering index on InvoiceNumber, took a shared lock on the index key for the InvoiceNumber passed. The UPDATE took an exclusive key lock on the clustered index for the InvoiceID it was passed. The InvoiceNumber and InvoiceID happened to belong to the same row. The select then requested a shared lock on the row in the clustered index to do its key lookup, but was blocked by the exclusive lock that the UPDATE held. The update then requested an exclusive lock on the non-clustered index to change the InvoiceStatus, which is a key column in that index, but the shared lock held by the SELECT meant that SQL Server could not grant the request. At this point, the deadlock detector identifies the deadlock and terminates the select.
These deadlocks are annoying to fix, because technically the developer has done nothing wrong, nothing to cause the deadlock. To fix this, we need to make the non-clustered index a covering index. In the example, the query is a SELECT *, so this will be difficult and probably inefficient, and so fixing the deadlock will involve figuring out which columns are actually needed, replacing the SELECT * with a SELECT just of those columns and then making the index covering.
If it were not possible to cover the query, then some retry logic on the select would work as well. The lock manager will not choose the update as the deadlock victim, by default, because it requires more work to undo than the SELECT.
Since these are a special case of reader-writer deadlocks, using one of the row-versioning based isolation levels for the SELECT will also resolve this form of deadlock.
Parallelism-related deadlocks
Any deadlock can involve queries running in parallel. When that happens, the deadlock graph can become massively complex, leading to multiple additional entries in the resources section, with parallelism-related wait types, and multiple additional entries in the processes section. The key to interpreting a deadlock graph polluted with parallelism is to ignore all the parallelism-related sections.
Listing 15 shows the resources section of a deadlock graph for a deadlock that involved queries running in parallel.
|
1 2 3 4 5 6 7 8 9 10 11 12 13 14 15 16 17 18 19 20 21 22 23 24 25 26 27 28 29 30 31 32 33 34 35 36 37 38 39 40 41 |
<resource-list> <keylock hobtid="72057594548125696" dbid="5" objectname="SomeTable" indexname="idx_1" id="lock3e2a900"" mode="X" associatedObjectId="72057594548125696"> <owner-list> <owner id="process948e38"""" mode="X"/> </owner-list> <waiter-list> <waiter id="process948c58"""" mode="U" requestType="wait"/> </waiter-list> </keylock> <exchangeEvent id="port3e4a300"" nodeId="6"> <owner-list> <owner event="e_waitNone" type="producer" id="process948c58""""/> </owner-list> <waiter-list> <waiter event="e_waitPortOpen" type="consumer" id="processbf44d8""""/> <waiter event="e_waitPortOpen" type="producer" id="processbf4a78"""/> <waiter event="e_waitPortOpen" type="producer" id="process8bad48"""/> <waiter event="e_waitPortOpen" type="producer" id="process94e988"""/> </waiter-list> </exchangeEvent> <keylock hobtid="72057594548387840" dbid="5" objectname="SomeTable" indexname="idx_2" id="lockcaf0340"" mode="X" associatedObjectId="72057594548387840"> <owner-list> <owner id="processbf44d8"""" mode="X"/> </owner-list> <waiter-list> <waiter id="process948a78"""" mode="U" requestType="wait"/> </waiter-list> </keylock> <exchangeEvent id="port3e4a200"" nodeId="5"> <owner-list> <owner event="e_waitNone" type="producer" id="process948a78""""/> </owner-list> <waiter-list> <waiter event="e_waitPipeGetRow" type="consumer" id="process948e38""""/> </waiter-list> </exchangeEvent> </resource-list> |
Listing 15: Resources section for a parallelism-related deadlock graph
The exchangeEvent resources are parallelism exchange operators. These extra entries can make the deadlock graph very confusing and a lot harder to read. However, notice that all the locks granted or requested are either X or U meaning that this is a “writer-writer” deadlock.
There are two types of parallelism-related deadlocks. The first is a normal deadlock where one of more of the queries are running in parallel. The second is an intra-query parallelism deadlock and occurs when a single, parallelized query deadlocks with itself.
To identify whether or not this is an intra-query parallelism deadlock, we examine the processes section and see how many different values there are for the spid attribute. Listing 16 shows the massively cut-down processes section of the deadlock graph.
|
1 2 3 4 5 6 7 8 9 10 11 12 13 14 15 16 17 18 19 20 21 22 23 24 25 26 27 28 29 30 31 32 33 34 35 36 37 38 39 40 41 42 43 44 45 46 47 48 49 50 51 52 53 54 55 56 57 58 59 60 61 62 63 64 65 66 67 68 69 70 71 72 73 74 75 76 77 78 79 80 81 82 83 84 85 86 87 88 89 90 91 92 93 94 95 96 97 98 99 100 101 102 103 104 105 106 107 108 109 |
<process-list> <process id="process8bad48""" spid="52" isolationlevel="read committed (2)" currentdb="5" > <executionStack> <frame procname="GenerateParallelDeadlock" line="3" stmtstart="124" stmtend="555" sqlhandle="0x03000500a994e2395b978e00549c00000000000000000000"> -- redacted </frame> <frame procname="adhoc" line="1" sqlhandle="0x02000000d2106b13864677e720efec06d61e0c33c770b8ea"> -- redacted </frame> </executionStack> <inputbuf> </inputbuf> </process> <process id="process948a78"""" waitresource="KEY: 5:72057594548387840 (b70275b2ca0d)" transactionname="user_transaction" lockMode="U" status="suspended" spid="53" isolationlevel="read committed (2)"> <executionStack> <frame procname="adhoc" line="1" sqlhandle="0x020000000e23aa221ede7daa26ce1e248f8ff1bc2ed1d9ce"> -- redacted </frame> </executionStack> <inputbuf> </inputbuf> </process> <process id="process948c58"""" waitresource="KEY: 5:72057594548125696 (3803e55a1987)" transactionname="user_transaction" status="suspended" spid="52" isolationlevel="read committed (2>" <executionStack> <frame procname="GenerateParallelDeadlock" line="8" stmtstart="550" stmtend="748" sqlhandle="0x03000500a994e2395b978e00549c00000000000000000000"> -- redacted </frame> <frame procname="adhoc" line="1" sqlhandle="0x02000000d2106b13864677e720efec06d61e0c33c770b8ea"> -- redacted </frame> </executionStack> <inputbuf> </inputbuf> </process> <process id="process948e38"""" status="suspended" spid="53" isolationlevel="read committed (2)" currentdb="5"> <executionStack> <frame procname="adhoc" line="1" sqlhandle="0x020000000e23aa221ede7daa26ce1e248f8ff1bc2ed1d9ce"> -- redacted </frame> </executionStack> <inputbuf> -- redacted </inputbuf> </process> <process id="process94e988""" status="suspended" spid="52" isolationlevel="read committed (2)" currentdb="5"> <executionStack> <frame procname="GenerateParallelDeadlock" line="8" stmtstart="550" stmtend="748" sqlhandle="0x03000500a994e2395b978e00549c00000000000000000000"> -- redacted </frame> <frame procname="adhoc" line="1" sqlhandle="0x02000000d2106b13864677e720efec06d61e0c33c770b8ea"> -- redacted </frame> </executionStack> <inputbuf> </inputbuf> </process> <process id="processbf44d8"""" status="suspended" spid="52" isolationlevel="read committed (2)"> <executionStack> <frame procname="GenerateParallelDeadlock" line="8" stmtstart="550" stmtend="748" sqlhandle="0x03000500a994e2395b978e00549c00000000000000000000"> -- redacted </frame> <frame procname="adhoc" line="1" sqlhandle="0x02000000d2106b13864677e720efec06d61e0c33c770b8ea"> -- redacted </frame> </executionStack> <inputbuf> -- redacted </inputbuf> </process> <process id="processbf4a78""" status="suspended" spid="52" isolationlevel="read committed (2)" currentdb="5" > <executionStack> <frame procname="GenerateParallelDeadlock" line="8" stmtstart="550" stmtend="748" sqlhandle="0x03000500a994e2395b978e00549c00000000000000000000"> -- redacted </frame> <frame procname="adhoc" line="1" sqlhandle="0x02000000d2106b13864677e720efec06d61e0c33c770b8ea"> -- redacted </frame> </executionStack> <inputbuf> </inputbuf> </process> </process-list> |
Listing 16: Processes section for a parallelism-related deadlock graph
The process list reveals two processes, spid 52 and spid 53. In effect, this is a normal writer-writer deadlock, but with one of the processes, spid 52, running in parallel, as indicated by the duplicated process entries. Just ignore the parallel resources and debug this in the same way as the previous writer-writer deadlock.
Let’s compare that with the other kind of parallelism-related deadlock. The processes section of an intra-query parallelism deadlock graph (see Listing 17) will reveal only a single spid.
|
1 2 3 4 5 6 7 8 9 10 11 12 13 14 15 16 17 18 19 20 21 22 23 24 25 26 27 28 29 30 31 32 33 34 |
<process-list> <process id="process1a167a508"" status="suspended" spid="75" isolationlevel="read committed (2)" > <executionStack> <frame procname="" line="10" stmtstart="58" stmtend="77" sqlhandle="0x03001400fb3f7b6d4772f600d4a100000100000000000000" /> </executionStack> <inputbuf /> </process> <process id="process6a258a988"" status="suspended" spid="75" isolationlevel="read committed (2)"> <executionStack> <frame procname="" line="10" stmtstart="58" stmtend="77" sqlhandle="0x03001400fb3f7b6d4772f600d4a100000100000000000000" /> </executionStack> <inputbuf /> </process> <process id="process189753948"" status="suspended" spid="75" isolationlevel="read committed (2)"> <executionStack> <frame procname="" line="10" stmtstart="58" stmtend="77" sqlhandle="0x03001400fb3f7b6d4772f600d4a100000100000000000000" /> </executionStack> <inputbuf /> </process> <process id="process1a167b708"" status="suspended" spid="75" isolationlevel="read committed (2)"> <executionStack> <frame procname="" line="10" stmtstart="58" stmtend="77" sqlhandle="0x03001400fb3f7b6d4772f600d4a100000100000000000000" /> </executionStack> <inputbuf /> </process> </process-list> |
Listing 17: Processes section for an intra-query parallelism deadlock graph
The fact that the intra-query variety of parallelism deadlock can occur at all is a ‘bug’ in the query processor. Such deadlocks shouldn’t be able to occur, but there are cases where they will.
If such a deadlock occurs regularly, the solution is first to tune the query, the idea being that if the query is more efficient then SQL Server won’t need to parallelize it as much or at all and perhaps that will remove the conditions that lead to the deadlock.
If that doesn’t work, then adding a MAXDOP hint to the query to force it to run serially will remove any chance of an intra-query parallelism deadlock, though possibly at the cost of a longer execution time.
Finally, it’s also a good idea to ensure that you’ve patched SQL Server to the latest service pack.
Range Scans and SERIALIZABLE deadlocks
The SERIALIZABLE isolation level is prone to deadlocks because it takes restrictive locks and holds all locks for the duration of the transaction. Any time you see in a deadlock graph a process with isolationlevel="serializable(4)", your first act in the debugging task should confirm whether or not that transaction really needs to run in SERIALIZABLE mode, and if not then whether switching to a lower isolation level resolves the deadlock.
If use of SERIALIZABLE is unavoidable then we’re back to an exercise in tuning the statements and structures that are involved in the deadlock. In this regard, one very common query pattern is very prone to deadlocks resulting from the SERIALIZABLE range locks.
When a transaction runs in SERIALIZABLE isolation level, SQL Server has to prevent phantom rows from appearing in a resultset. It acquires Range locks in order to prevent another transaction from inserting rows into ranges that the SERIALIZABLE transaction is reading. It acquires these locks on a range of the relevant index, or locks the entire table if there isn’t a relevant index.
These range locks appear as RangeS-S, RangeS-U, RangeI-N or RangeX-X locks (again, see Further Reading for more information on these lock types). For our deadlock example, we are interested, specifically in the RangeS-S and RangeI-N locks.
SQL Server acquires the RangeS-S lock when a select query requests a specific row, and is running under SERIALIZABLE isolation.
|
1 |
SELECT CustomerIDFROM Customers WHERE CustomerName = @p1 |
Under SERIALIZABLE isolation level, if that query returns zero rows, then any time it is run again within the transaction it must also return zero rows. Locking the rows where CustomerName = @p1 doesn’t suffice and so SQL Server locks the range in the index which contains the value @p1, it locks the entire range between the index key value before @p1 to the index key value after @p1. Any insert into that range, for values of CustomerName = @p1, or any other value in the range, is blocked.
Likewise, an INSERT running under SERIALIZABLE isolation level has to acquire, briefly, RangeI-N locks until it finds the correct location to insert the new row. If a SELECT statement already holds a RangeS-S lock on the same range, it will block the acquisition of the RangeI-N locks, since RangeS-S and RangeI-N locks are incompatible. Now imagine multiple transactions trying to read and then insert into the same range; it’s a recipe for deadlocks.
Having set the scene, let’s look at an example of the problematic pattern.
|
1 2 3 4 5 6 7 8 9 10 11 12 13 14 15 16 17 18 19 20 21 22 23 |
SET TRANSACTION ISOLATION LEVEL SERIALIZABLE; BEGIN TRANSACTION IF EXISTS ( SELECT 1 FROM [dbo].[Customers] WITH ( ROWLOCK ) WHERE CustomerName = @p1 ) UPDATE dbo.Customers SET LatestOrderStatus = NULL , OrderLimit = 0 WHERE CustomerName = @p1; ELSE INSERT INTO dbo.Customers ( CustomerName , RegionID , OrderLimit , LatestOrderStatus ) VALUES ( @p1 , 0 , 0 , NULL ); COMMIT TRANSACTION |
Listing 18: The ‘Upsert’ pattern
Initially it looks fine (other than a lack of error handling). It’s a traditional ‘upsert’ operation where we insert the row if it doesn’t exist, or update it if it does. There’s a unique index on CustomerName and the rowlock hint ensures that SQL will only lock a single row. Right?
Well, no, not under SERIALIZABLE isolation level. Let’s say that the CustomerName that we’re checking is ‘Matthew Green’, the value immediately below that in the index is ‘Leonard Kotz’ and the value immediately above it is ‘Nicolas van Schalkwyk’. Under SERIALIZABLE isolation level, SQL will lock the entire range from ‘Leonard Kotz’ right through to ‘Nicolas van Schalkwyk’ and subsequently block any attempt to insert any value within that range.
If we have two different sessions trying to insert different customers in that range then both sessions will request and receive RangeS-S locks (it’s a shared lock so multiple sessions can hold it). Both sessions then try to insert the customer rows, with different customer names. To do so, each needs a RangeI-N lock. This lock is not compatible with the RangeS-S that both sessions hold over the same range and so we get a deadlock.
Listing 19 shows a typical deadlock graph.
|
1 2 3 4 5 6 7 8 9 10 11 12 13 14 15 16 17 18 19 20 21 22 23 24 25 26 27 28 29 30 31 32 33 34 35 36 37 38 39 40 41 42 43 44 45 46 47 48 49 50 51 52 53 54 55 56 57 58 59 60 61 62 63 64 65 66 67 68 69 70 71 72 73 74 75 76 77 78 79 80 81 82 83 84 85 86 87 88 89 90 91 92 93 94 95 96 97 98 99 100 101 102 103 104 105 106 107 108 109 110 111 112 113 114 115 116 117 118 119 120 121 122 123 124 125 126 127 128 129 130 131 132 133 |
<deadlock> <victim-list> <victimProcess id="process2f8025c38""""" /> </victim-list> <process-list> <process id="process2f8025c38""""" waitresource="PAGE: 6:1:204 " waittime="4590" ownerId="98391" transactionname="user_transaction" lasttranstarted="2013-12-30T12:16:12.017" XDES="0x2f28f63a8" lockMode="X" schedulerid="3" kpid="3308" status="suspended" spid="52" sbid="0" ecid="0" priority="0" trancount="2" lastbatchstarted="2013-12-30T12:16:12.017" lastbatchcompleted="2013-12-30T12:16:11.283" lastattention="1900-01-01T00:00:00.283" hostpid="4240" isolationlevel="serializable (4)" xactid="98391" currentdb="6" lockTimeout="4294967295" clientoption1="671090784" clientoption2="390200"> <executionStack> <frame procname="adhoc" line="12" stmtstart="64" sqlhandle="0x02000000af049c2b891efce091617388896879874b38bff 00000000000000000000000000000000000000000"> INSERT INTO [dbo].[Customers]([CustomerName],[RegionID], [OrderLimit],[LatestOrderStatus]) values(@1,@2,@3,NULL) </frame> <frame procname="adhoc" line="12" stmtstart="684" stmtend="1062" sqlhandle="0x02000000d01754207294e73fb558a4345b0aa169447175ef 0000000000000000000000000000000000000000"> INSERT INTO dbo.Customers ( CustomerName , RegionID , OrderLimit , LatestOrderStatus ) VALUES ('Bianca Meyer', 0, 0, NULL) </frame> </executionStack> <inputbuf> SET TRANSACTION ISOLATION LEVEL SERIALIZABLE; BEGIN TRANSACTION IF EXISTS (SELECT 1 FROM [dbo].[Customers] WITH (ROWLOCK) WHERE CustomerName = 'Bianca Meyer') UPDATE dbo.Customers SET LatestOrderStatus = NULL, OrderLimit = 0 WHERE CustomerName = 'Bianca Meyer'; ELSE INSERT INTO dbo.Customers ( CustomerName , RegionID , OrderLimit , LatestOrderStatus ) VALUES ('Bianca Meyer', 0, 0, NULL) COMMIT TRANSACTION </inputbuf> </process> <process id="process2ec302188""""" taskpriority="0" logused="276" waitresource="KEY: 6:72057594038976512 (e3bf93c3ba86)" waittime="6594" ownerId="98387" transactionname="user_transaction" lasttranstarted="2013-12-30T12:16:10.013" XDES="0x2f28f76a8" lockMode="RangeI-N" schedulerid="4" kpid="5940" status="suspended" spid="55" sbid="0" ecid="0" priority="0" trancount="2" lastbatchstarted="2013-12-30T12:16:10.010" lastbatchcompleted="2013-12-30T12:11:06.583" lastattention="1900-01-01T00:00:00.583" isolationlevel="serializable (4)" xactid="98387" lockTimeout="4294967295" clientoption1="671090784" clientoption2="390200"> <executionStack> <frame procname="adhoc" line="12" stmtstart="64" sqlhandle="0x02000000af049c2b891efce091617388896879874b38bff 00000000000000000000000000000000000000000"> INSERT INTO [dbo].[Customers]([CustomerName],[RegionID], [OrderLimit],[LatestOrderStatus]) values(@1,@2,@3,NULL) </frame> <frame procname="adhoc" line="12" stmtstart="684" stmtend="1062" sqlhandle="0x0200000094bb05051933a06c504efa475d7eeffcc116e699 0000000000000000000000000000000000000000"> INSERT INTO dbo.Customers ( CustomerName , RegionID , OrderLimit , LatestOrderStatus ) VALUES ('Bey Whiticer', 0, 0, NULL) </frame> </executionStack> <inputbuf> BEGIN TRANSACTION IF EXISTS (SELECT 1 FROM [dbo].[Customers] WITH (ROWLOCK) WHERE CustomerName = 'Bey Whiticer') UPDATE dbo.Customers SET LatestOrderStatus = NULL, OrderLimit = 0 WHERE CustomerName = 'Bey Whiticer'; ELSE INSERT INTO dbo.Customers ( CustomerName , RegionID , OrderLimit , LatestOrderStatus ) VALUES ('Bey Whiticer', 0, 0, NULL) COMMIT TRANSACTION </inputbuf> </process> </process-list> <resource-list> <pagelock fileid="1" pageid="204" dbid="6" subresource="FULL" objectname="Deadlocks.dbo.Customers" id="lock2ec9be480"" mode="X" associatedObjectId="72057594038779904"> <owner-list> <owner id="process2ec302188""""" mode="X" /> </owner-list> <waiter-list> <waiter id="process2f8025c38""""" mode="X" requestType="wait" /> </waiter-list> </pagelock> <keylock hobtid="72057594038976512" dbid="6" objectname="Deadlocks.dbo.Customers" indexname="idx_Customers_CustomerName" id="lock2ec9be580"" mode="RangeS-S" associatedObjectId="72057594038976512"> <owner-list> <owner id="process2f8025c38""""" mode="RangeS-S" /> </owner-list> <waiter-list> <waiter id="process2ec302188""""" mode="RangeI-N" requestType="convert" /> </waiter-list> </keylock> </resource-list> </deadlock> |
Listing 19: Deadlock graph for Range scan and SERIALIZABLE deadlock
The key indicator that we have a deadlock resulting from SERIALIZABLE range locks is the presence of this row:
|
1 |
<waiter id="process2ec302188""""" mode="RangeI-N" requestType="convert" /> |
The process is attempting to convert a lock from RangeS-S to RangeI-N to do the insert and it can’t.
So how do we fix this problem? There are a couple of ways. One way is to ditch the entire IF EXISTS... construct and instead use a MERGE statement. A MERGE operation as a single atomic operation, it doesn’t need SERIALIZABLE isolation level to work correctly and isn’t prone to these deadlocks. On the downside, there are some annoying bugs with MERGE.
Another option is to ditch the IF EXISTS and use two statements, an update and an insert.
|
1 2 3 4 5 6 7 8 9 10 11 12 13 14 15 16 17 18 |
UPDATE dbo.Customers SET LatestOrderStatus = NULL , OrderLimit = 0 WHERE CustomerName = @p1; INSERT INTO dbo.Customers ( CustomerName , RegionID , OrderLimit , LatestOrderStatus ) SELECT @p1~ , 0 , 0 , NULL WHERE NOT EXISTS ( SELECT 1 FROM dbo.Customers AS c WHERE CustomerName = @p1 ) |
Listing 20: Replace IF EXISTS with separate UPDATE and INSERT statements
This may look strange, especially the SELECT with a WHERE but no FROM, but this is valid. Now that we have two separate statements without a transaction, the worst that can happen is that the INSERT is blocked; it can no longer cause deadlocks.
Finally, if we want to keep the IF EXISTS structure, we can add another locking hint.
|
1 2 3 4 5 6 7 8 9 10 11 12 13 14 15 16 17 18 19 20 21 |
BEGIN TRANSACTION IF EXISTS ( SELECT 1 FROM [dbo].[Customers] WITH ( ROWLOCK, UPDLOCK ) WHERE CustomerName = @p1 ) UPDATE dbo.Customers SET LatestOrderStatus = NULL , OrderLimit = 0 WHERE CustomerName = @p1; ELSE INSERT INTO dbo.Customers ( CustomerName , RegionID , OrderLimit , LatestOrderStatus ) VALUES ( @p1 , 0 , 0 , NULL ); COMMIT TRANSACTION |
Listing 21: Using the UPDLOCK hint
Update locks are not compatible with other update locks and so this serializes the entire process. The second process to run is blocked right at the beginning by the locks that the first one has taken. Until the first one completes the entire process, the second one cannot start to run.
Partition escalation deadlocks
This type of deadlock is only possible on a partitioned table where the table’s lock_escalation option has been set to AUTO, which on a partitioned table allows lock escalation to go to the partition level rather than the table.
The default lock_escalation option, TABLE, does not allow this deadlock to occur and the fact that this deadlock can occur when lock escalation is set to AUTO is the reason why it’s not the default on partitioned tables!
Before we dig into this one, we need a very quick summary of lock escalation (see Further Reading for more). SQL Server will start locking at the lowest granularity it thinks is reasonable for the operation in hand. Typically, it uses row or page locks. However, if the number of locks on a single object exceeds a threshold (currently 5000), or the memory used for locks exceeds a percentage of SQL’s memory (currently 40%), then it triggers lock escalation. SQL Server will try to replace the row or page locks on the object with a table-level or partition-level lock, depending on the setting of the table’s LOCK_ESCALATION option, and on whether or not the index is partitioned.
Let’s look at a deadlock graph (yes, this is a contrived example).
|
1 2 3 4 5 6 7 8 9 10 11 12 13 14 15 16 17 18 19 20 21 22 23 24 25 26 27 28 29 30 31 32 33 34 35 36 37 38 39 40 41 42 43 44 45 46 47 48 49 50 51 52 53 54 55 56 57 58 59 60 61 62 63 64 65 66 67 68 69 70 71 72 73 74 75 76 77 78 79 80 81 82 83 |
<deadlock> <victim-list> <victimProcess id="process2ed5bd498""""" /> </victim-list> <process-list> <process id="process2ed5bd498""""" waitresource="HOBT: 9:72057594040090624 " transactionname="user_transaction" lockMode="IS" spid="52" sbid="0" ecid="0" priority="0" trancount="1" lastbatchstarted="2013-12-19T16:18:38.003" lastbatchcompleted="2013-12-19T16:07:51.777" clientapp="Microsoft SQL Server Management Studio - Query" isolationlevel="repeatable read (3)"> <executionStack> <frame procname="adhoc" line="10" stmtstart="452" stmtend="616" sqlhandle="0x02000000d4cccd376fce07789a95b02531a0c3b366bca36 00000000000000000000000000000000000000000"> SELECT MAX(invoiceDate) FROM dbo.Invoices AS i WHERE InvoiceDate > '2013/12/01' </frame> </executionStack> <inputbuf> UPDATE dbo.Invoices SET Status = 'Archived' WHERE InvoiceDate BETWEEN '2013/11/02' AND '2013/11/20' SELECT MAX(invoiceDate) FROM dbo.Invoices AS i WHERE InvoiceDate > '2013/12/01' </inputbuf> </process> <process id="process2ed5bccf8"""" waitresource="HOBT: 9:72057594040025088 " transactionname="user_transaction" lockMode="IS" spid="53" lastbatchstarted="2013-12-19T16:18:38.893" lastbatchcompleted="2013-12-19T16:17:35.670" clientapp="Microsoft SQL Server Management Studio - Query" isolationlevel="repeatable read (3)" > <executionStack> <frame procname="adhoc" line="10" stmtstart="452" stmtend="616" sqlhandle="0x0200000005e48d295a25040639fd7bd6a903f9f84275e574 0000000000000000000000000000000000000000"> </frame> <frame procname="adhoc" line="10" stmtstart="452" stmtend="616" sqlhandle="0x02000000d51ecc3334b00dd0f0886da242d6ff064c838e07 0000000000000000000000000000000000000000"> SELECT MAX(invoiceDate) FROM dbo.Invoices AS i WHERE InvoiceDate < '2013/12/01' </frame> </executionStack> <inputbuf> UPDATE dbo.Invoices SET Status = 'Archived' WHERE InvoiceDate BETWEEN '2013/12/02' AND '2013/12/20' SELECT MAX(invoiceDate) FROM dbo.Invoices AS i WHERE InvoiceDate < '2013/12/01' </inputbuf> </process> </process-list> <resource-list> <hobtlock hobtid="72057594040090624" subresource="FULL" dbid="9" objectname="Deadlocks.dbo.Invoices" indexname="idx_Test" id="lock2de692e80"" mode="X" associatedObjectId="72057594040090624"> <owner-list> <owner id="process2ed5bccf8"""" mode="X" /> </owner-list> <waiter-list> <waiter id="process2ed5bd498""""" mode="IS" requestType="convert" /> </waiter-list> </hobtlock> <hobtlock hobtid="72057594040025088" subresource="FULL" dbid="9" objectname="Deadlocks.dbo.Invoices" indexname="idx_Test" id="lock2e1645800"" mode="X" associatedObjectId="72057594040025088"> <owner-list> <owner id="process2ed5bd498""""" mode="X" /> </owner-list> <waiter-list> <waiter id="process2ed5bccf8"""" mode="IS" requestType="convert" /> </waiter-list> </hobtlock> </resource-list> </deadlock> |
Listing 22: Deadlock graph for a partition escalation deadlock
What happened here is that each of the updates affected only one partition. At the point that the escalation threshold was hit, SQL Server escalated the initial row locks to partition-level locks (because partition-level locking is enabled). At the point that the updates finished, each session had an exclusive lock on a different, single partition of the table. The select then requires a lock on the other partition of the table, which causes the deadlock.
Essentially:
- Process 1 requests row-level X locks on Partition 1 of a table
- Process 2 requests row-level X locks on Partition 2 of a table
- Process 1’s locks are escalated to partition-level
- Process 2’s locks are escalated to partition-level
At this point, each process holds an exclusive lock on a different partition of the table
- Process 1 requests a shared lock on a row in Partition 2 of the table. It is blocked.
- Process 2 requests a shared lock on a row in Partition 1 of the table. It is blocked
Now we have a deadlock and SQL Server’s deadlock detector identifies it and kills one of the sessions
If the lock_escalation option was set to the default of table, this deadlock would not occur. With the lock escalation set to table, if both updates had started taking locks and then one or both triggered a lock escalation, the escalation to table locks would fail. Locks cannot be escalated to table if there are any incompatible locks already on any of the rows or pages in the table. With the escalation having failed, the X locks that each update took would stay as row locks. The select, which then needed a lock on a row not affected by the update, could then get the lock it needs and both queries would complete without deadlocking
With deadlocks like this, where one of the locks is at the HoBT level, the first step should be changing the index’s lock settings to escalate to table. If the deadlock is caused by partition-level lock escalation then this change will remove the chance of deadlock occurring. If the deadlocks still occur even with escalation set to table, then the deadlock should be debugged as for a reader-writer or writer-writer deadlock, as detailed earlier.
Handling deadlocks
The best way to deal with deadlocks is via error handling and retries. All application code that deals with database queries should have error handling. To be honest, all application code should have proper error handling, but I might as well also wish for peace on earth and an end to poverty.
If application code assumes that any database query will succeed, that code is brittle and a potential problem because there are a number of issues that can cause database calls to fail.
Any form of high availability failover drops connections. If the application assumes that a connection is open and runs a query it will get an error. If the application doesn’t handle the error properly, the application can crash or the user can get a message about something they probably don’t understand and almost certainly don’t care about. Likewise, deadlocks, or update conflicts, depending on isolation level, can cause a query to fail. If the application doesn’t handle the error properly, the consequences are the same.
Application code should have error handling and retry logic on any data-access code. If a query fails, the error handling code should look at what error was raised and decide, based on that error, whether to retry the query, or log the failure and send the user a meaningful error (see Further Reading).
Summary
I hope that this article will serve you as a good reference piece, in recognizing and resolving the different types of deadlock that can afflict your SQL Servers, and the business operations that run on them. I hope it will also help you to identify the sort of coding mistakes and (anti)patterns that make them more likely to occur, especially on busy systems with a high level of concurrent access.
If you can deploy on your SQL Server instances one of the row-versioning isolation levels (SNAPSHOT or READ_COMMITTED_SNAPSHOT), then by definition you rule out the possibility of any form of Reader-Writer deadlock, since readers won’t acquire Shared locks in these modes.
Beyond that, avoiding deadlocks is largely an exercise in query and index tuning. I haven’t had room in this piece to digress too far into this huge topic, but the references I provide in Further Reading, below, should help direct your efforts.
Further Reading
- Query Tuning
- Finding the causes of poor performance in SQL Server, Part 2, by Gail Shaw
- SQL Server 2012 Query Performance Tuning 3rd Edition (Book), by Grant Fritchey
- Chapters 5 and 6 of Troubleshooting SQL Server (free eBook), by Jonathan Kehayias and Ted Krueger
- Lock types, lock modes, lock compatibility
- Chapter 6 of Troubleshooting SQL Server
- Chapters 2 and 3 of Kalen Delaney’s SQL Server Concurrency (free eBook).
- Transactions, isolation levels (inc. row versioning)
- Chapters 1 and 6 of SQL Server Concurrency.
- Error handling (SQL Server and client-side)
- Chapter 8 of Defensive Database Programming (free eBook) by Alexander Kuznetsov