SQL Developer is a free tool provided by Oracle. It has a wide variety of options and utilities to help in day to day development or support activities. Some of the key features are discussed here to help navigate the tool and better understand it. Compared to other tools for Oracle database, this comes in handy for database development and support tasks.
Schema Browser – Scan the database
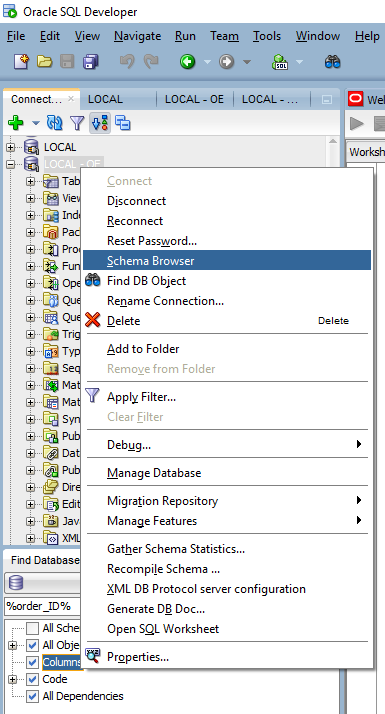
The database connections can be easily set up using a TNS name file or keying in all the connection details. Any person who connects to a schema would like to check its contents and browse through it. Schema Browser helps to review the existing objects in the schema. To open, right-click on the connection name and select Schema Browser. It also helps to browse through other schemas based on the permissions granted in the database.
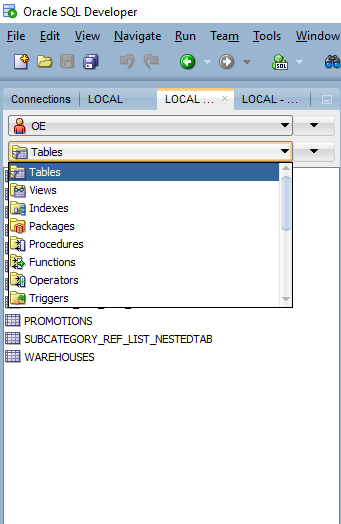
The schema browser shows Tables, Views, Indexes, Packages, Procedures, Functions, Operators, Triggers, Types, Sequences, Materialized Views, Synonyms, and few other object types for the selected schema.
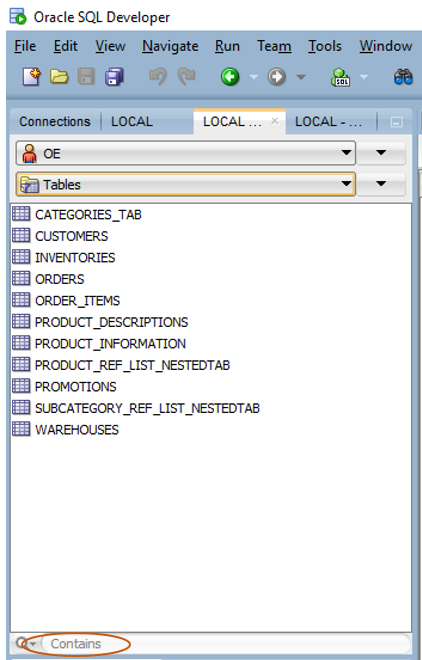
One other option is to search the objects by name in the selected type. To do this, type the search string in the contains area.
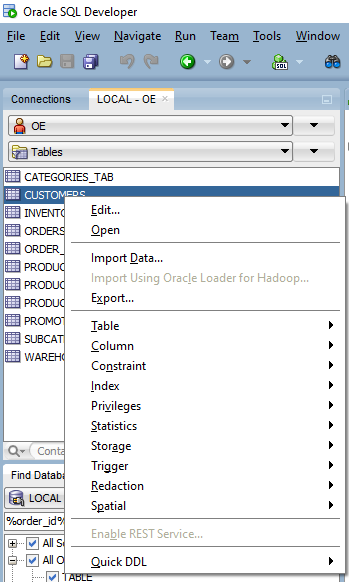
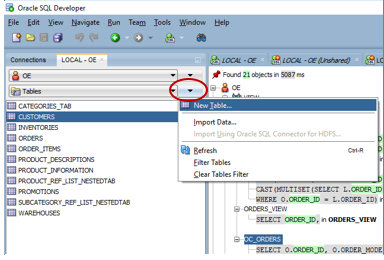
From here, based on the object type, all its related operations can be performed at ease. By right-clicking on the object, it can be viewed, edited, recompiled, or executed. The below figure shows the whole range of operations available for table oe.customers.
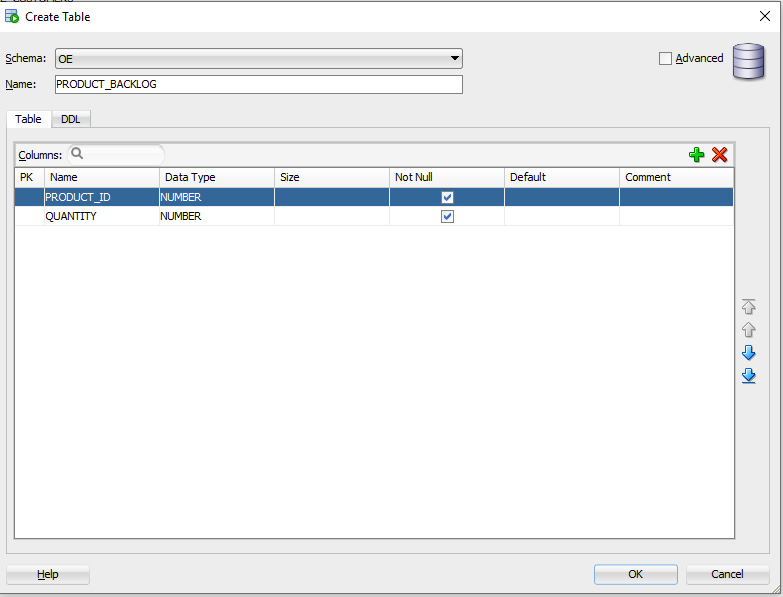
By clicking the down arrow next to Tables, New Table can be created by just filling in the values without writing the DDL statement.
You can enter the table name, column name, data type, and all other parameters here.
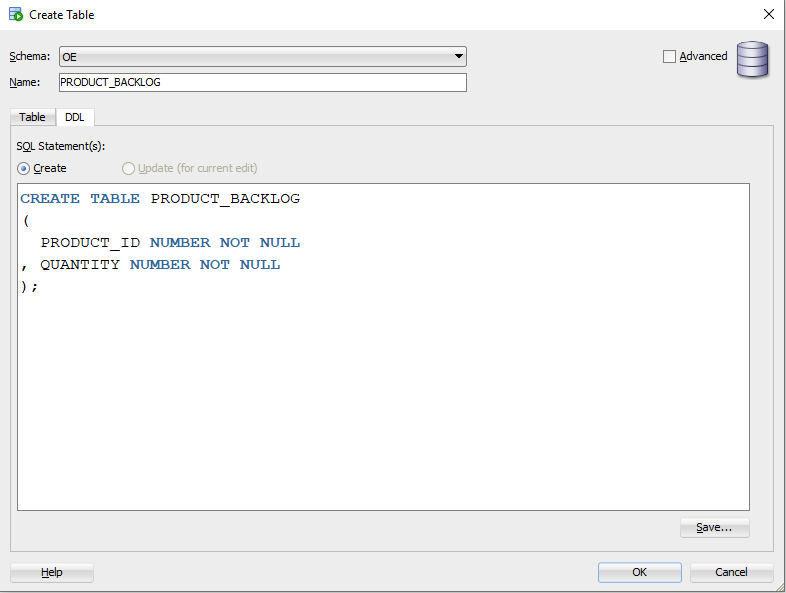
After keying in the values, the DDL tab provides the corresponding SQL statement to prepare any deployment scripts.
Unshared SQL worksheet and SQL History – A multi-tasker with a good memory
SQL worksheets are commonly used to run queries and to execute any PL SQL process. By default, the sheets open in shared mode. When running SQL statements in multiple sheets, the SQL statements run based on the execution order. A process run in one worksheet has to be completed for the next one to kick off.
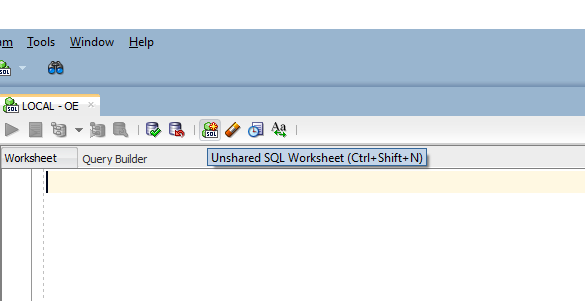
One unique feature available in SQL Developer is to open up SQL worksheets in unshared mode. Click the Unshared SQL Worksheet icon or use the shortcut is CTRL + SHIFT + N. to open it.
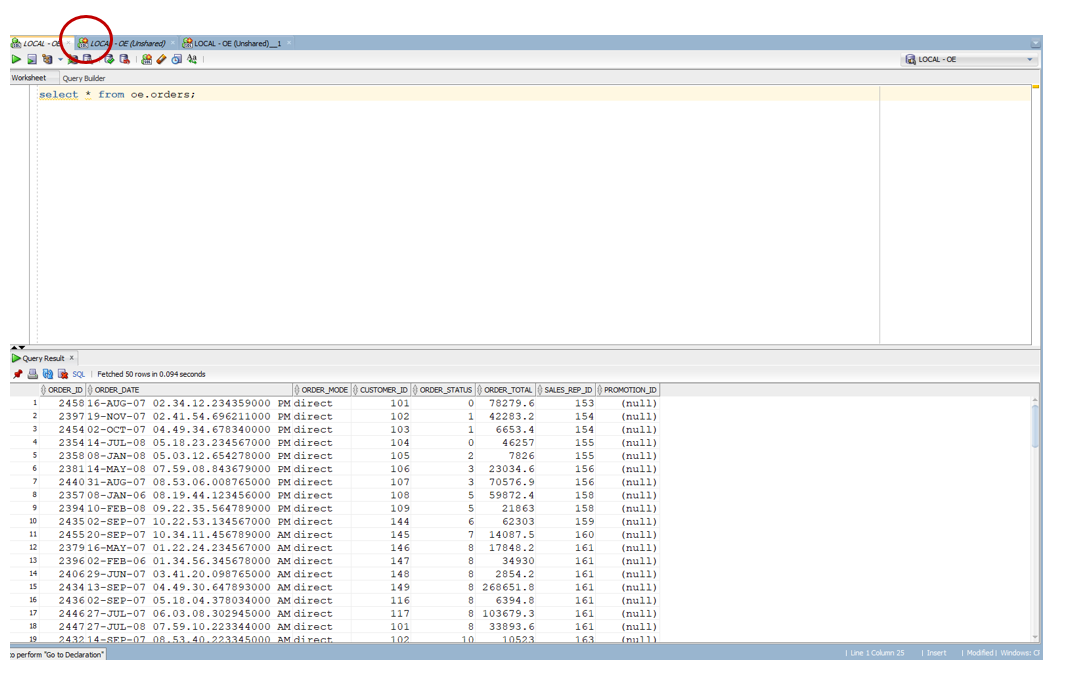
Unshared SQL worksheet helps to execute different queries or processes in parallel. Each of these sheets acts as a separate database connection. This will save a considerable amount of development time as multiple tasks can be done in parallel, like fetching data from two different views, validating more than one process, etc. The unshared SQL worksheets contain a * icon in the sheet name.
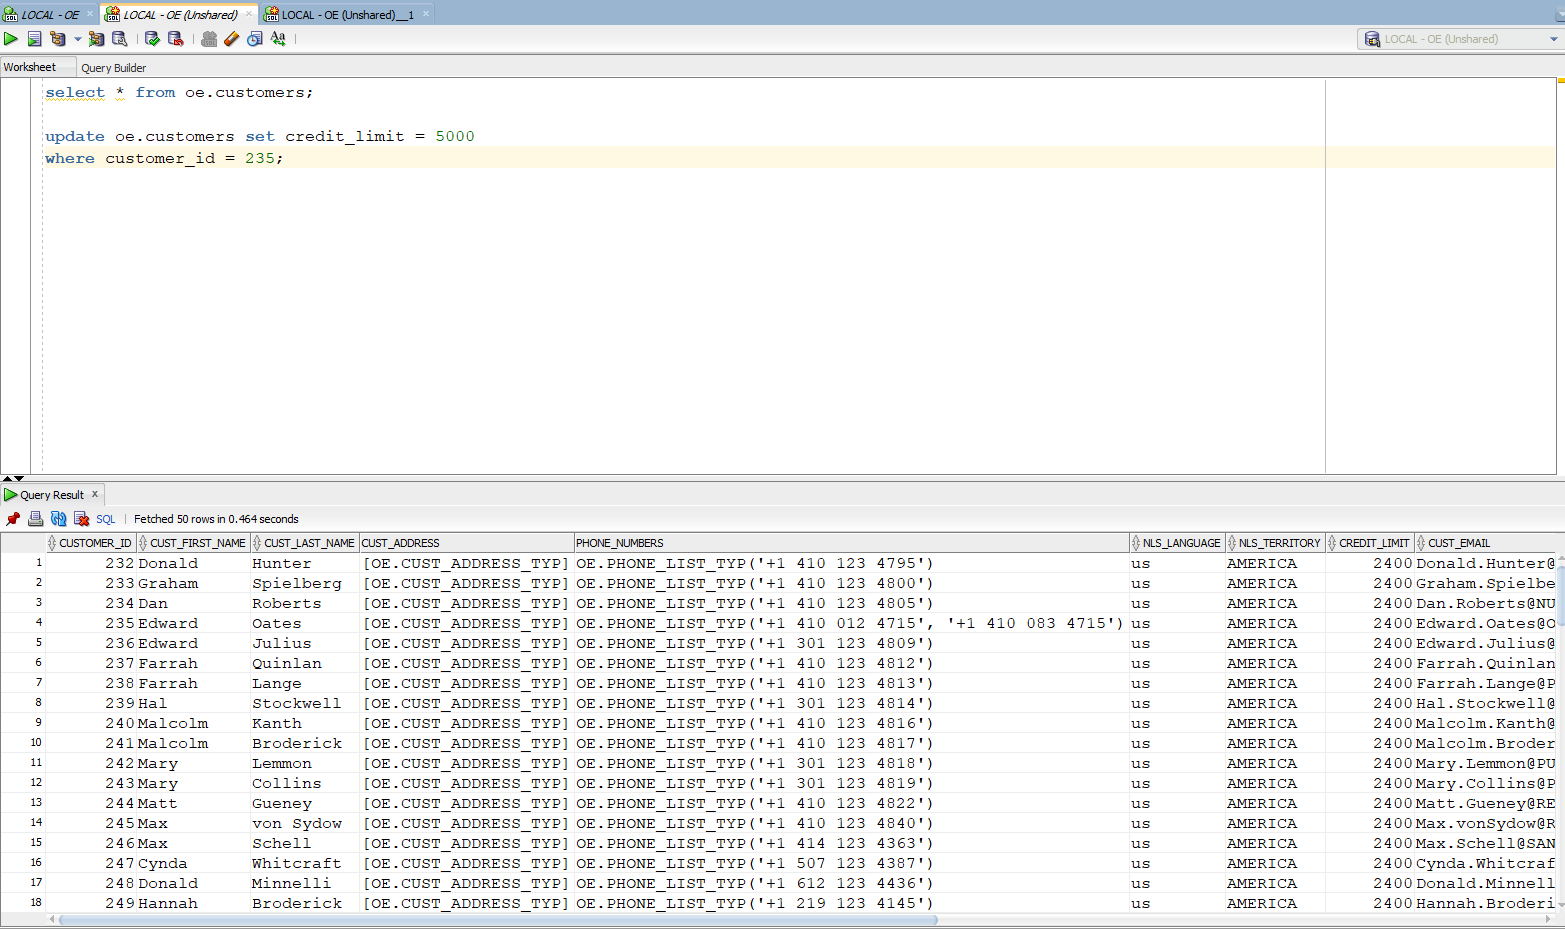
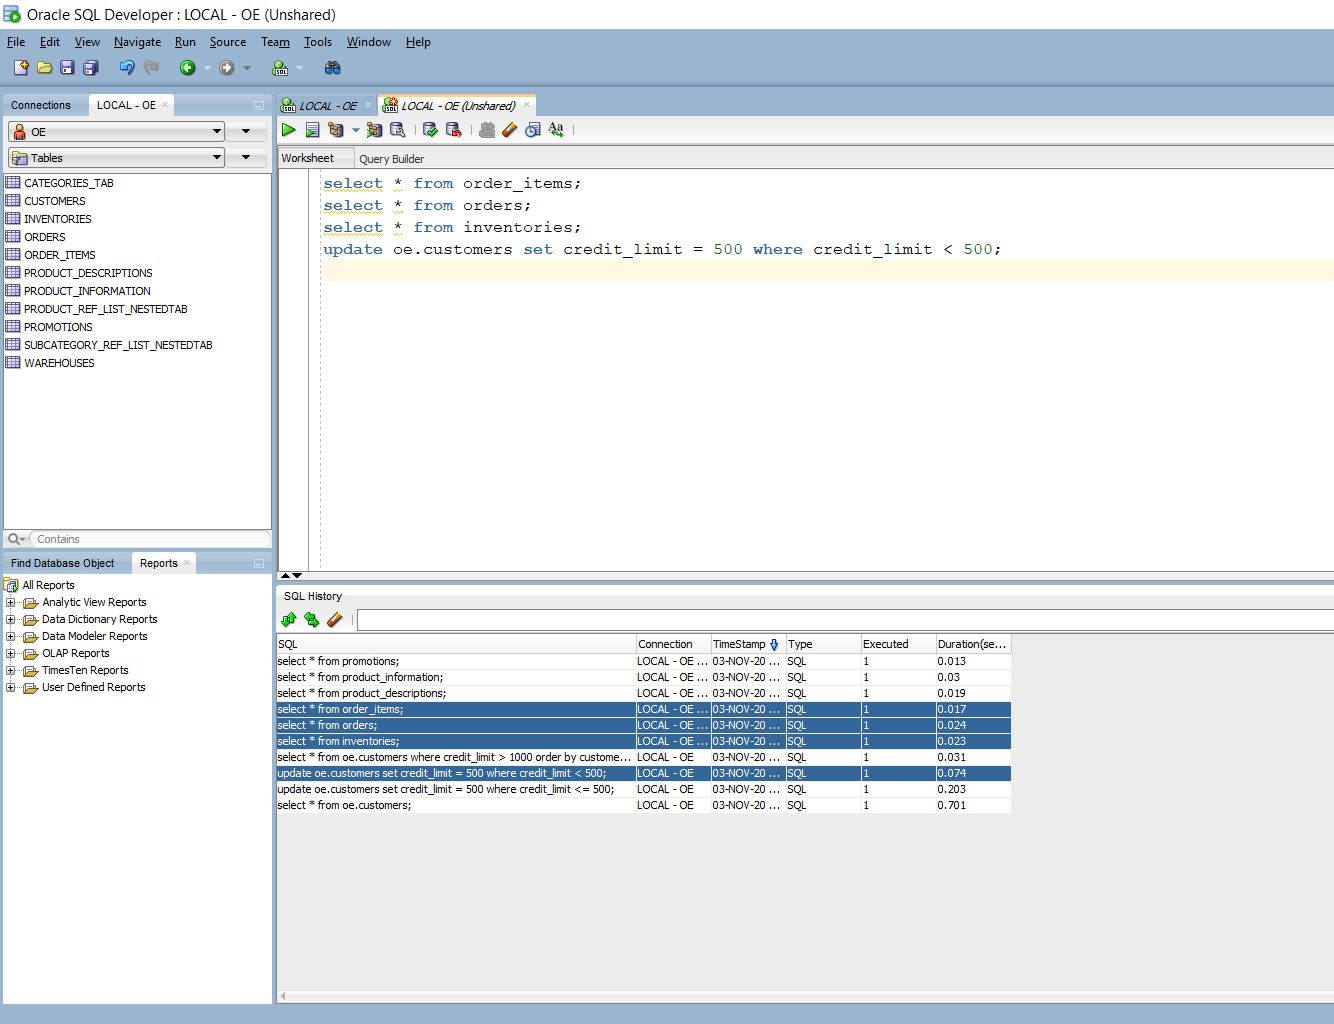
These unshared SQL worksheets work as independent sessions, and so a DML operation performed on one worksheet does not reflect on the other until it is committed. The update statement executed in sheet LOCAL – OE (Unshared) does not reflect in the data used in other worksheets without running a commit.
Also, any number of repeated rollbacks can be performed without impacting data on other sessions. This provides the flexibility of handling data in two or more ways simultaneously for any specific testing. Multiple unshared SQL worksheets can be opened up from each database connection.
If the sessions disconnect for any reason, the tool automatically reconnects when a SQL is executed in this sheet. A good practice would be to limit the number of unshared worksheets to two or three, as it would be hard to keep track of what operations are performed in each of the sheets.
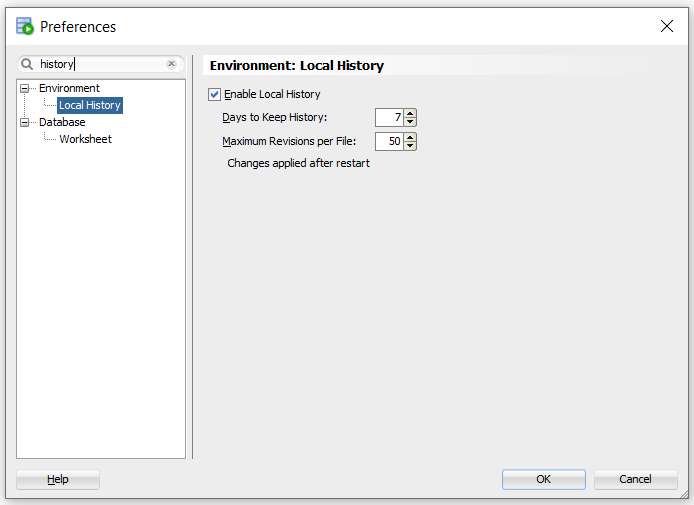
The SQL history option would be your savior if you forgot to store your recently executed SQL statements or PL SQL process. Go to Tools -> Preferences -> Environment -> Local history to enable history or modify settings, and by default, this option will be enabled.
This saves the history of executed SQL statements in the current SQL Developer session. With this, you can pull most of the recently executed SQL with a single click. It is also helpful when you keep enhancing a SQL statement and later refer back to its previous versions.
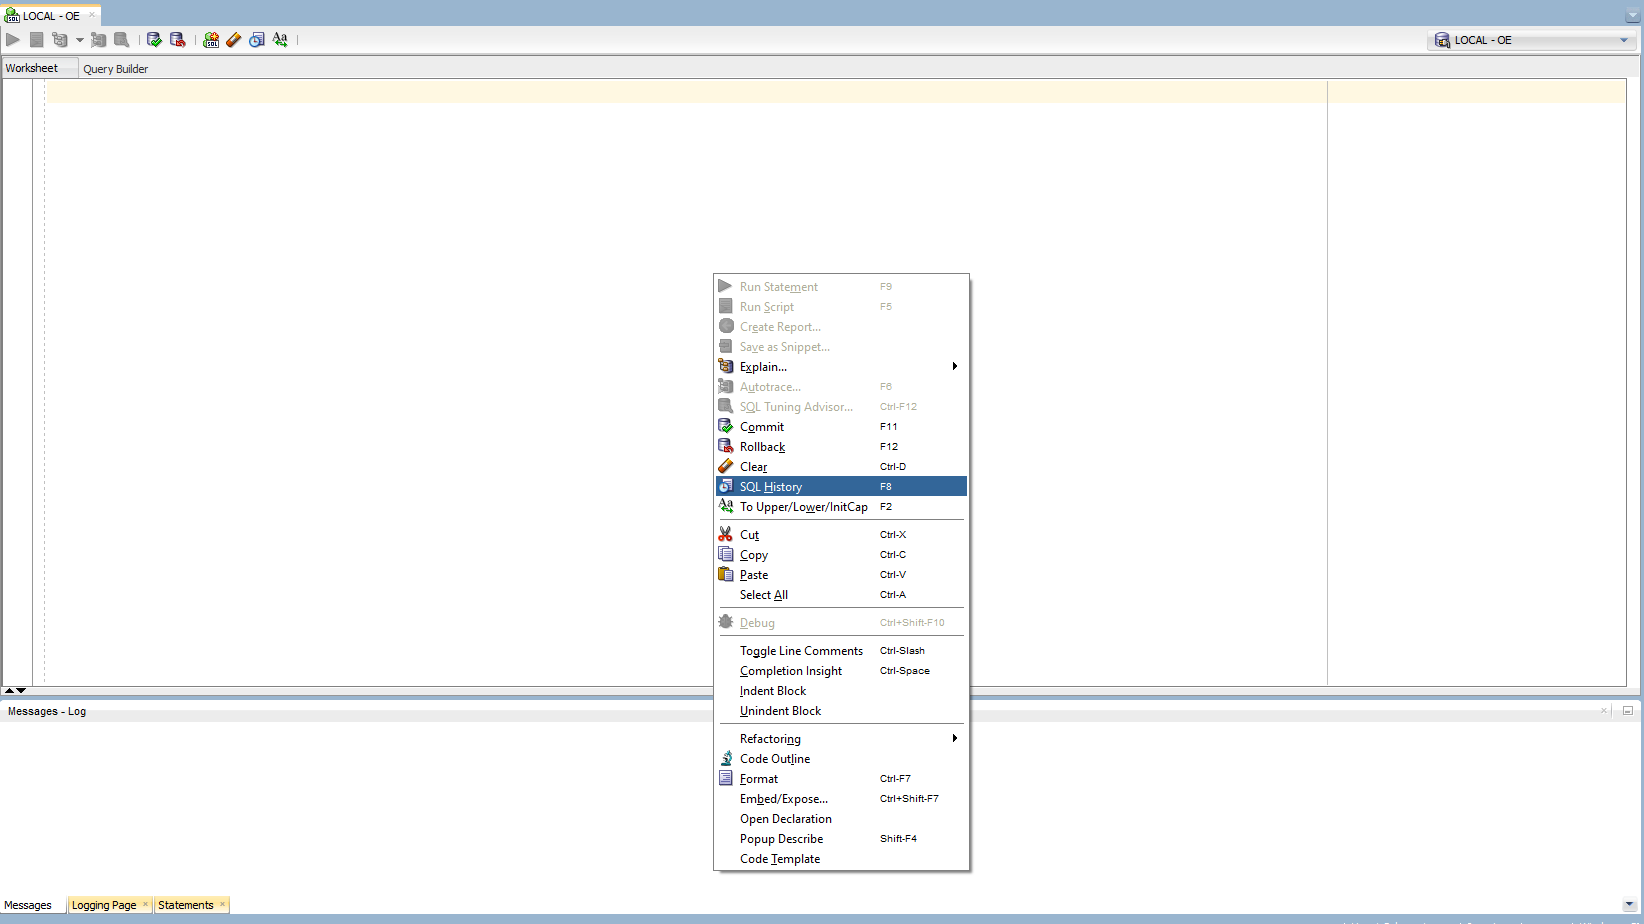
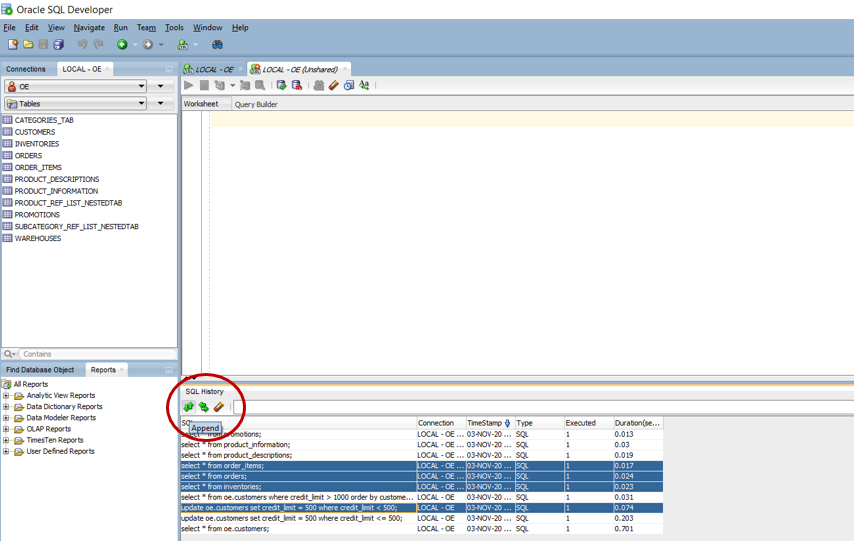
To open up the history, hit the F8 key or right-click and choose SQL history on any SQL worksheet.
The SQL history opens up at the bottom and now, choose the required SQL statements. Click the ![]() to append the selected statements to the existing SQL worksheet. You can highlight multiple SQL statements and copy all of them to the worksheet at once.
to append the selected statements to the existing SQL worksheet. You can highlight multiple SQL statements and copy all of them to the worksheet at once.
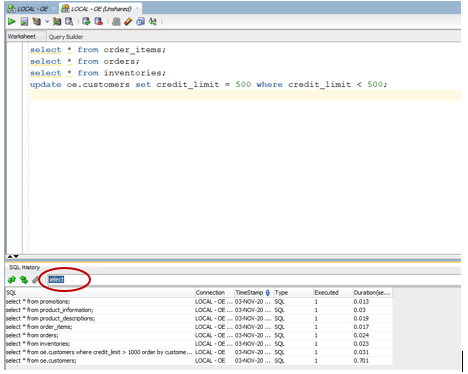
The highlighted SQL statements got added to the SQL worksheet in one shot.
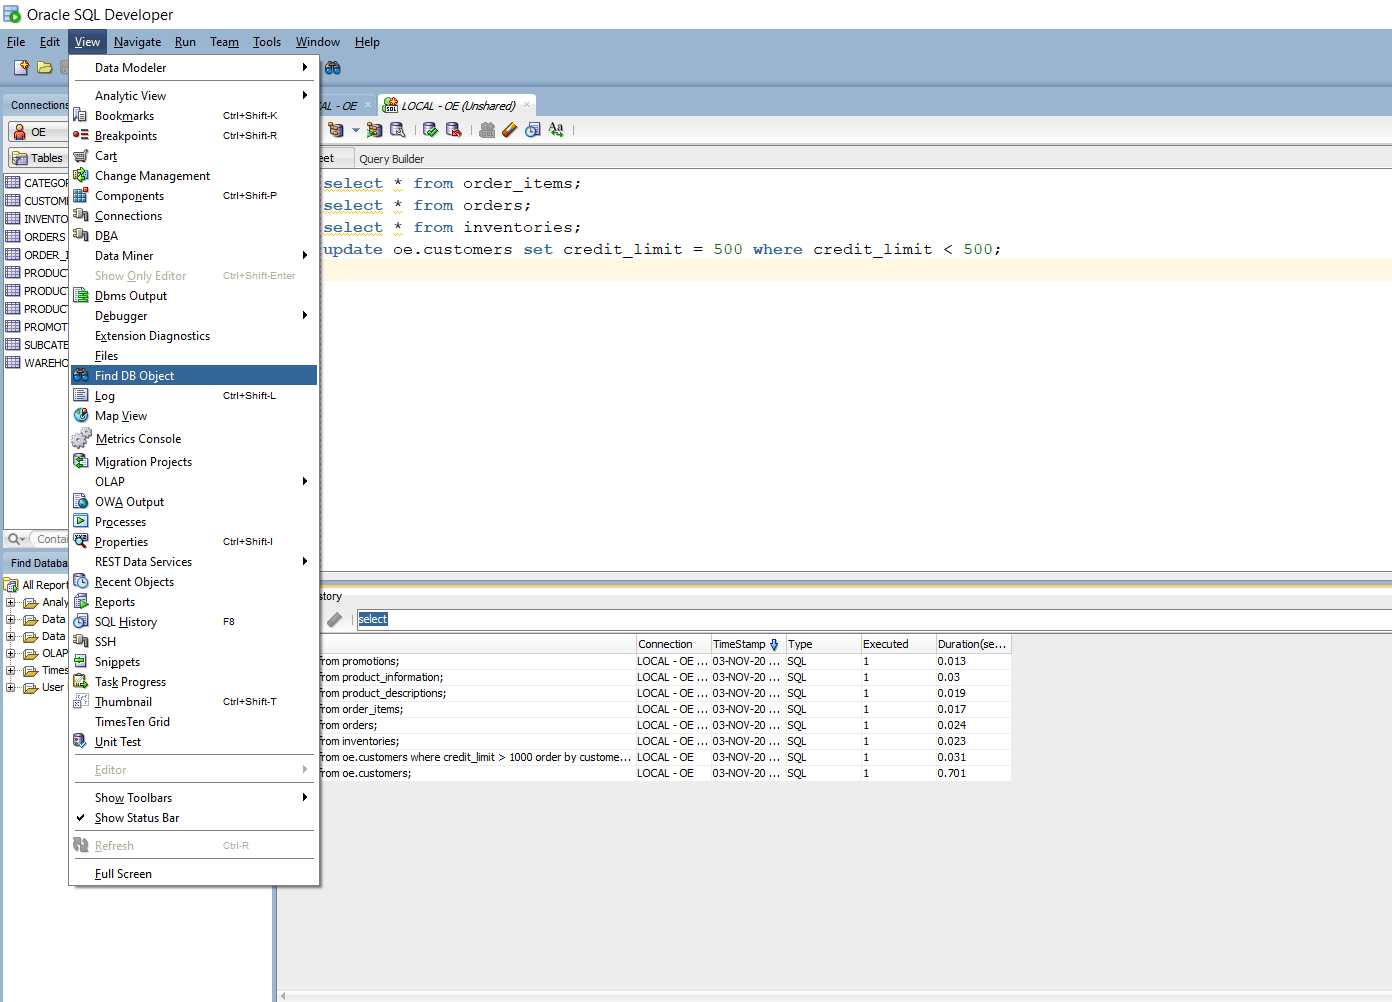
There is also a search option with this window. This helps to narrow down the SQL statements based on an object name, SQL functions used, or any other specific detail from the SQL statement. The keyword select is entered in the search box to filter only SQL statements containing select.
Find DB object – Catch me if you can
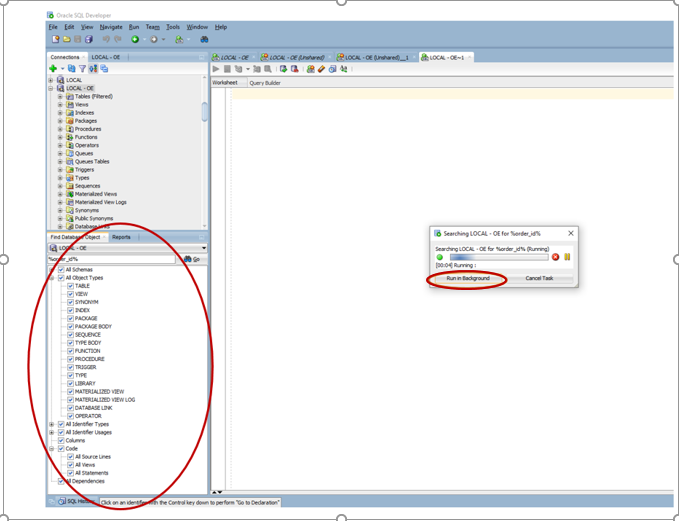
This search feature is great to perform impact analysis across the database. It helps to identify the dependencies and directly look into the code segment containing the object name or literals or any other search string. Go to View -> Find DB object to open up the window.
You can customize the search by selecting the required schemas, object types, or include/exclude source code. If a search is going to take a long time, it can be run in the background as well; this allows you to work on other items when the search is running.
The various objects using the searched string are shown.
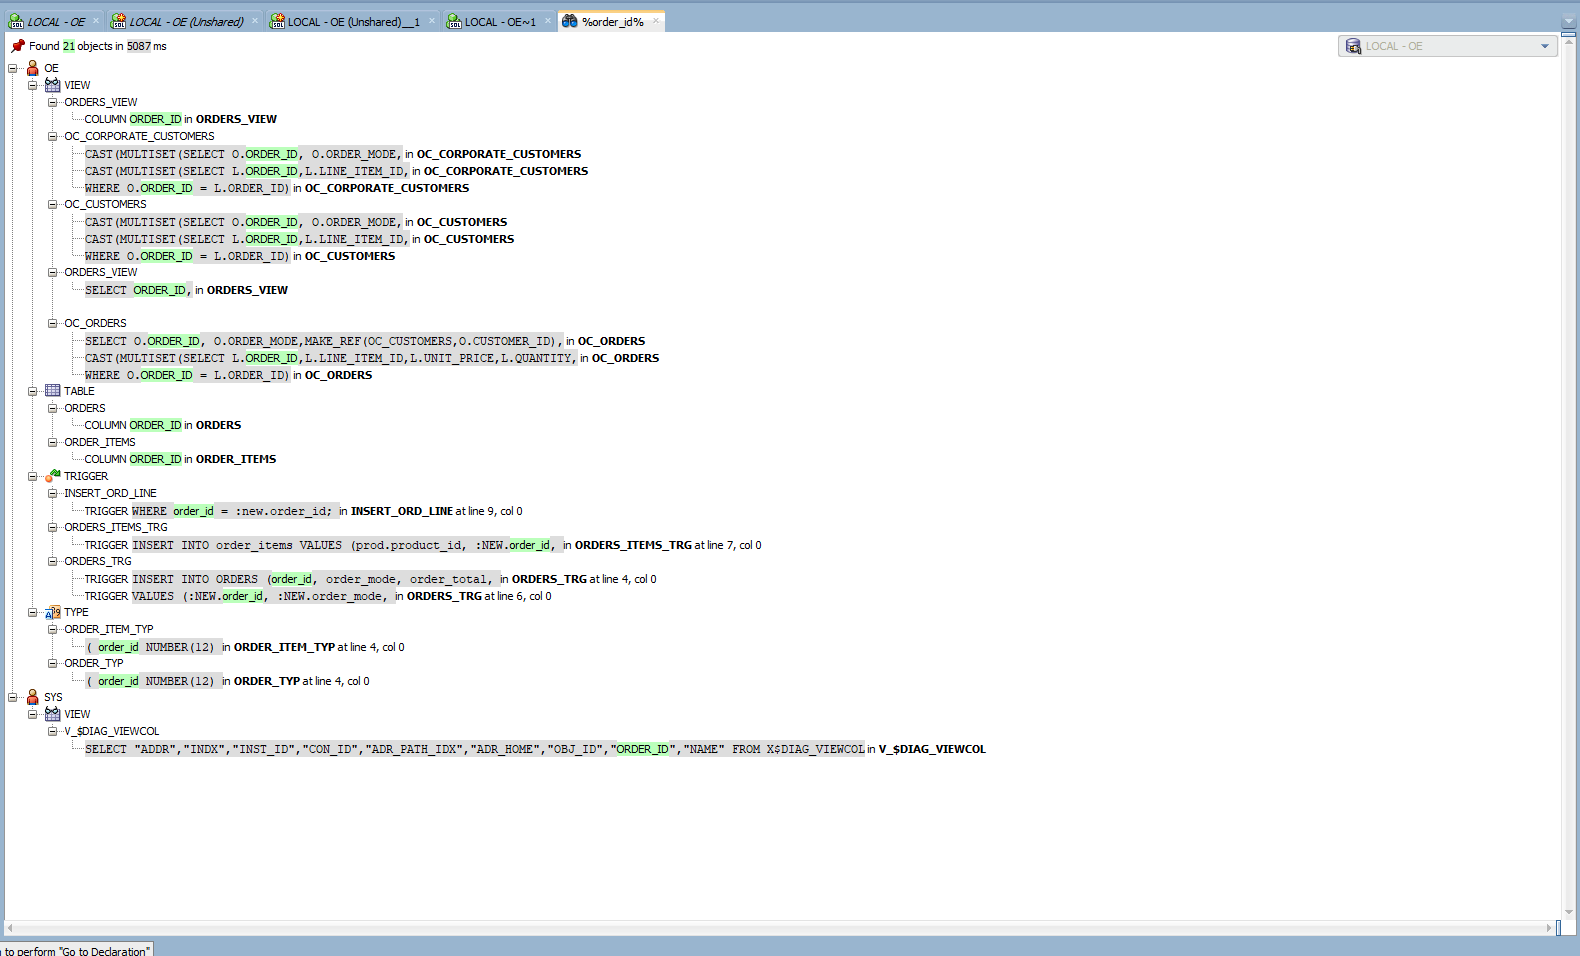
By clicking the line of code from the search results, the respective object opens up. With this, you can quickly look into all the impacted objects and save many clicks in individually opening them through a schema browser.
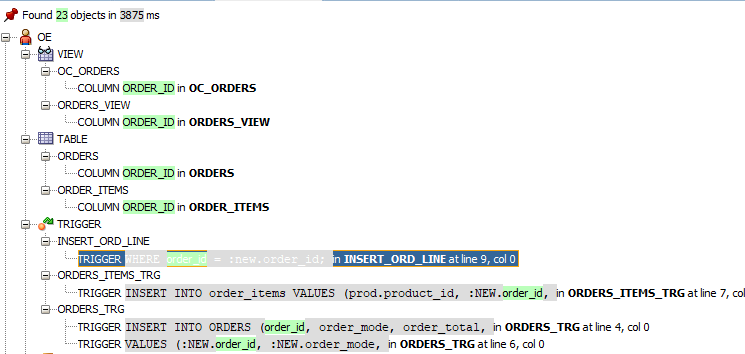
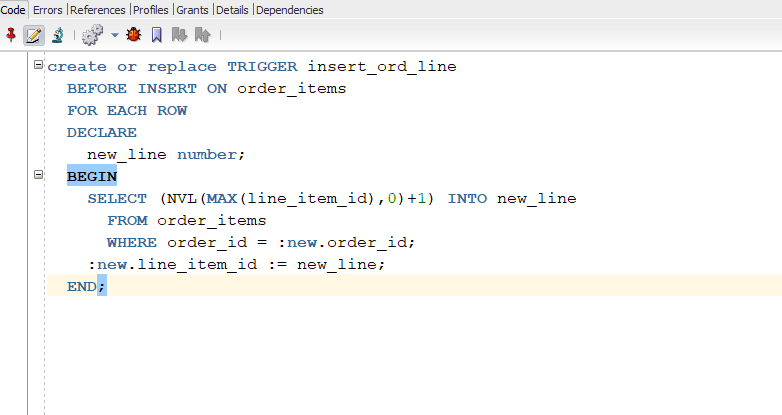
The trigger INSERT_ORD_LINE opens up after clicking it from the search results, as shown below.
Search results can also be collapsed or expanded at the schema level.
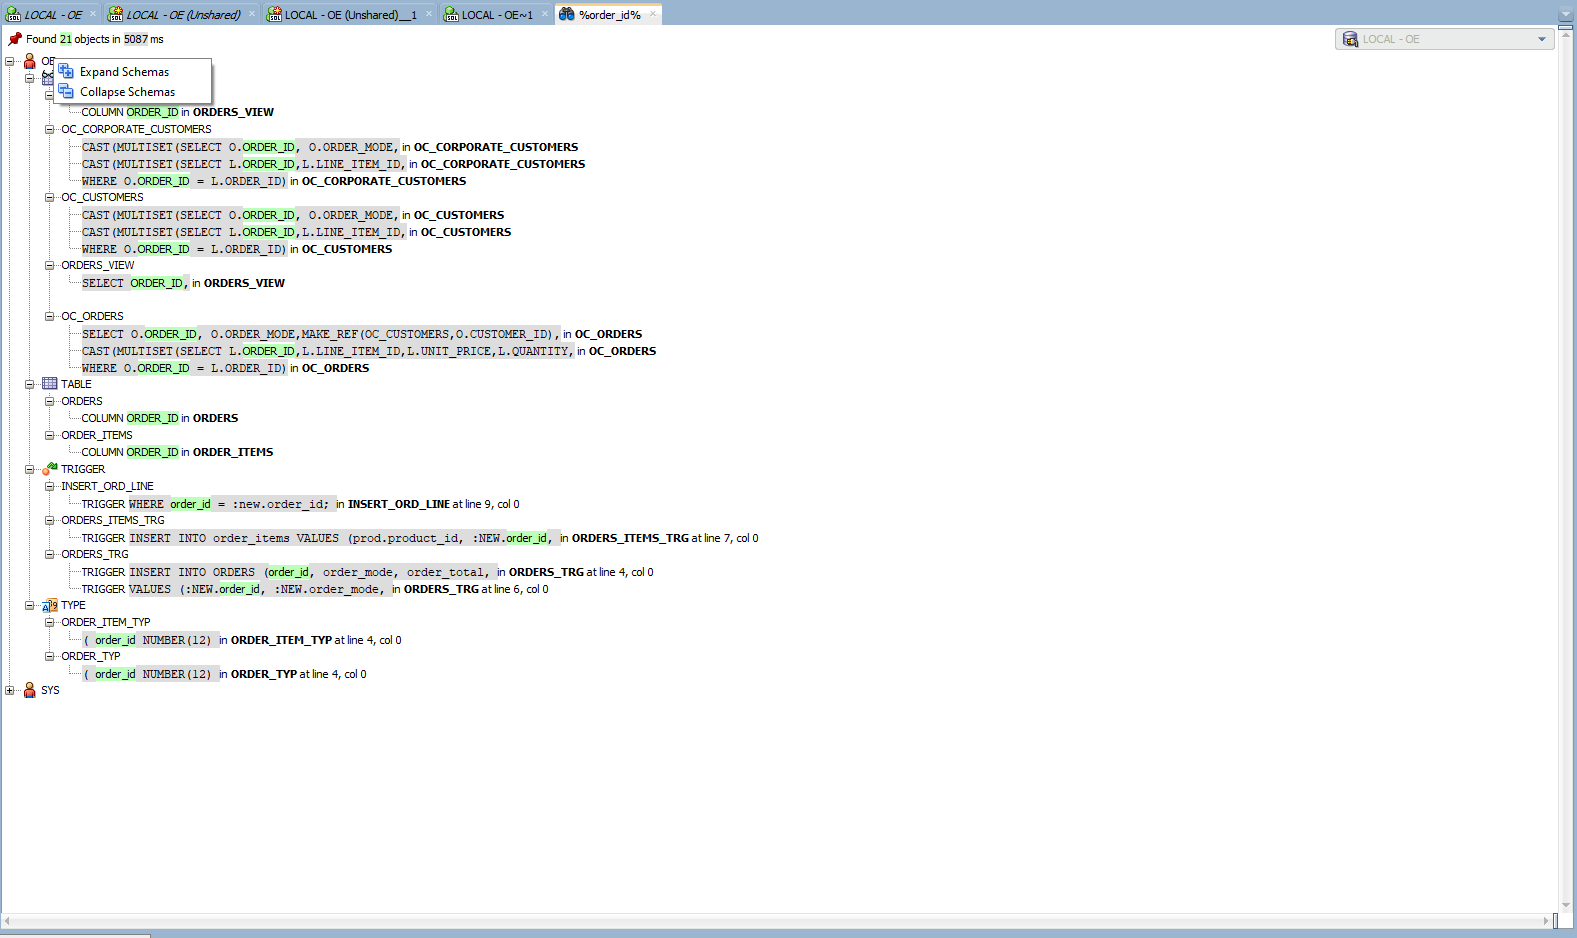
There is a limitation in the output; only up to 500 records are displayed on this search screen. For any extensive searches, one approach would be to break it down into multiple searches restricting into limited schemas.
Database compare – Catch the difference
This option helps to compare two schemas, usually between different databases. Navigate to Tools -> Database Diff to access it. After refreshing the database or post-deployment, you can run this process to ensure the required objects are available or to check if the migration is successful.
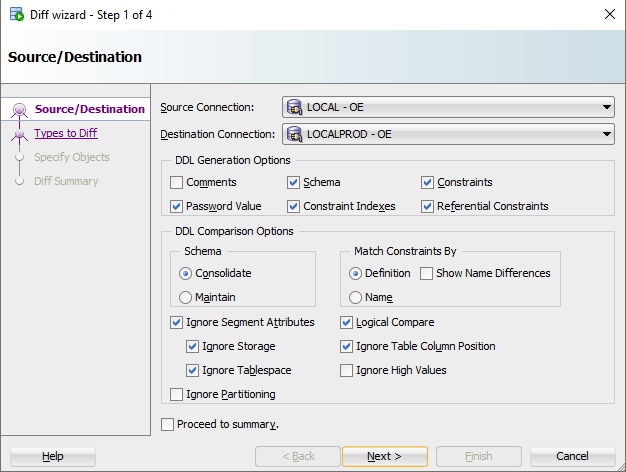
After clicking Database Diff, choose the database connections and various other comparison options in Step 1 of 4.
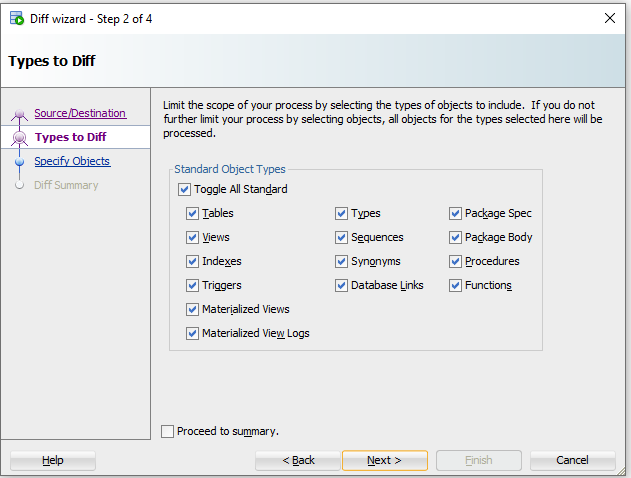
Choose the object types to be compared between the selected schemas in Step 2 of 4.
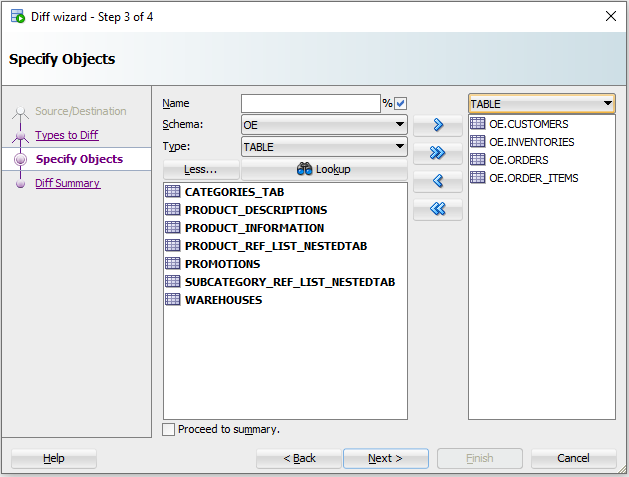
In Step 3 of 4, you have an option to run the comparison for a specific set of objects. To do that, select the schema, type, and click ![]() . The list of all items is shown; choose the required ones, click
. The list of all items is shown; choose the required ones, click ![]() to finalize. To include all objects, just hit Next and move on.
to finalize. To include all objects, just hit Next and move on.
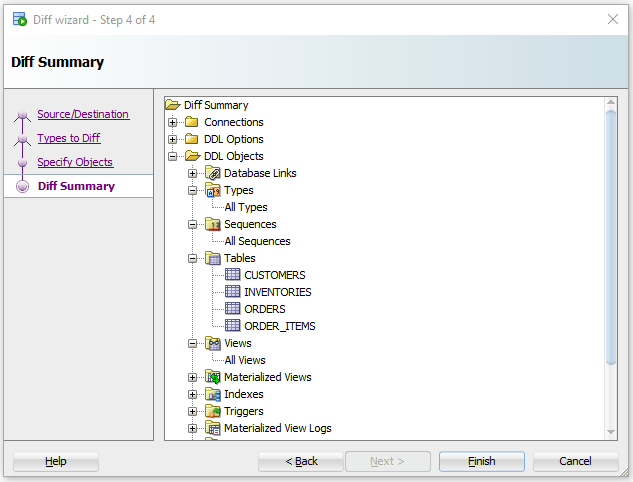
In Step 4 of 4, the summary of the comparison performed is shown. Click Finish to generate the report. As you can see, for tables, only the identified ones from Step 3 are included.
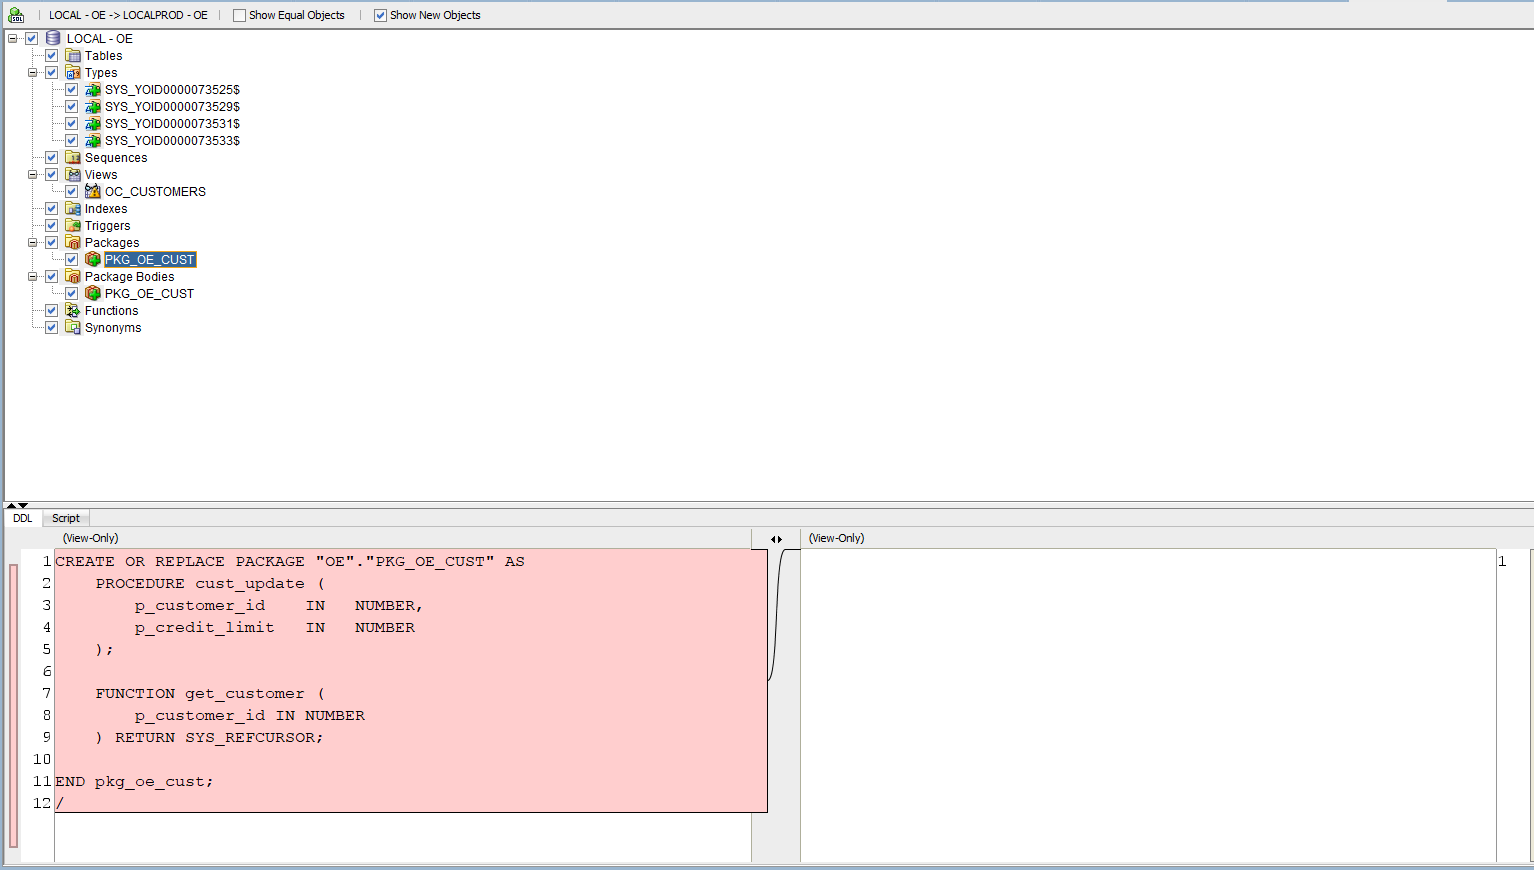
The summary of the comparison is shown below. Any objects available in one schema but not in another is highlighted in green. You can see the details by clicking the item. PKG_OE_CUST is available in the LOCAL_OE Database and not available in LOCAL_PROD database.
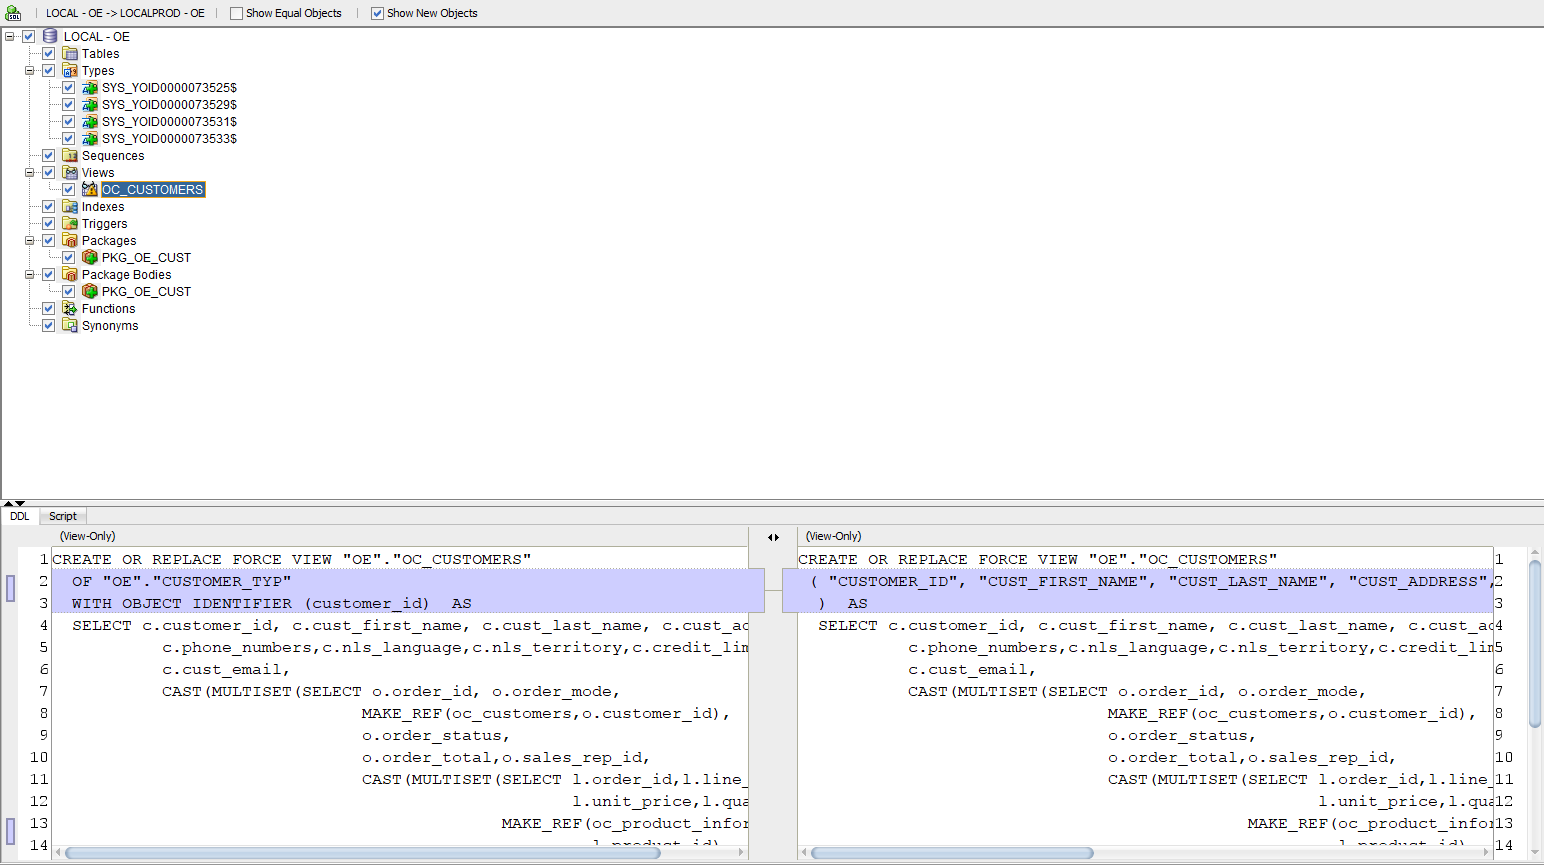
Similarly, a warning sign is used to highlight any difference in the objects between the two schemas. Click the item and view the differences.
This process also can be executed in the background to gain some productivity.
Reports – Tell me about everything
SQL Developer contains standard reports which help to quickly browse through the contents and save time compared to manually running the queries required to get those data. This option is available from View -> Reports. This will open a window listing all the available reports
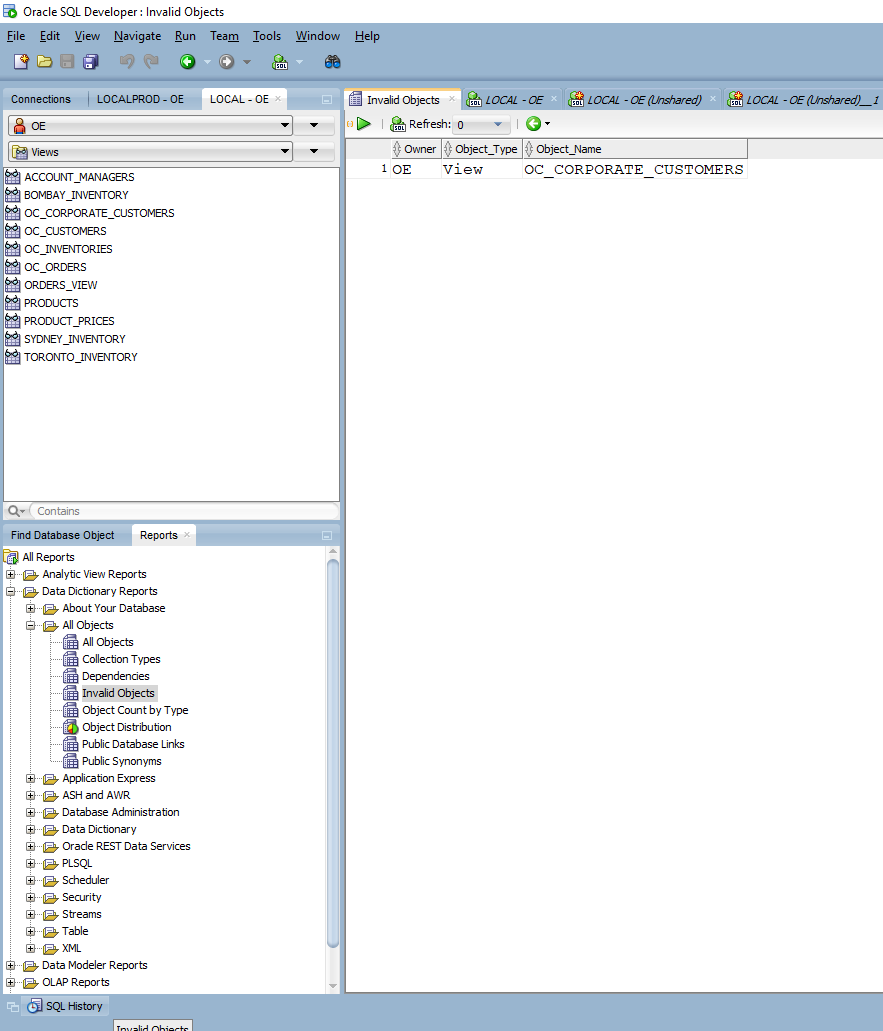
Invalid objects – This report provides a list of all invalid objects and can be run before and after deployments to ensure no new invalid objects are created.
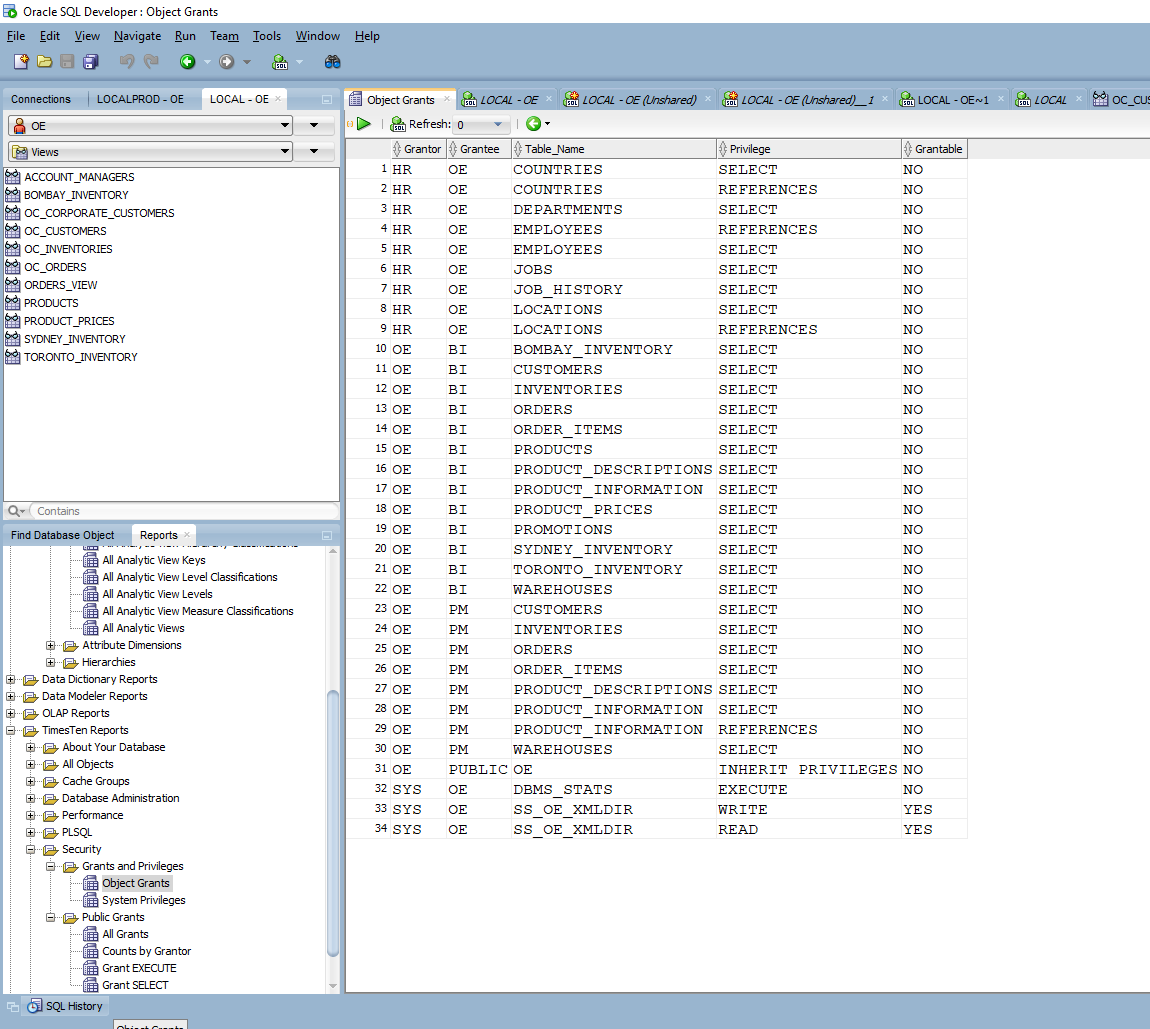
Object Grants report – This provides the overall view of grants assigned to the individual schemas.
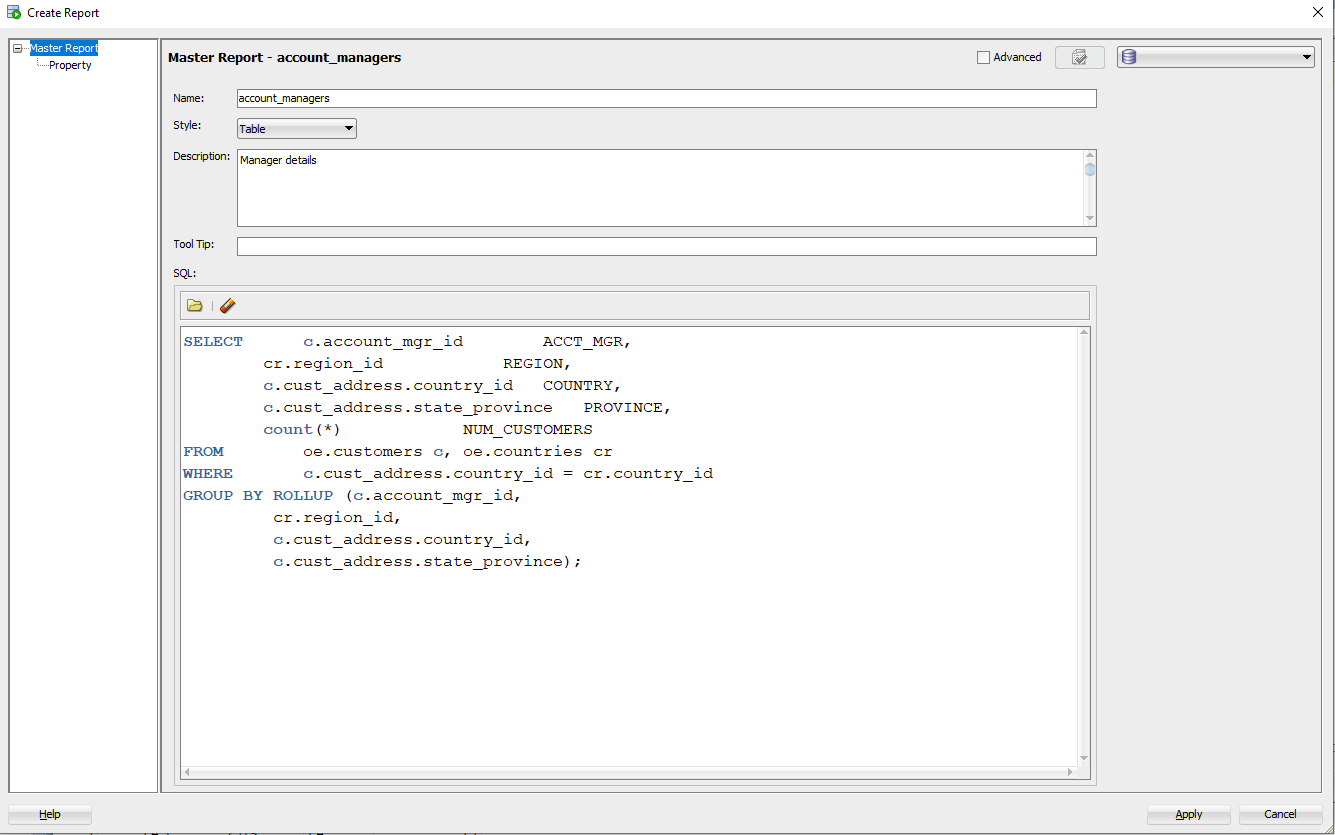
Custom reports are also available in SQL Developer under Reports -> User Defined Reports. By right-clicking on User Defined Report and choosing New report, the below screen opens up. You can save any frequently used report or SQL with a report name.
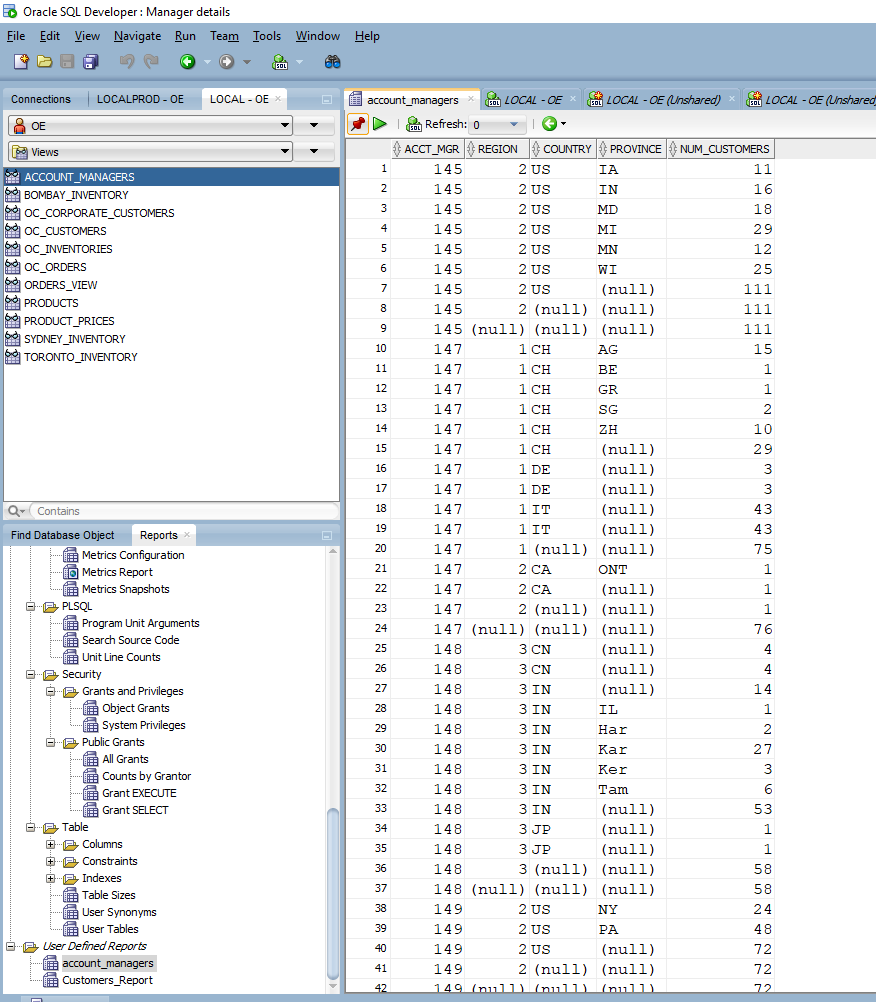
Click on the report name to view the results from the newly created report.
Pinning – Stay where you are
This is a minuscule item but saves many repeated clicks, especially if you are new to SQL Developer. When you open a new object, SQL Developer automatically closes the tab for certain object types. When I open the oe.customers table to view it and then open the oe.oc_inventories table, it closes the oe.customers window. In a way, it helps avoid accumulating a lot of tabs to browse through back and forth. But if you would like to keep the tab open, then it can be pinned.
You can pin the window with the universal icon ![]() , and it is always on the top left corner of the window. Any pinned tabs must be manually closed.
, and it is always on the top left corner of the window. Any pinned tabs must be manually closed.
In PL SQL packages, procedures, functions, and few other object types, the windows are automatically pinned, which means opening another package does not close the existing package.
Format and Explain Plan – Make it legible
After developing a PL SQL object, the code can be formatted using the format option (ctrl + F7) or right-clicking on the SQL worksheet and choosing Format. The settings related to the format can be controlled in the preferences section (Tools -> Preferences -> Code Editor -> Format). The formatter settings can be auto-detected as well.
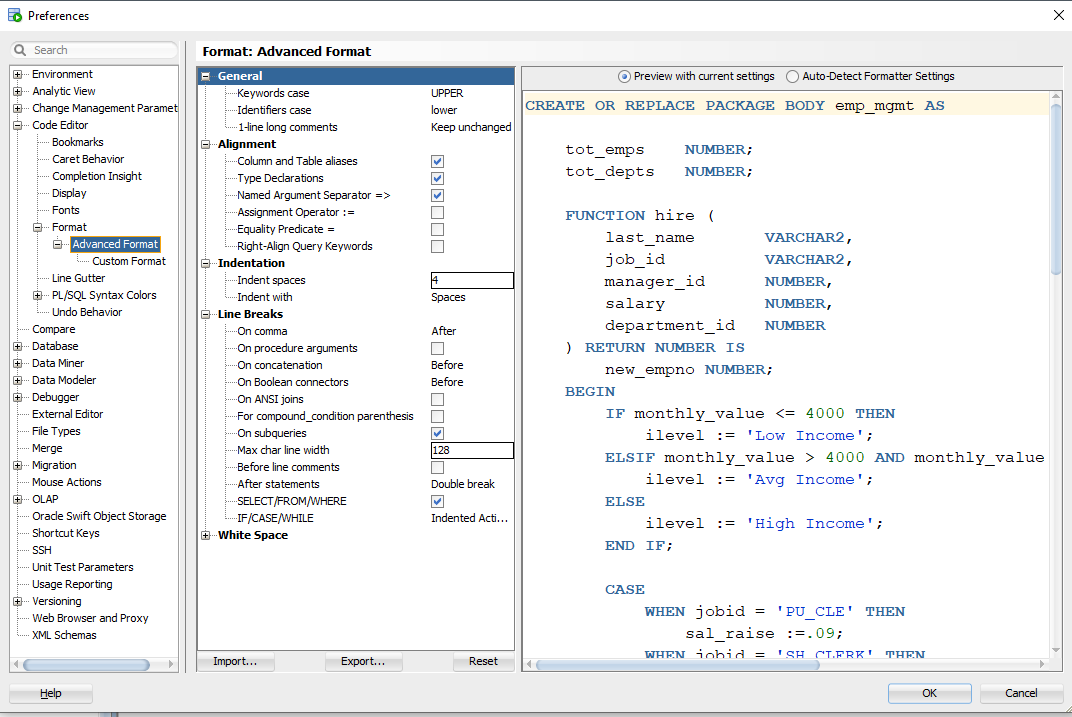
A common standard can be created across the team, which would help maintain the same code format and easier maintenance. Selected pieces of code can also be formatted by highlighting only the required portion and formatting it.
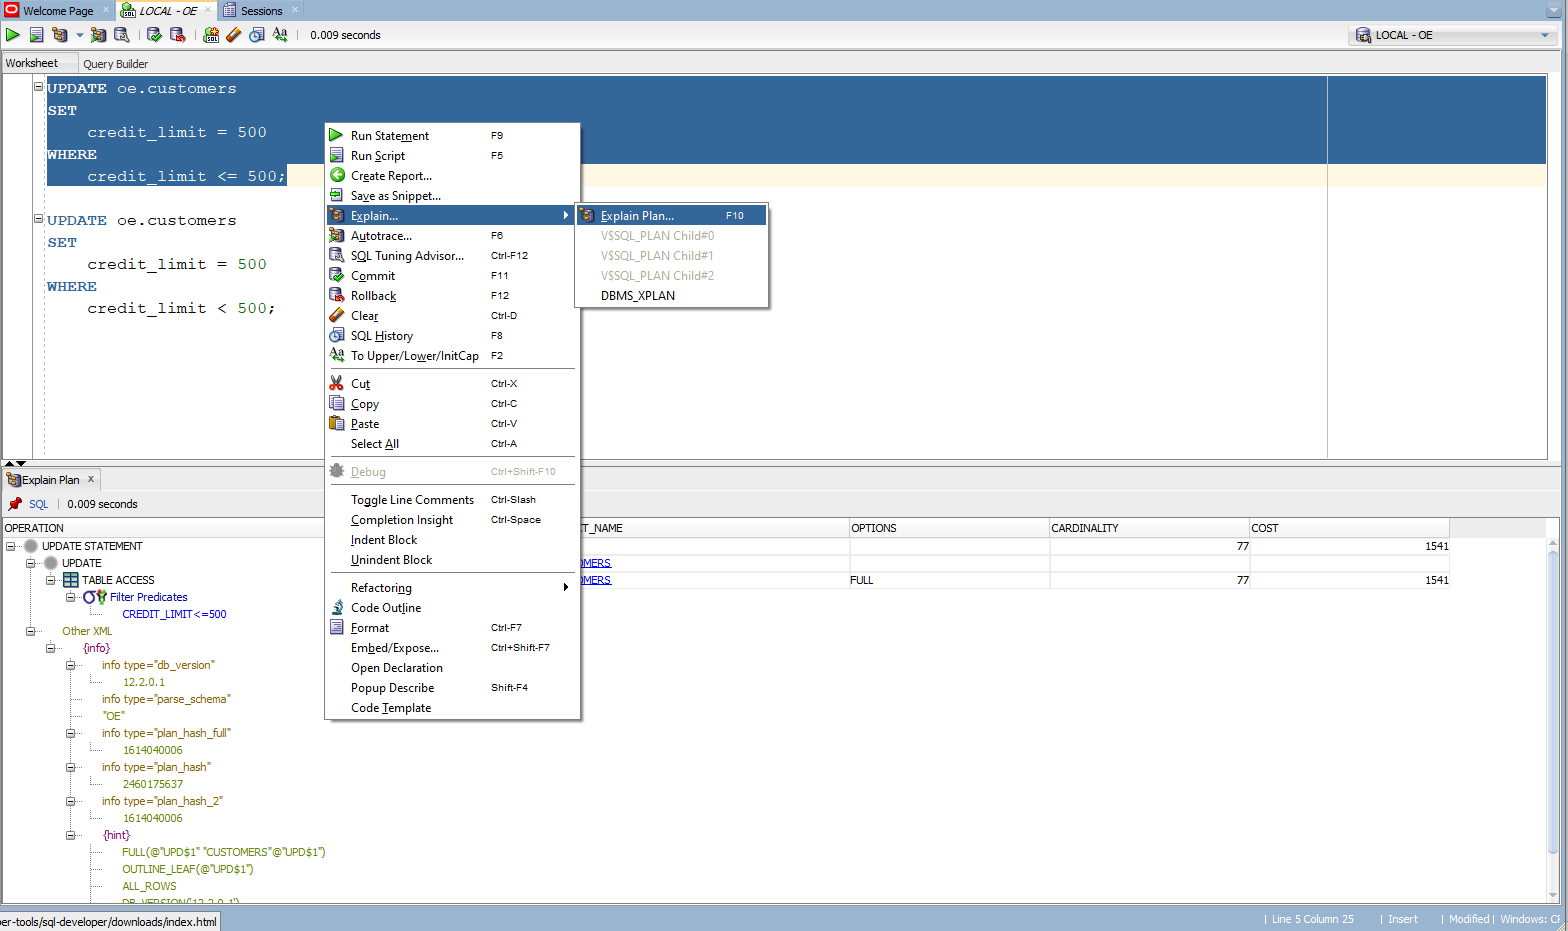
The explain plan option helps evaluate the cost and the sequence of operations performed in the SQL statement. This is available from the SQL worksheet and can be viewed by hitting the F10 key or right-clicking and choosing Explain Plan. The cost and cardinality for the SQL statement are shown.
Two different explain plans can be compared to see the difference in steps. Usually, this is done when tuning queries to look for any improvements. Generate the explain plan for the first statement and remember to pin it.
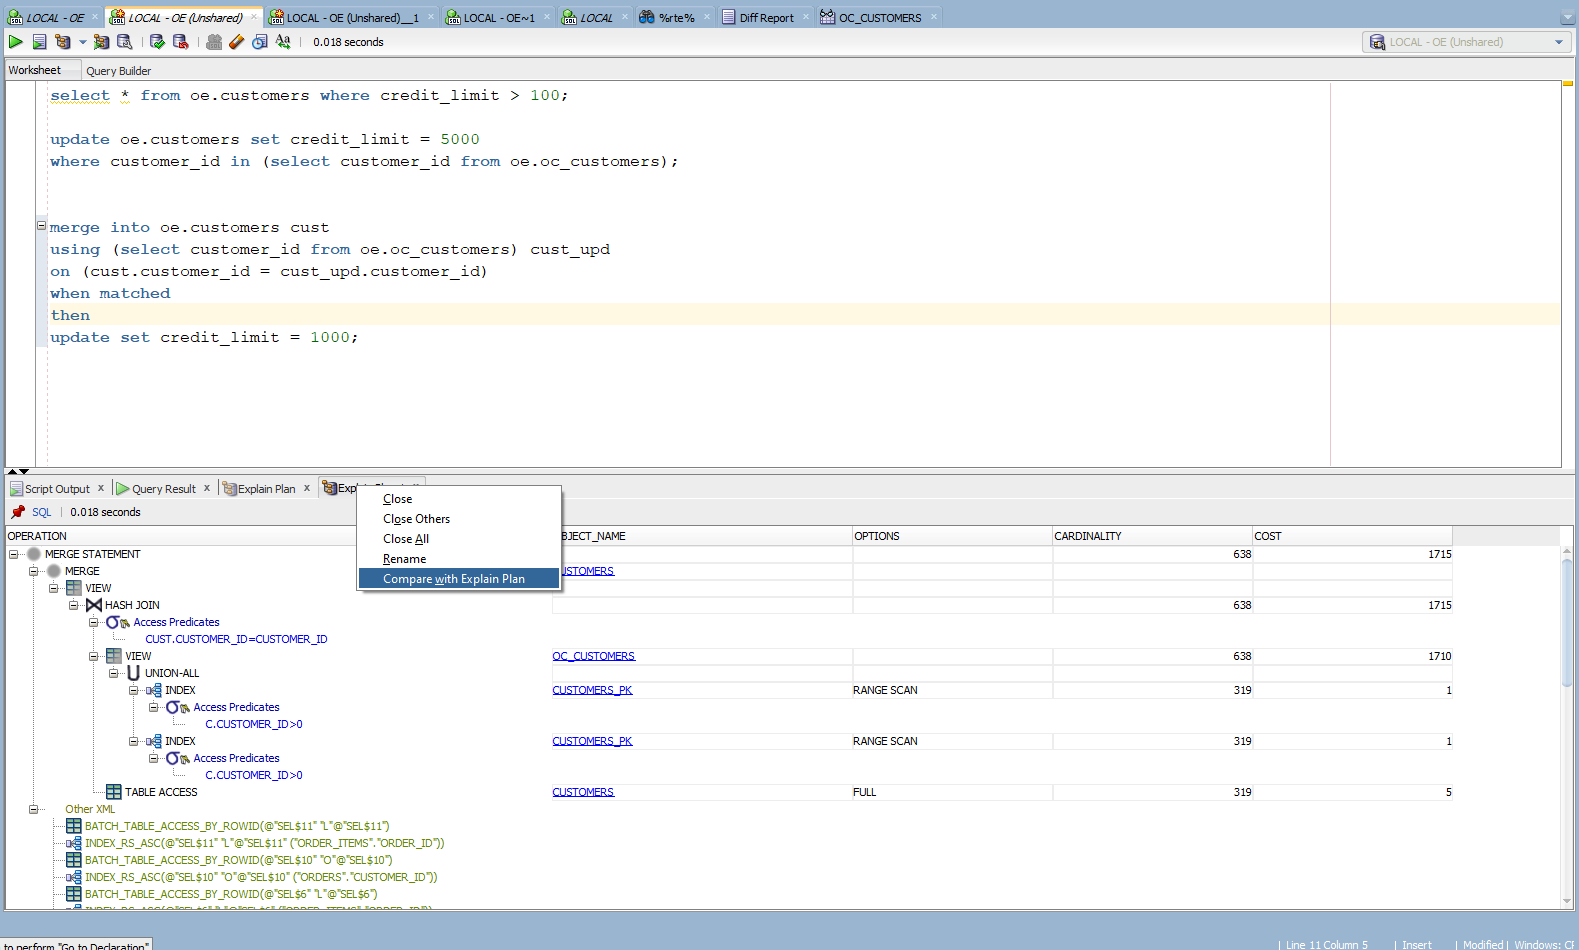
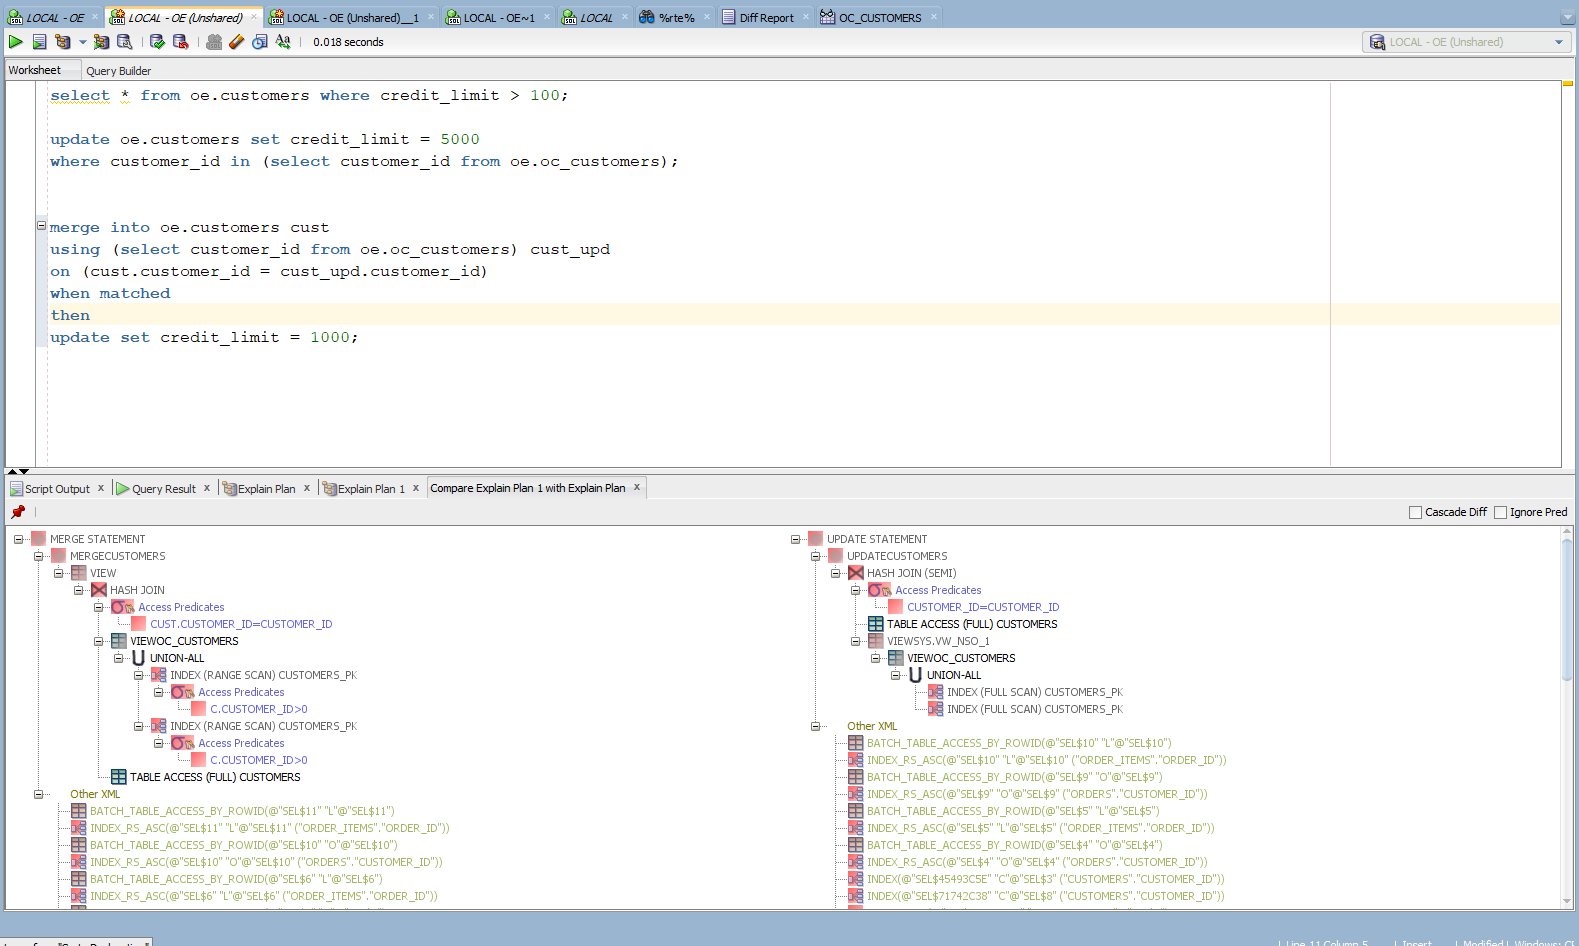
Now, generate for the next statement and right-click on the second explain plan tab to compare with the first one. This helps to compare the plans side by side.
Debugging – A blessing for every developer
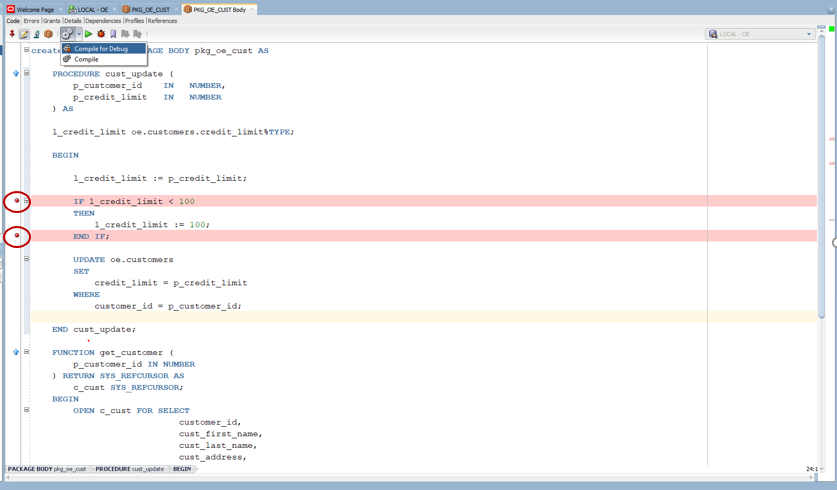
SQL Developer has a debugging feature for the PL SQL programs. A specific procedure, function, or package can be debugged with breakpoints, and the value of the variables can be observed during the execution. To set a breakpoint, click on the desired line of code on its left side and compile it with the debug option.
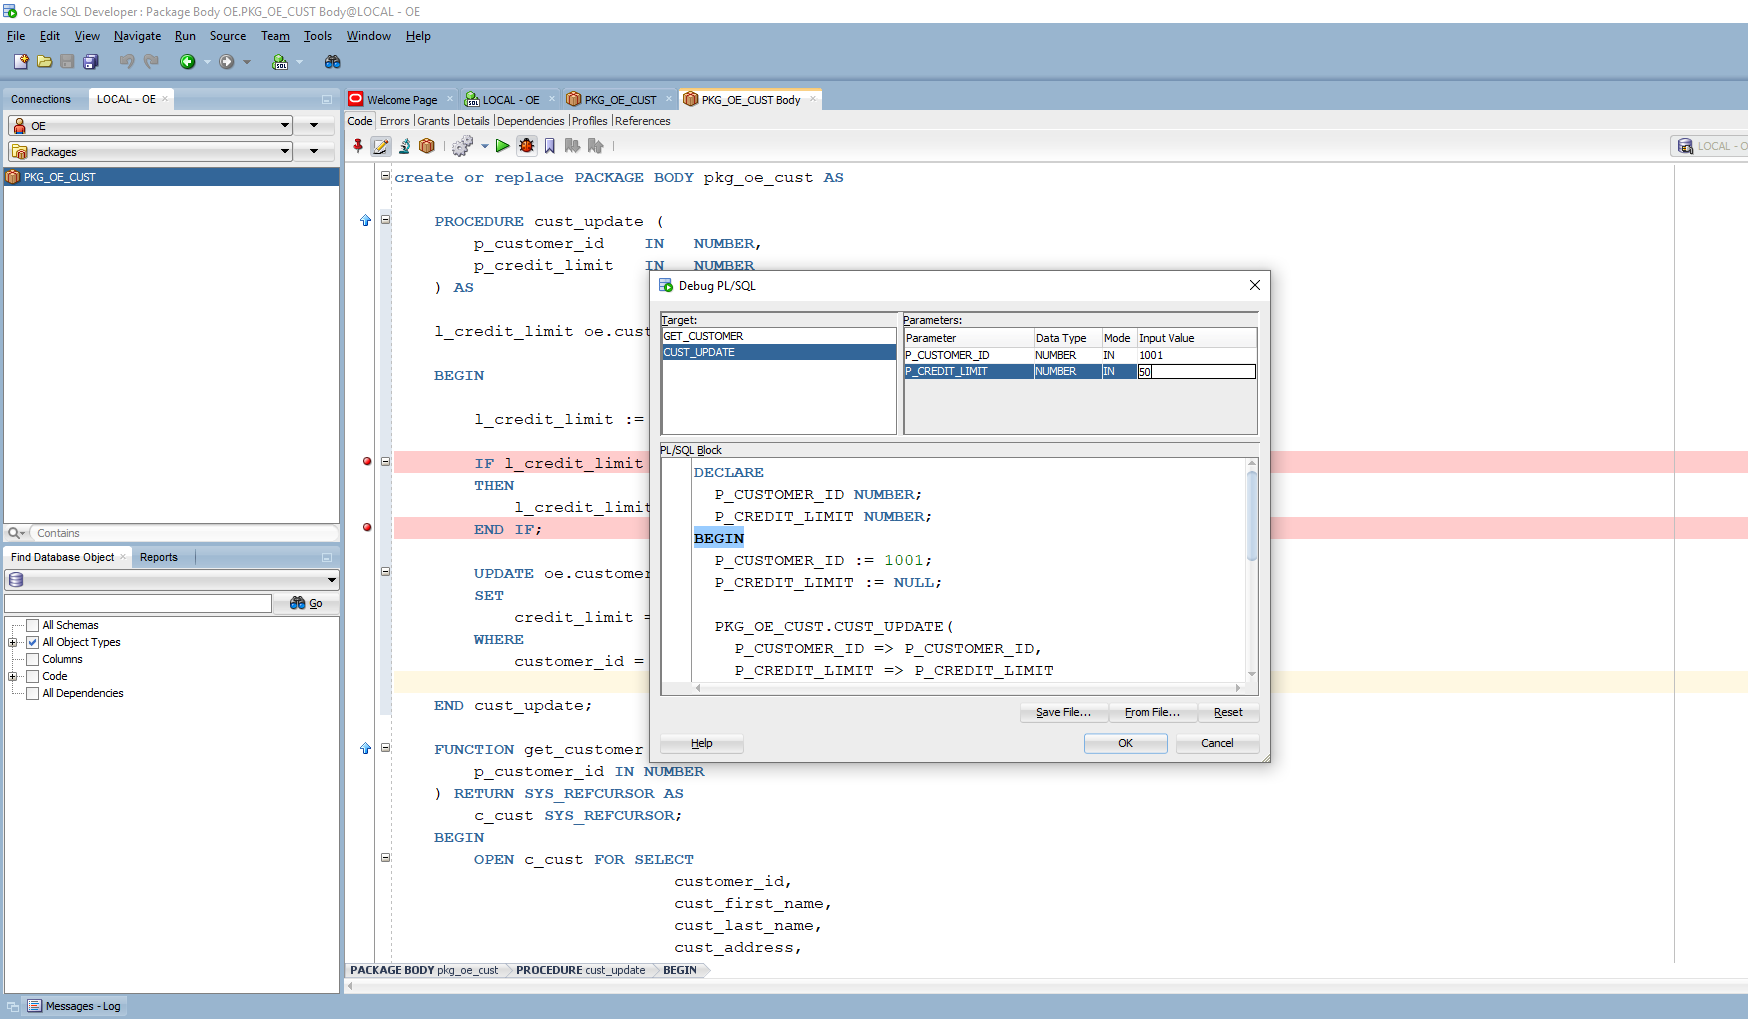
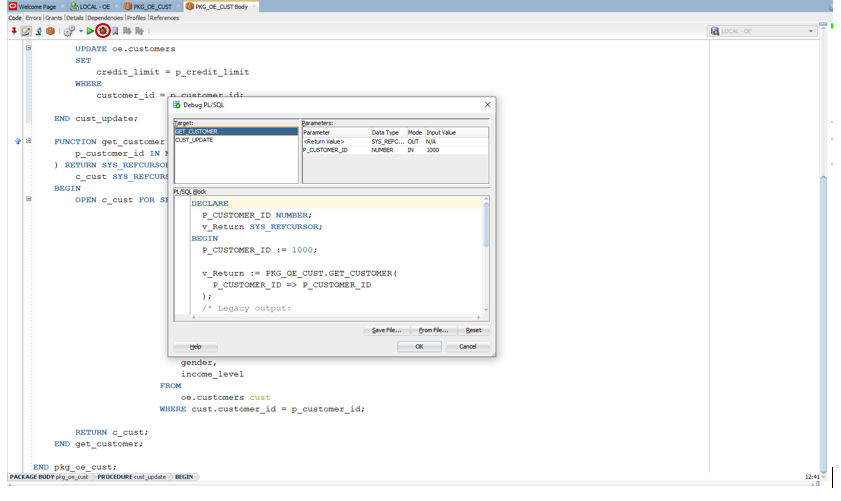
Click the ![]() icon to start the debug process. The input values to be provided during execution can be keyed in the parameters section. The program gets executed after clicking OK. I have provided an input value of 1001 to p_customer_id and 50 to p_credit_limit.
icon to start the debug process. The input values to be provided during execution can be keyed in the parameters section. The program gets executed after clicking OK. I have provided an input value of 1001 to p_customer_id and 50 to p_credit_limit.
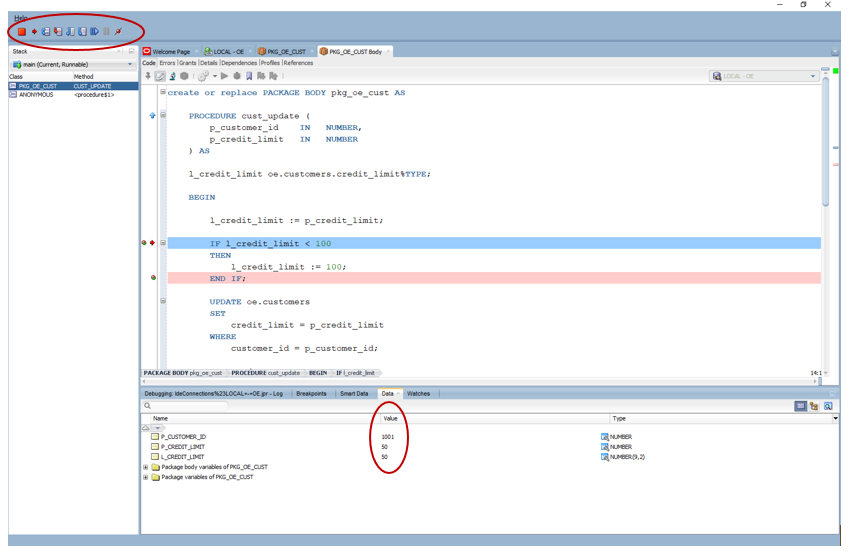
Now, the process has stopped at the breakpoint. Here, a whole range of operations can be performed. Under the Data tab, the values of the variables can be observed as the process gets executed. With the icons on the top, the debugging process can be stopped, resumed, moved into another subprogram, etc.
Under the Data tab, you can observe that l_credit_limit is set to 50 before entering the IF clause.
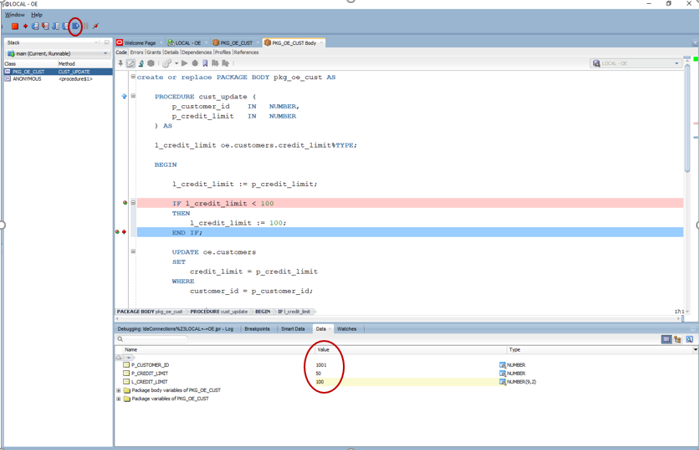
After hitting ![]() or F9 to resume, the process stops at the next breakpoint. Here, you can observe, the l_credit_limit value is updated to 100.
or F9 to resume, the process stops at the next breakpoint. Here, you can observe, the l_credit_limit value is updated to 100.
Hitting ![]() or F9 to resume will complete the execution of the cust_update procedure, as there are no more breakpoints.
or F9 to resume will complete the execution of the cust_update procedure, as there are no more breakpoints.
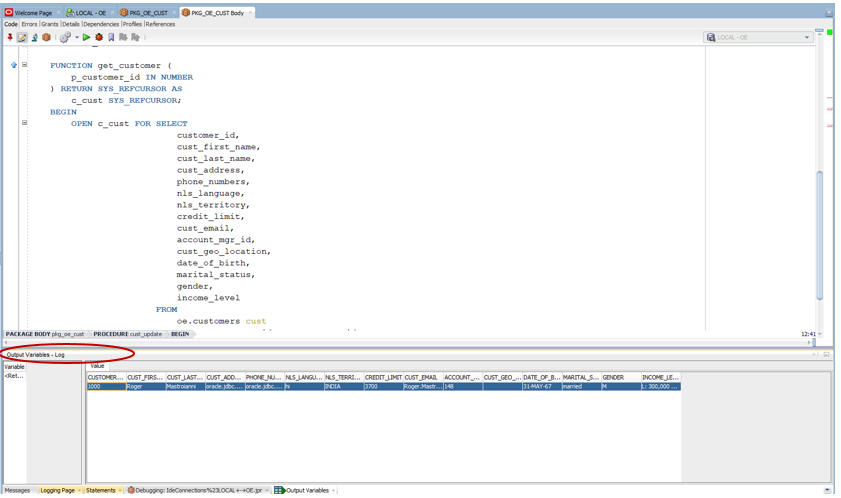
If there are output cursors returned as part of a function, the cursors’ dataset can be viewed as well. The procedure get_customers returns a cursor to view the customer details for an input customer. The process is executed by clicking ![]() , entering 1000 for p_customer_id under the parameters section, and clicking OK.
, entering 1000 for p_customer_id under the parameters section, and clicking OK.
After running the function, the cursor’s output value is shown under the Output Variables – Log section.
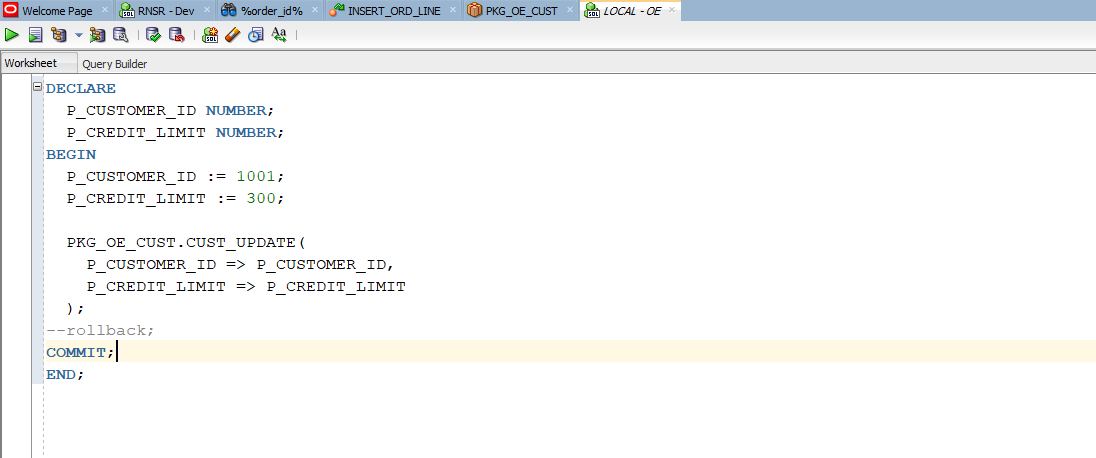
In some instances, the code block to execute the procedure or function can be copied to a SQL worksheet and executed from there. This helps to quickly set up the parameters when running these processes from a worksheet. The p_customer_id is set to 1001 and p_credit_limit to 300. This process can be executed several times for different values directly from this SQL worksheet by clicking ![]() on the top left.
on the top left.
Sessions monitor – What’s going on
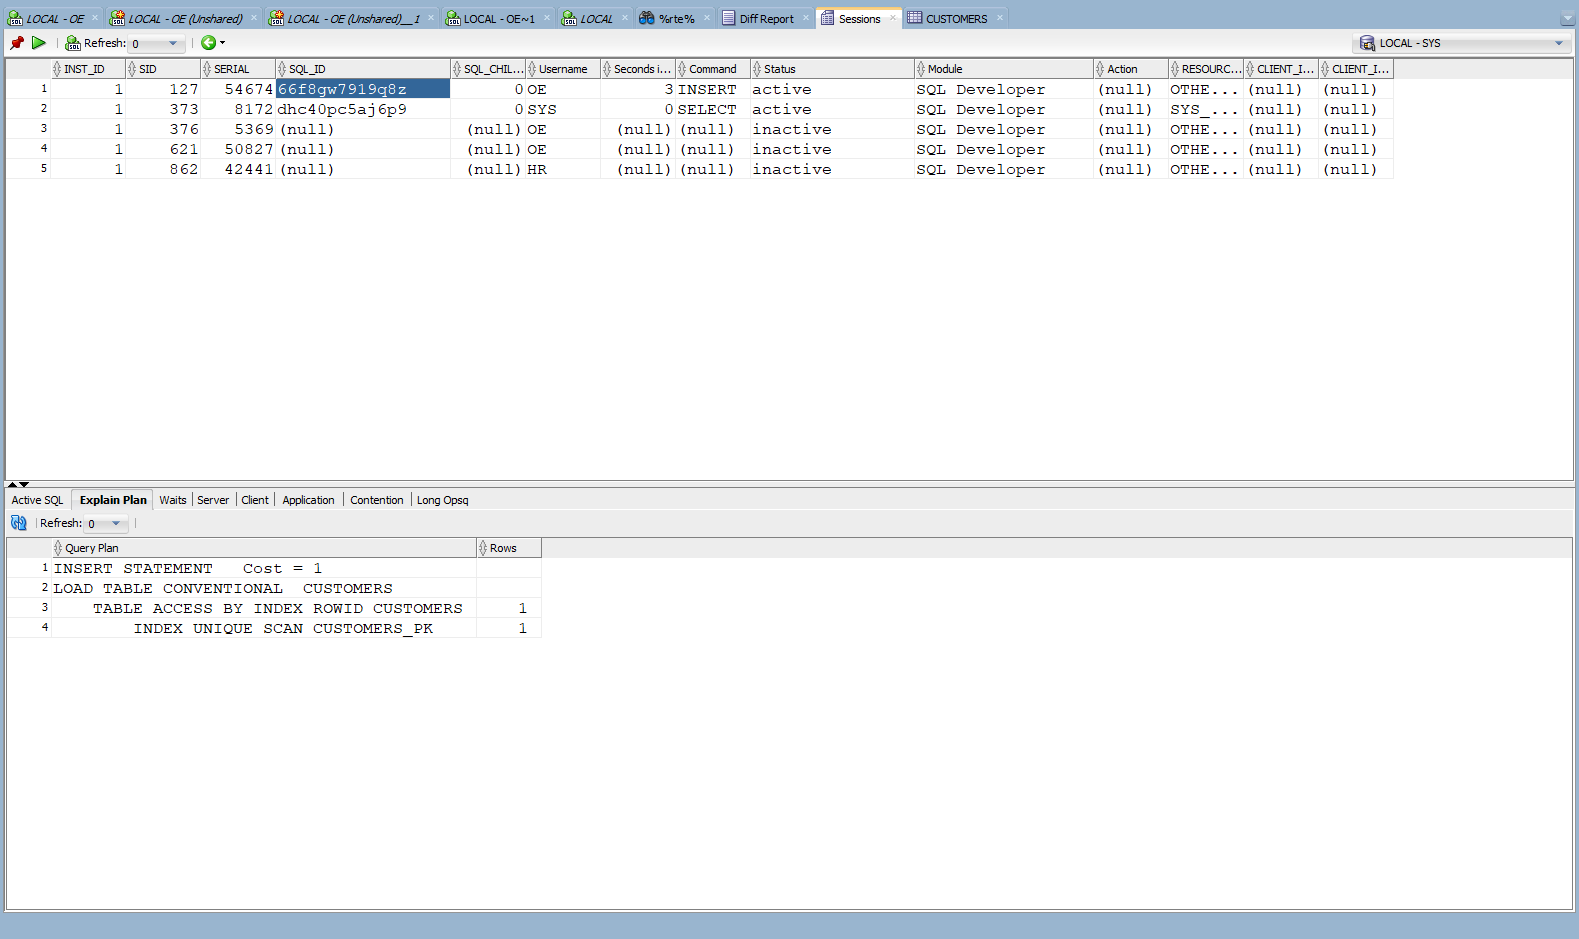
The sessions monitor screen identifies the active sessions currently executed in the database with details like SQL Id, SID, execution time, OS user, client identifier, and many others. It can be opened up from Tools -> Monitor Sessions. If you have any long-running processes, those can be identified here and you can monitor the batch processes.
There is a refresh timer at the top, which can be set for an automatic refresh of the screen. Filters can be applied at the top of each column to look for sessions only under a particular schema, specific OS user, or only active sessions.
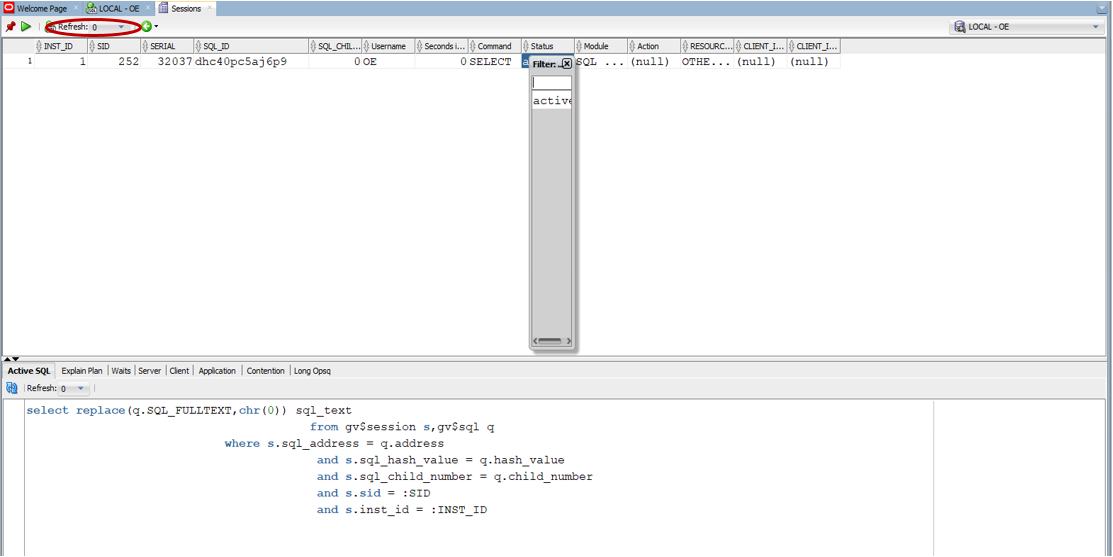
It would be hard to capture any process which takes less than a few seconds here, and a better approach would always be creating debug logs for such processes. In the case of SQL statements with bind variables, this does not show the bind values; rather only displays them as bind variables.
The wait tab at the bottom shows any session waits caused due to object locks or resource availability. The Active SQL tab displays the exact statement currently executed by the process, and the Explain Plan tab shows the cost associated with the statement and execution plan.
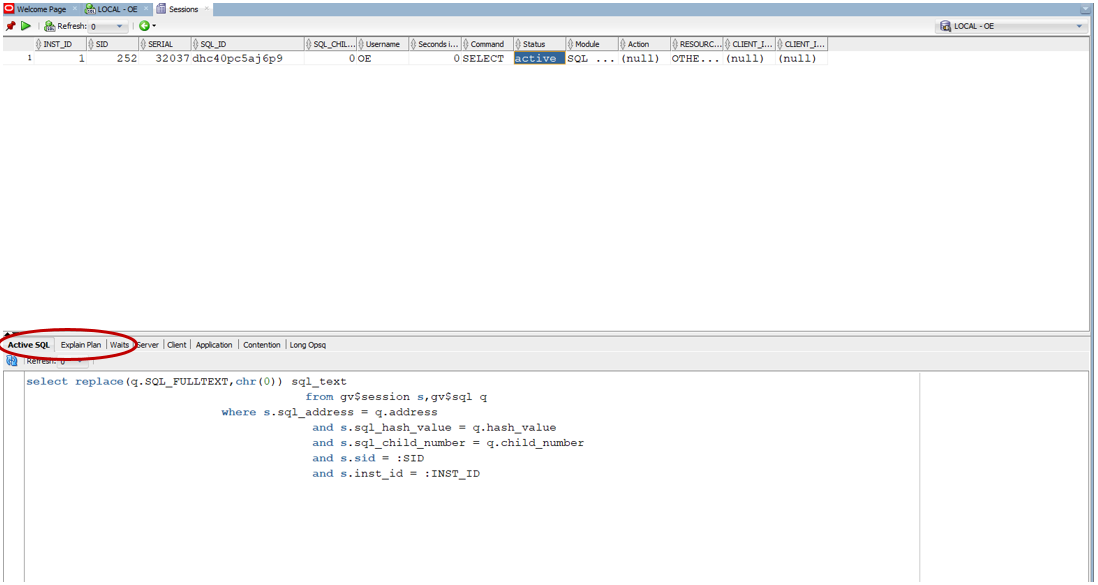
These features help to quickly get a grasp of the current processes executed in the database.
Database Design diagram – A must-have artifact
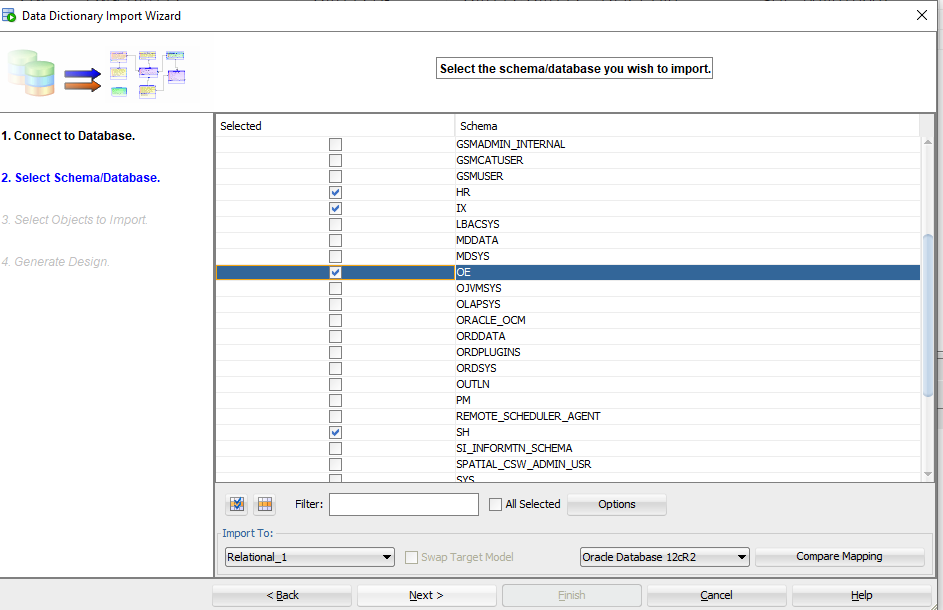
A data model diagram of the database assists in understanding the relationships between the objects. The option is available under File -> Data Modeler -> Import -> Data Dictionary. After choosing the connection to log in, the list of schemas can be selected.
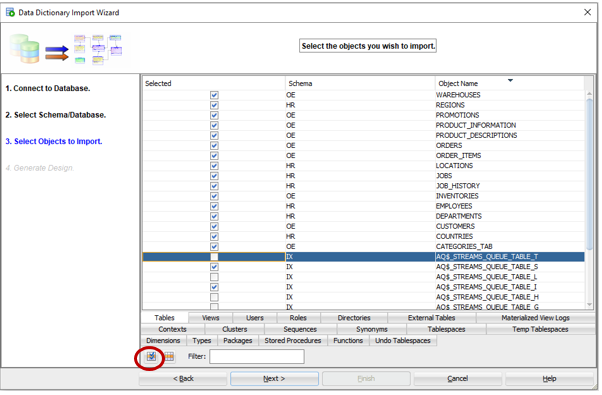
Following that would be a screen to select tables, views, and any other objects. After choosing those, hit finish. To select all the tables, use the check all icon at the bottom left.
The data model diagram showing the relationships between the objects and keys, indices, and many other details is provided. These details are entirely customizable, and the diagram can be saved as a PDF or Image file by right-clicking and choosing Print Diagram -> To image file / To PDF file.
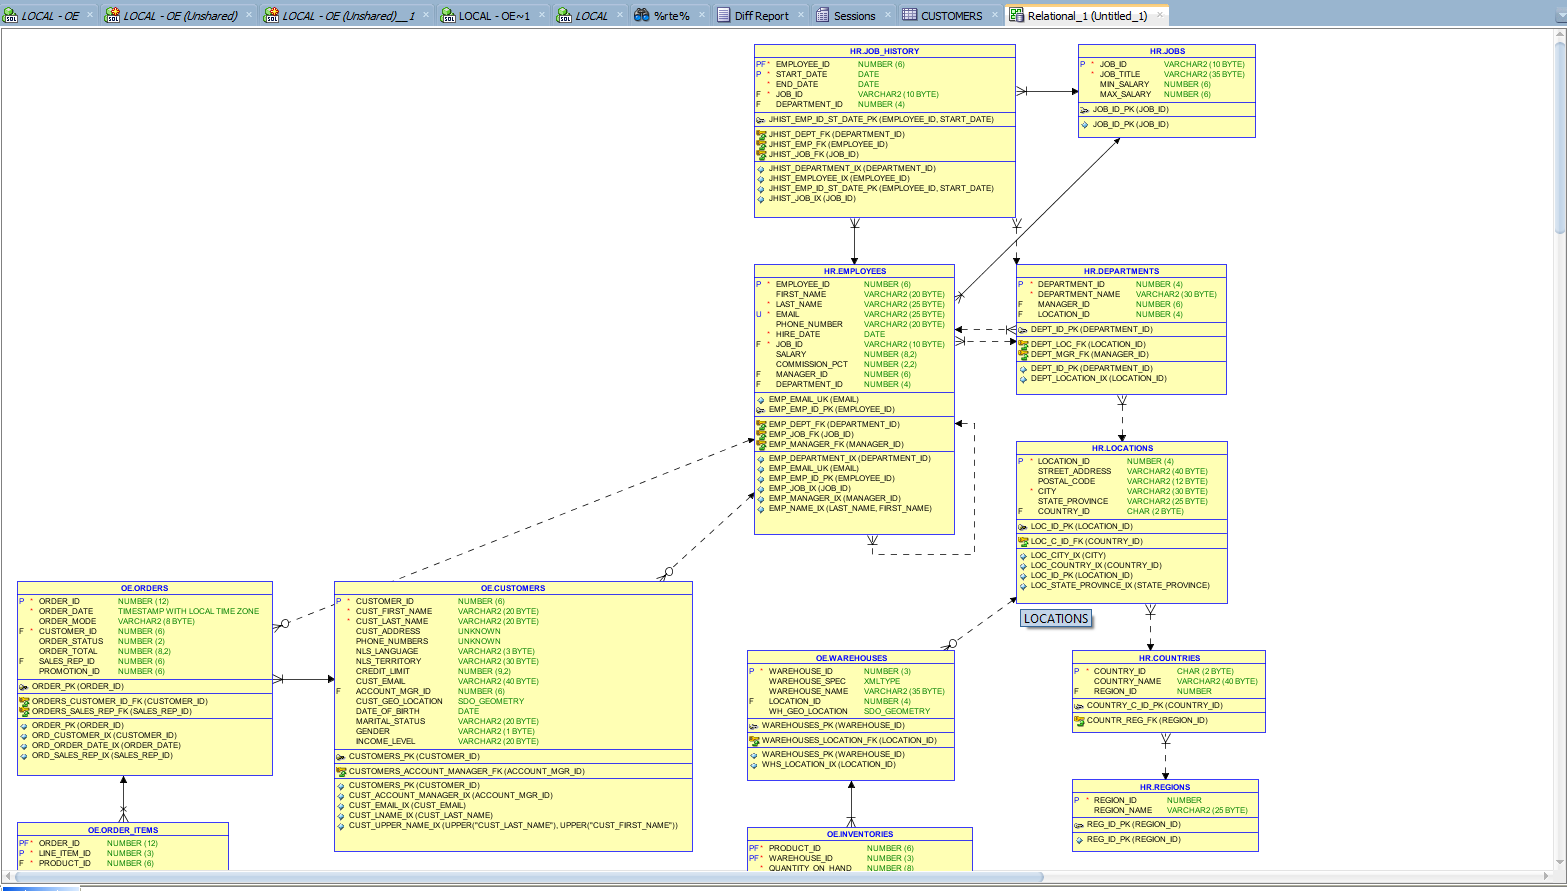
This is one of the essential artifacts maintained for the database, and it also helps to perform the impact analysis at a high level.
Get the most from SQL Developer
Just like any other tool, you get used to this and discovery new functionality as you start working in it. The tool is easy to set it up and does not require the Oracle client to be installed. There are a lot more features and utilities available in this tool apart from the items discussed here. Give SQL Developer a try and improve your skills.
Use the links below to download the SQL Developer and the documentation to explore further.
https://www.oracle.com/tools/downloads/sqldev-downloads.html
https://docs.oracle.com/en/database/oracle/sql-developer/20.2/books.html
Load comments