In the Happy Database movies, SQL Server is benign and friendly, with no scary surprises lurking around the next corner. In these movies:
- People work together
- No-one but the DBA can make changes to production
- People tell us in advance when they want to change something
- When query performance degrades, we’re notified about it
- Third Party vendors only deploy good changes
- Deployment scripts always work perfectly
Back in the real world of SQL Server, not all of these are true all of the time and the result is that we spend long weekends slaving over fixes for things that should never have been broken in the first place, or that we should have known about before they became a big problem.
In this article, I uncover six common but scary surprises that often lurk behind the innocent-looking green “Play” signal in SQL Server’s Object Explorer. I’ll also discuss how, with the right tools, you can uncover some of these potential threats, and make sure that the second that another rears its head, you know about it. At the end, I provide a Further Reading list, where you can find deeper details on each of the specific “monsters”, should you suspect that one of them has infested your SQL Servers.
And remember, often the call is coming from inside the house…
The monster that messes with your indexes
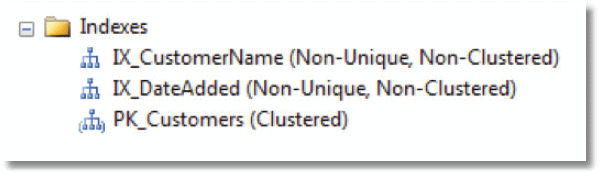
Let’s say we have a simple Customers table with two non-clustered indexes one on CustomerName and one on DateAdded. We’ve even gone so far as to ensure that the indexes are on the right fields; note that IX_CustomerName really is on the CustomerName field!
|
1 2 3 4 5 6 7 8 9 10 11 12 13 14 15 |
CREATE TABLE dbo.Customers ( Customerld INT IDENTITY NOT NULL, CustomerName VARCHAR(50) NOT NULL, DateAdded DATETIME NOT NULL, CONSTRAINT PK_Customers PRIMARY KEY(Customerld) ); GO CREATE INDEX IX_CustomerName ON dbo.Customers(CustomerName); CREATE INDEX IX_DateAdded ON dbo.Customers(DateAdded); INSERT INTO dbo.Customers (CustomerName, DateAdded) SELECT 'Brent Ozar', GetDate() UNION ALL SELECT 'Jeremiah Peschka', GetDate(); |
All is well until one morning users report a dramatic slowdown in queries against the Customers table.
You drill into SSMS and all looks well in terms of the indexes that are in place.
You fire off a quick query and examine the execution plan.
|
1 2 3 |
SELECT CustomerName FROM dbo.Customers WHERE CustomerName = 'Brent Ozar'; |
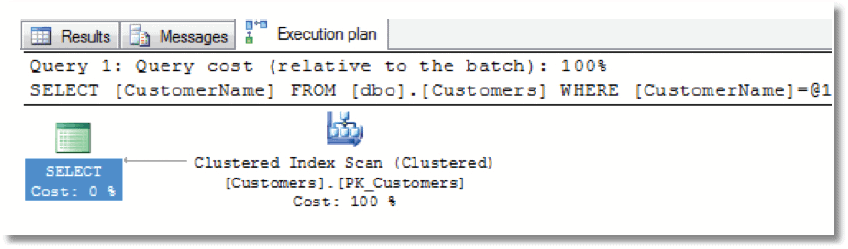
Immediately, you see a problem; the query is “ignoring” the IX_CustomerName index, and you’re seeing a clustered index scan. You investigate further via the sys.indexes catalog view.
|
1 2 3 4 5 6 7 |
SELECT name, index_id, type, type_desc, is_disabled FROM sys.indexes WHERE object_id = Object_Id('dbo.Customers'); |
Someone or something has disabled both of our non-clustered indexes. In such cases, the index schema remains in place and, as we saw, SSMS gives no visual indication that anything is amiss, but the optimizer will ignore these indexes. Once an index is disabled, SQL Server stops tracking its usage, as inserts, updates and deletes will no longer hit that index.
If we’re bulk-loading data and need to do it quickly, it will sometimes vastly improve the performance of the data load if we first disable the non-clustered indexes, as otherwise SQL Server will have to modify the index for every row inserted. It is often more convenient to just disable indexes, rather than drop them, as it leaves the schema intact and you can just re-enable it afterwards rather than recreating from scratch. Once the load is complete, we re-enable the indexes, by rebuilding them.
|
1 2 3 4 5 6 7 |
/*Disable*/ ALTER INDEX IX_CustomerName ON TestDB.dbo.Customers DISABLE ALTER INDEX IX_DateAdded ON TestDB.dbo.Customers DISABLE --bulk load data /*Enable*/ ALTER INDEX IX_CustomerName ON TestDB.dbo.Customers REBUILD ALTER INDEX IX_DateAdded ON TestDB.dbo.Customers REBUILD |
However, for various reasons, the indexes sometimes don’t get re-enabled. Typical causes include:
- An ETL process disables indexes to do a nightly load but then someone breaks this nightly process so that it doesn’t re-enable them
- A deployment script disables non-clustered indexes in order to alter the clustered index, but then fails before it re-enables them.
In order to prevent such incidents affecting our end users, we need to monitor regularly for any disabled indexes in our databases and then investigate the cause. We may even want to receive an alert as soon as any process disables an index.
My sp_Blitz script (http://www.brentozar.com/blitz/) will, among many other things, check for disabled indexes in each of your databases. In order to find out as soon as anyone disables an index in one of your databases, there are a couple of options. One is to write DDL Triggers to track all changes to the database schema and log them to a table, or set up email notification.
SSMS Standard Reports
If you right-click on any database in SSMS and choose Reports | Standard Reports, you can access a history of schema changes, as reported by the default trace. However, in my experience, it’s not always reliable when reporting on large database migrations where hundreds of changes go through very quickly and there is no built-in alerting.
Another option is to use your SQL Server monitoring tool to track any increases in the number of disabled indexes for each database. For example, with Red Gate SQL Monitor, we can define a custom metric as follows:
|
1 2 3 |
SELECT COUNT(*) AS cnt FROM sys.indexes WHERE is_disabled = 1 |
We then simply set an alert for any increases in the count.
SOL Monitor and Custom Metrics
SQL Monitor allows you to create and alert on custom metrics. You can share these metrics at sqlmonitormetrics.red-gate.com so others can download and adapt them as necessary. You can search for metrics such as index metrics and you’ll find many other useful metrics such as tables with no clustered index defined.
The cannibal that eats all your memory
I offer you the World’s Simplest SOL Server diagram:
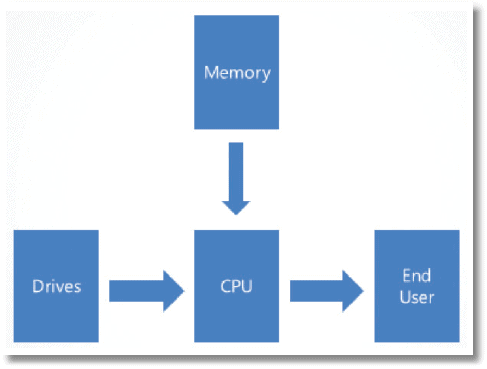
End users ask SQL Server for data. SQL Server runs on CPU and it gets that data from memory or gets it from hard drive. Let’s say we have 64 GB of memory and a 100 GB table and, in response to a user query, SQL Server needs to scan the table from start from finish. The speed of this scan boils down to how fast SQL Server can get 36 GB of data off the hard drives (of course, in reality, we’re not using all 64GB of our memory to cache that table; SQL Server and Windows need memory for all kinds of purposes.)
If a brisk walk at 5 mph is equivalent to getting data off disk, then getting data out of memory is walking at the speed at light. Suffice to say that, in an ideal world, SQL Server would store in memory all of the data requested by our end users. As such, it makes sense to:
- Get as much memory as you can afford – 256 GB for a typical server is under $4,000 – less than one core of SQL Server Enterprise Edition
- Make sure as much of that memory as possible is available to the SQL Server process (sqlservr.exe) – don’t install other SQL Server processes such as SSIS, SSAS, SSRS if you don’t intend to use them
- Make sure SQL Server can use as much of that available memory as possible for its buffer cache – i.e. to cache data pages.
Unfortunately, there is a cannibal, which will eat all of your available memory, if you let it.
Consider a typical server with 64 GB of RAM, running 64-bit SQL Server. Firstly, we’d want to leave a reasonable amount of memory available to the operating system, and for SQL Server’s non-buffer pool memory allocations. A rule-of-thumb is to set max server memory such that we leave at least 10% of available memory free for the OS, or 4 GB, whichever is greater. However, after that, we’d want to have as much of that memory as possible – up to about 58 GB -available for the buffer pool.
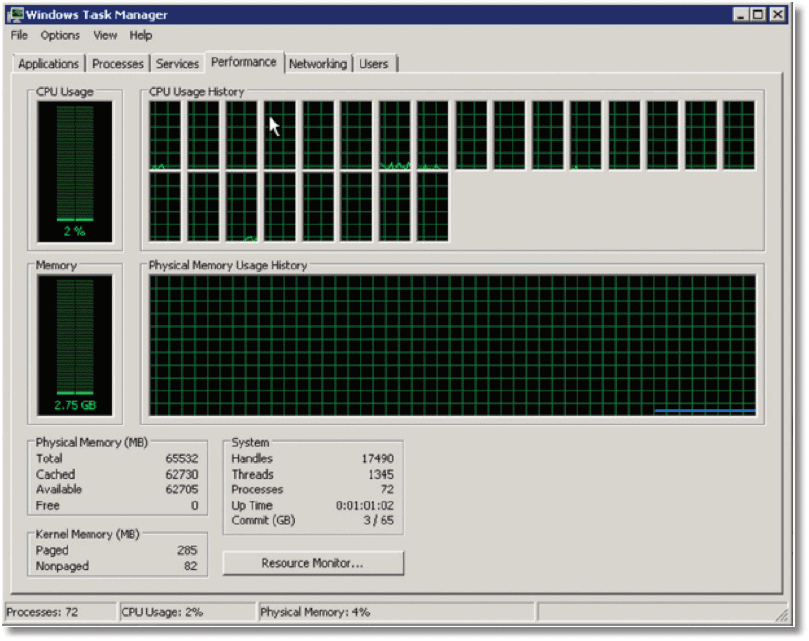
The following is a “typical” screenshot from Windows 2008 Task Manager for this server.
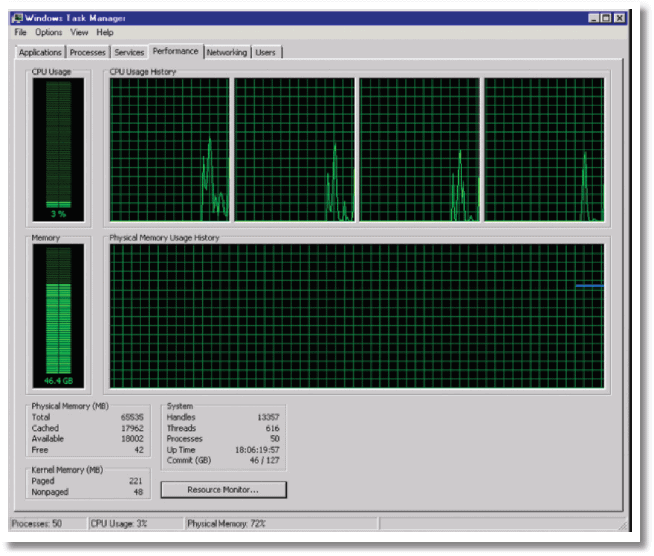
As you can see, approximately 46 GB is in use and most of this will be the SOL Server buffer cache. As DBAs, we are used to monitoring available memory and the “Physical Memory (MB)” entry indicates that 18 GB of physical memory is “available”.
What, however, is this “Free” memory value of only 42 MB? It turns out that not all of that memory listed as available is actually available to SQL Server (it’s only available to the OS). As you can see from the “Cached” value, the Windows OS is using the vast majority of the “available” 18 GB, and most of this is likely to be for the system file cache.
How did the cache get so large? The answer is that every time we remote desktop into the server and copy files; for example we drag and drop a backup or trace file, download a service pack and copy it from one location to another, Windows will helpfully cache that file in memory.
This was not a big problem in 32-bit days, when the SQL Server process had access to only 4 GB of Virtual Address Space. However, 64-bit processes have access to effectively “unlimited” amounts of memory and here it can become a big problem. In effect, it means there is no cap on the size of the file system cache. If you do a lot of file copying, you could find a significant proportion of your installed memory used by the OS.
Eventually, Windows will release this cached memory but it can take a while, and we can force it to release it by rebooting the server. It seems a sad irony; Windows used to suck so badly that we’d need to reboot our servers regularly. Now it’s much better, but we’re starting to see people reboot more frequently again, in order to fix this problem!
Releasing file cache memory without rebooting
Mark Russinovich has made available from his sysinternals website an undocumented utility called CacheSet to resolve this problem without rebooting. However, you need to leave it running as a service in order to stop this problem and many people will be unwilling to run an undocumented tool on production.
This issue of bloating the file cache can cause a particularly nasty surprise in cases where we have an active/passive cluster, with one node sitting passive, and this is the node onto which we remote desktop. We think we’re not doing any harm as it is not doing any work. However, what we’re doing each time is ramping the cached memory usage up and up until it eats up all available physical memory on that node.
What you would hear upon attempting to failover to this node, if servers could transmit their feelings, is the sound of a sad trombone. SQL Server is only going to have a few MB of memory to play with, because we never reboot our passive node.
Of course, there are ways to mitigate the problem (tools such as xcopy, for example, do un-buffered file copy) but the underlying message is clear:
- Preserve your memory – we need SQL Server to cache as much data as possible
- Don’t run BIDS/SSMS from the SQL Server
- Don’t remote desktop into SQL Servers and copy files (note: backups to remote shares isn’t copying files)
- Even better, never remote desktop onto the server at all – remote desktop into a different server and pull files off
No single metric will help us catch this particular cannibal. We should set SQL Server’s max server memory (as well as min server memory) to appropriate values. In the former case, we’d like to set it as high as we can, while leaving 10%, or 4 GB, whichever is greater, free for the OS to ensure it has sufficient memory for its needs.
We need to monitor for potential memory issues. There is nowhere near enough space in this article to offer full details on this topic (see the Further Reading list for some useful links), but we need to monitor wait stats. For example, if we constantly see high waits on PAGEIOLATCH*, then we need to investigate the possibility that that SQL Server needs more memory than it has. Of course, adding more memory may not be the best fix; we may just need to improve our index design, for example, but we’ll at least know that we have a problem.
We can also monitor the Total Server Memory (KB) and Target Server Memory (KB) counters, the former indicating how much memory SQL Server is currently using in the buffer pool and the latter is, loosely speaking, how much it would “like” to use. If you’ve set max server memory then this will be the value of target server memory (if not, it’s based on SQL Server’s calculations). If you’re experiencing memory issues and total server memory is much lower than the target, then you’ll want to see if our “cannibal” has struck.
The Solid State Drive that turns into a Zombie
If getting data off traditional disk is akin to walking at 5mph, and out of memory is walking at the speed of light, then what is the relative speed of getting data off Solid State Disk (SSD)?
Well, it depends on a number of factors, including the type of SSD, the manufacturer and their configuration. They offer blazing fast read and write performance compared to traditional magnetic drives, especially for random reads and writes. If a system is experiencing 10 bottlenecks due to, for example, TempDB contention, it’s possible to move the TempDB files onto solid state storage and see, initially at least, a massive boost in performance. Unfortunately, what many people find is that they start using, for example, Fusion IO drives, see the nice performance boost, wait 6 months, and to their dismay suddenly notice that performance is back down at the old “magnetic drive” level.
To borrow Barney’s analogy from “How I met your Mother”, if your SSD is this hot, it is allowed to be this crazy…

.and it needs a lot of care and attention.
A common mistake, even though the documentation for the various SSDs describes the requirements, is under-provisioning of memory. Fusion IO drives can require a huge amount of memory, based on sector size and drive size. Depending on the drive types and quantities (especially with multiple mirrored pairs), it may be necessary to leave up to 50 – 80 GB memory free just for the drives. Of course, we generally buy them in pairs for RAID arrays, so it’s a lot of memory we need to provision, just for the SSDs.
The other common problem is that some SSDs slow down as they fill up or do repeated writes. Again, we can’t go into the details here (see the Further Reading section for some good resources) but, in short, for a traditional disk drive, overwriting a block that contains “deleted” data performs about the same as writing to on empty block. In an SSD, there is a big difference; the former is a lot slower. Therefore, as the SSD fills up, and the probability of need to overwrite grows, the performance degrades. The TRIM command was introduced to ensure that deleting data actually also removes it from the drive instead of just deleting the pointer but, unfortunately, when the drives form part of a RAID array, the RAID controller does not pass that command to the drives.
The fix for this, which the various manuals explain well enough, is to do what we call the “pull and shuffle”. Say you have four SSDs in a RAID array. Periodically, we need to pull one drive out, put it into Windows machine that doesn’t have any RAID, erase it, put it back in array, wait for it to finish recovering then pull the next drive.
The key to ensuring your SSDs don’t turn into zombies is simply to monitor drive latency via the relevant performance counters. For each disk volume, monitor:
- Physical Disk Avg Sec/write
- Physical Disk Avg Sec/read
Tools such as SQL Monitor will show the average values for these counters, over time, for a given disk volume.
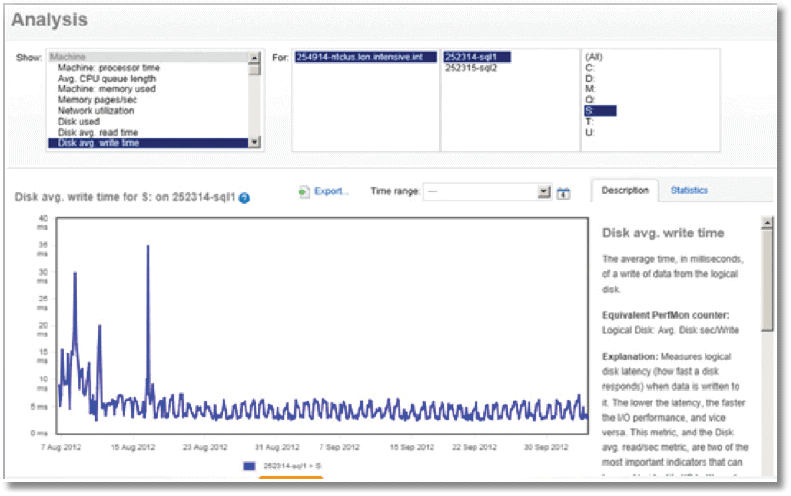
It’s also possible to see the values for individual files (see brentozar.com/go/slow). New SSDs are usually in the 1 ms range for TempDB write, and should certainly be well under 20 ms. However, over the course of say, a month, you’re likely to see the values bubbling up and up. Once the latency drifts up to 20 ms or above, you need to do the “pull and shuffle”.
When TempDB Starts dragging a Leg
The TempDB database is available to all users of a SQL Server instance to house temporary objects such as cursors and tables, and it is where SQL Server creates various internal objects for sorting and spooling operations, as well as index modifications. It can get busy in there, especially if there are unruly processes. Of course, as developers and DBAs we must do all we can to mitigate potential problems by shying away from complex and unwieldy routines that overuse TempDB. However, we must also look out for configuration problems that can cause TempDB to start “dragging a leg”.
Common causes of TempDB problems, in terms of configuration, include:
- Only one TempDB data file
- Too many TempDB data files (like one per core on an 80-core system)
- Multiple TempDB data files, but with uneven sizes or uneven auto-growths
In order to understand why TempDB contention issues might arise, if we have too few TempDB files, let’s go back to storage basics for a minute. SQL Server stores data, in disk or in memory, in 8KB pages, usually stored in groups of 8 KB pages (an extent).

Usually, SQL Server stores one object per extent but not always. If we’re creating and dropping many small TempDB objects (for example, temporary tables, table variables, cursors), we will end up with mixed extents, where data for several objects is stored in the same extent.
There is only one page, the Shared Global Allocation Map (SGAM), which tracks space usage in extents for each 4GB of space. The following figure represents a single TempDB data file, with the black shaded blocks representing the mixed extents.

Every time we drop, create or expand an object in TempDB, SQL Server first has to access this single SGAM page. It then scans the Page Free Space (PFS) page to find out which mixed page it can allocate. After allocation, SQL Server must update the PFS and SGAM pages appropriately. If we have many mixed extent allocations, it can cause massive contention on the initial, single SGAM page.
As you can imagine, this is the reason why we might need to add more TempDB files. If we have four files for TempDB, then we have 4 SGAMs tracking extent usage and, assuming each file is evenly used, we spread the load and ease contention.
However, this only really works if we make sure to keep the TempDB files all the same size, meaning setting the same initial size for each file, and the same auto-growth increment. If we don’t, and we end up with one TempDB file that is bigger than all the others, then we’ll return to a situation of SGAM contention, as most of the action will hit the largest file.
Too many TempDB files
You may read advice online stating that there should be one TempDB file per processor core. Be very careful with this advice. If you have a lot of large temporary tables, or perform a lot of operations that spill to TempDB (for example, big sort operations) then it’s possible that the overhead of SOL Server allocating pages among all the TempDB files, in a round-robin fashion, will slow down these operations. See Paul Randal’s blog post ‘A SQL Server DBA myth a day: (12/30) tempdb should always have one data file per processor core’ for a few more details.
The key to taming TempDB contention is to use the right number of data files and keep them equally sized. Start with four TempDB data files, all equally sized and with the same auto-grow increment, and then constantly monitor TempDB activity levels, and look out for contention.
Trace Flag 1118
This trace flag “forces uniform extent allocations instead of mixed page allocations’ and most people advise to enable it, in order to combat TempDB contention. As always, however, this advice can and likely will change with successive SQL Server version and editions.
After that, we need to monitor for contention issues, for example by tracking PAGELATCH waits on TempDB (see the Further Reading section). If you’re using a tool such as SQL Monitor, then you can deploy the TempDB allocation contention custom metric will alert you if you’re running into SGAM contention.
We have to keep watching TempDB constantly. Applications change, and may suddenly start putting more pressure on TempDB. SQL Server changes; many of its new features tend to use TempDB (for example, AlwaysOn Availability Groups store statistics and versions in TempDB), so we constantly need more throughput.
The case of the horribly bloated tables
Imagine the following figure is a snapshot of a single 8KB page from an Employees table, which has a clustered index on EmployeelD.
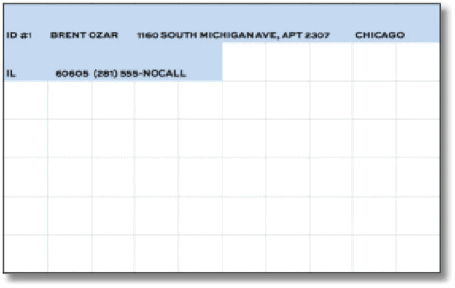
We continue to add more employees as the company grows, and soon the page is more or less full.

Now, we need to update this page to reflect, for example, a change of address. At this point, SQL Server has to tear page in half and store some employees on one page and some on another; in other words, we get a page split.
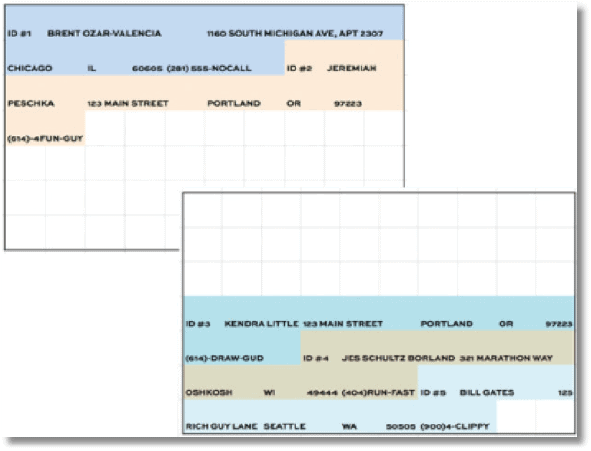
Page splits can be a very 10 intensive operation for SQL Server, both in terms of reads and writes, and they cause low page density and logical fragmentation (logical order of the pages differs from the physical order). The problem mainly associated with clustered indexes, especially in cases where we insert data in an order that is different from the order defined by the clustering key, or if we frequently perform updates that grow the size of the index key. However, page splits can affect pages in the B-tree structure, not just the leaf level pages, and they can affect non-clustered as well as clustered indexes.
Heaps have other problems too
If we update a row on a heap, so it no longer fits on a page, SOL Server moves it to a new location and leaves a pointer in its original spot. When you have many of these pointers, data retrieval slows dramatically.
In order to avoid page splits, many people tinker with the fill factor setting, which determines how densely SQL Server will pack the data pages when it rebuilds or reorganizes an index. In other words, Fill Factor determines the percentage of space used on the page after an index rebuild or reorganization. The default at the server level is 100% (also known as 0%), which means that SQL Server will pack as much data onto each page as possible.
However, we can selectively lower the fill factor value on an index-by-index basis (we can also lower the value at the server level, but avoid doing this unless the server is only used for a single database, and that database’s author requires it.)
For example, if you do many in-place updates, or use a design pattern where many fields start out as NULL and you update them later (e.g. OrderShipDate starts out as NULL) then as these fields “expand”, it can result in excessive page splits. In such cases, leaving a little free space per page, for example by lowering the fill factor to 90%, could allow for these updates without causing unnecessary page splits.
Also, if the clustered index key is not a sequentially increasing field, for example, say the key was on LastName, SQL Server would need to insert people all over that index (assuming we don’t hire in alphabetical order!) and it would be more prone to page splits. Again, lowering fill factor slightly might help.
Be careful, though. If you set Fill Factor to 50% then for sure it will deal with page splits but create a whole raft of new problems…
- Objects take up more pages in the database (meaning, more space) – this problem doesn’t surface as an alarm anywhere on SSMS
- Backups and DBCC checks take longer – the same amount of data is spread across more pages
- We cache less data in the same amount of memory – SQL Server caches 8KB units, not just what’s used in those pages
So how do we fight Fill Factor foibles? Firstly, seek out the indexes where Fill Factor is not 100% and start asking questions. If it’s set to less than 80%, be very suspicious.
|
1 2 3 4 |
SELECT * FROM sys.indexes WHERE fill_factor NOT IN (0, 100); |
In general, my advice would be:
- Always leave the server-level default at 100%.
- If you’re having page split problems, make surgical strikes on those specific indexes, not all indexes.
- If you’re low on memory or disk, consider returning fill factor settings to 100%.
The Call is coming from inside the House!
Let’s return, briefly, to the world of the DBA in the Happy Database movie, where you’re aware of all changes made to the application and database, and all those changes happen in a controlled way and are documented fully.
However, just in case, your world is not like this; just in case your co-DBAs and developers, with no malicious intent, nevertheless constantly “do stuff” and forget to document it or tell you about it, then you need to way to track any negative effects of all these changes.
My script, sp_blitz, will catch a lot of stuff that is wrong, but the problem often is that there is never time to fix it all. However, we do need to remain aware of potential time bombs in our system and to this end, I’ve added the @OutputType parameter to sp_blitz, that reports the number of warnings generated.
|
1 |
EXEC dbo.sp_blitz @OutputType = 'COUNT' |
Simply use the SQL Blitz custom metric in SQL Monitor, and you can track many warnings currently exist, and receive a notification whenever the number increases.
At regular intervals, set aside some time to fix some of the issue and, critically, measure the impact of your work. When it gets near pay review time, plot a graph of issues over time, and the performance improvement that resulted from your fixes.
Summary
In this whitepaper, we covered six scary surprises that lurk behind the innocent facade
of SSMS…:
- Indexes that have been disabled
- Available memory that isn’t available
- Storage that slowly slows down over time
- TempDB with a limp: one file’s too big
- Fill factor that’s bloating your database
- Somebody’s in cahoots with the aliens
…and, some simple but effective solutions:
- Run BrentOzar.com/blitz to catch the problems
- Use a monitoring tool like Redgate SQL Monitor, and some custom metrics to make sure you know immediately when new problems occur
- Apart from a few that I list in my setup checklist (SQL Server 2005/2008/2012/2014 Setup Checklist) don’t touch SQL Server’s default settings unless you have a really good reason
- When you change something, measure its effects; prove that you’ve done some good
Further Reading
- sp_BLITZ – SQL Server Takeover Script
- A Performance Troubleshooting Methodology for SQL Server
- SQL Server Perfmon (Performance Monitor) Best Practices
- Microsoft Windows Dynamic Cache Service
- The SSD Relapse: Understanding and Choosing the Best SSD
- The SSD Anthology: Understanding SSDs and New Drives from OCZ
- Blitz Result: Only One TempDB Data File
- Breaking down TempDB Contention
- Diagnosis: Self-Loathing Index Disorder
- What is Index Fragmentation

Load comments