The series so far:
- Reporting Services Basics: Overview and Installation
- Reporting Services Basics: Creating Your First Report
- Reporting Services Basics: Data Sources and Datasets
- Reporting Services Basics: Parameters
- Reporting Services Basics: Adding Groups to Reports
If you’ve been following along with this series, you have learned about the architecture of Reporting Services (SSRS) and how to build a report using the wizard. Most of the time, the wizard is not that useful, although I must admit that I used the wizard for creating Matrix reports in SSRS for quite some time. In this article, you’ll begin to learn the basics of building a report from the ground up without the help of the wizard. There are two components, data sources and datasets, that you must understand to be able to build reports, so this article spends quite some time covering them.
Start with a Project
To get started, create a new Report Server Project in Visual Studio. In the previous article, you started with the Report Server Project Wizard. The Report Server Project will create the project shell without any objects. It will be up to you to add all the necessary components.
Figure 1 shows the New Project dialogue. Be sure to fill in a Name and click OK to create the project.
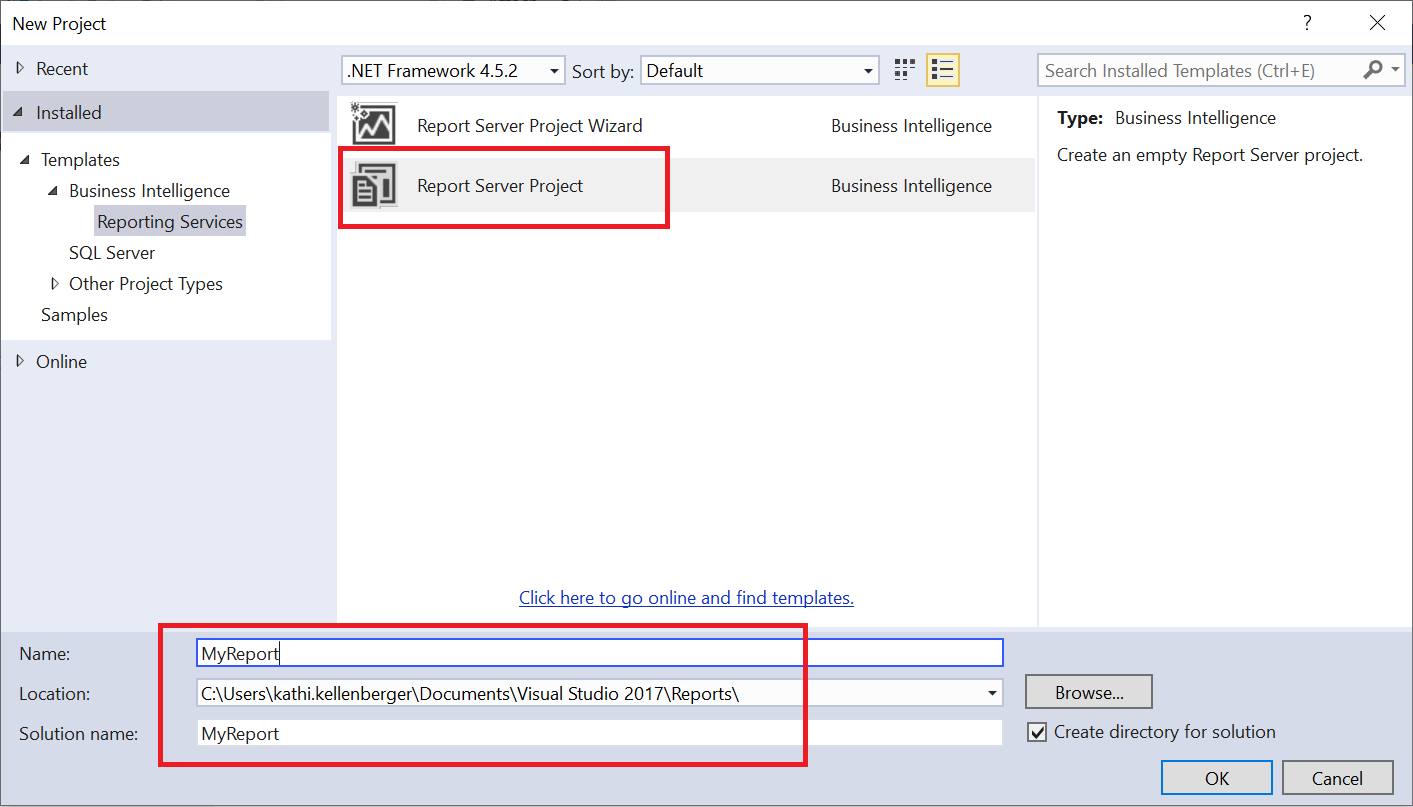
Figure 1: Create a new project
Once you create the project, you’ll see the Solution Explorer, shown in Figure 2, that is empty except for some folders.
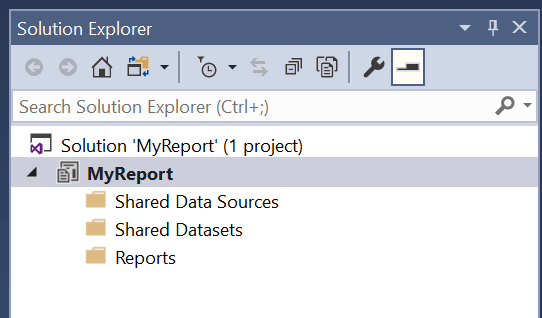
Figure 2: The Solution Explorer
Shared Data Sources
A data source is like an address for the data. It contains the connection string. This might include the server name and stored credentials to get to a SQL Server database or be something as simple as the location of a text file. You can use multiple data sources in a report if the data will come from more than one place.
You can store data sources in two ways: sharing at the project level or embedding in the individual report. My advice is always to share the data sources, especially if you will have dozens or hundreds of reports pointing to the same database. By creating shared data sources, you or the database administrator (DBA) will have fewer of them to manage once the reports are published in the Web Portal.
To get started, right-click the Shared Data Sources folder and select Add New Data Source, as shown in Figure 3.
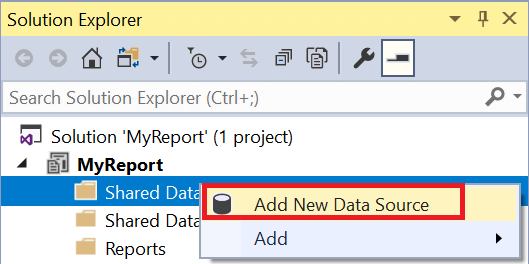
Figure 3: Add New Data Source
This brings up the Shared Data Source Properties dialogue. Fill in a Name for the data source. I suggest using the database name, but your team may have a specific naming convention to use.
Choose the Type of database source. It’s SQL Server by default and what you’ll use in this example, but you might want to review the many sources possible.
If you know your Connection String, you can fill it in, but it’s easier to click Edit to open the Connection Properties dialogue shown in Figure 4. You’ll need to fill in your Server name, Authentication method, and Connect to a database. (If you have problems connecting, review the Connecting to Your SQL Server Instance section in this article. If you are connecting to an instance in your network, check with your DBA for help.) Click OK to save the properties.
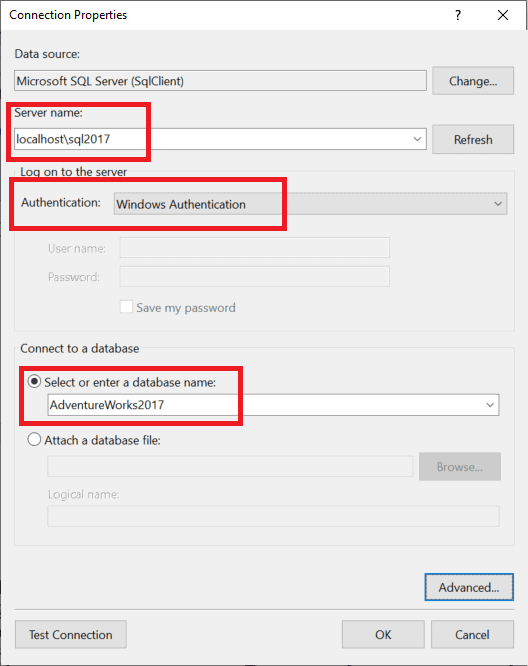
Figure 4: The Connection Properties
Once you save the properties, the General page should similar to Figure 5. Click OK to save the changes.
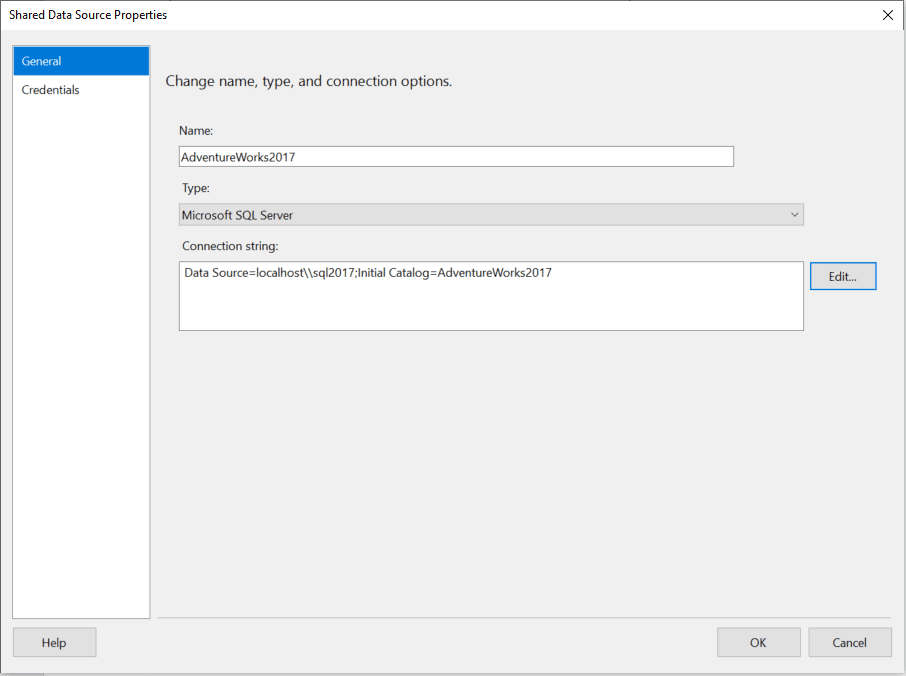
Figure 5: The Shared Data Source Properties
You’ll see the new data source in the Solution Explorer window shown in Figure 6.
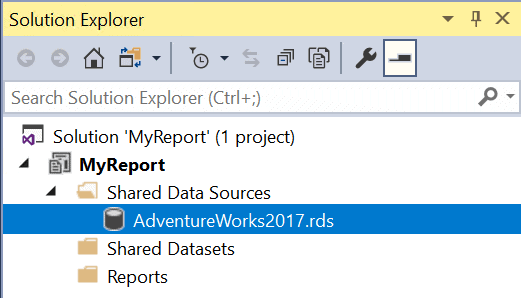
Figure 6: The new data source
At the time of this writing, there is a bug that prevents saving the Credentials settings when first creating the data source. Open the properties again by double-clicking the data source. (Note that if you right-click and choose Properties, you’ll be able to see only the file location.) Figure 7 shows the Credentials page and the correct setting. Fill in the credentials that you used in Step 5 if you did not use Windows authentication. After changing the setting, click OK.
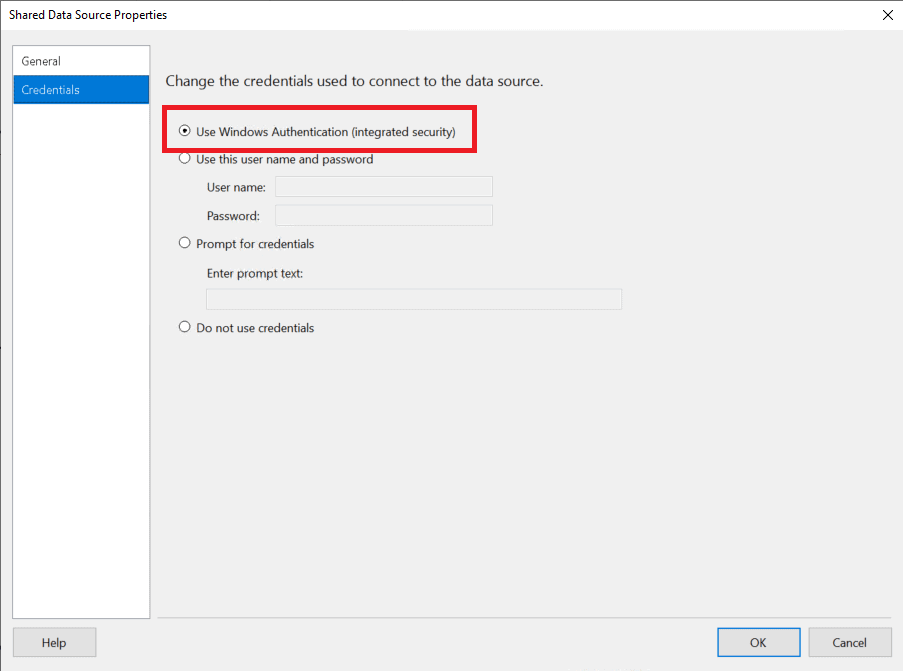
Figure 7: The data source credentials
That’s all there is to create the data source. In step 3, I pointed out that there are many different types of data sources, and configuring each type is different. For now, stick with SQL Server to get started with SSRS. View this article for more information about each type of data source.
Now it’s time to discuss datasets.
Shared Datasets
A dataset is the query that runs when you view the report. The type of query will depend on the data source. For example, when working with SQL Server databases, the query will be written in T-SQL, or you also have the option of calling stored procedures. Even though there is a Shared Datasets folder, most of the time, the dataset should be embedded in the report and not shared. The reason for embedding datasets is that queries are not reused that often. There are exceptions, for example, parameter lists that are reused in many reports. If a dataset is shared, then it will be published when you deploy the project. You probably won’t want to clutter the Web Portal with every dataset for dozens or hundreds of reports.
The report must first exist before you can embed a dataset. Instead of showing you how to create a dataset, first learn how to create a new blank report.
New Reports
When creating a new blank report, you must take care not to kick off the Report Wizard. Follow these steps to create a new blank report.
Right-click the Reports folder and select Add New Item…. Be sure NOT to select Add New Report, because that launches the Report Wizard. Figure 8 shows you the menu item.
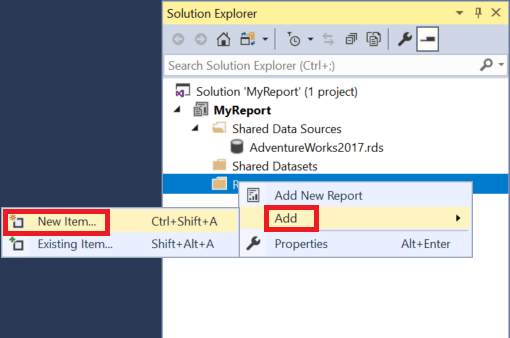
Figure 8: Add new item, not add new report
You’ll then see the Add New Item dialogue shown in Figure 9. Select Report and give the report a name. When working on reports for your company, be sure to provide the report with a meaningful name that will make sense to the people who run the report.
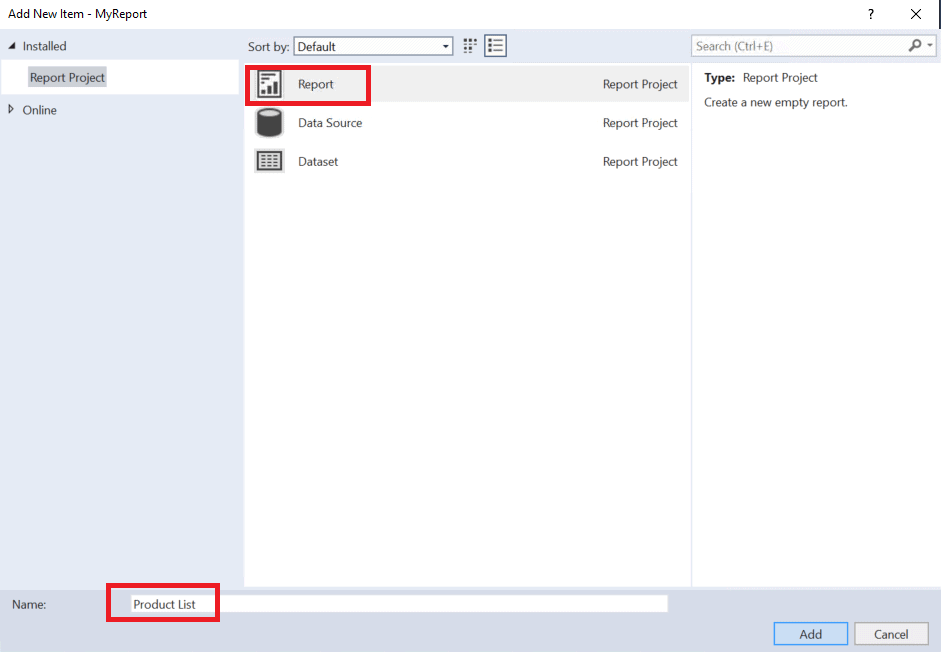
Figure 9: The Add New Item dialogue
Click OK to create the report. You should now see it in the Solution Explorer, as shown in Figure 10.
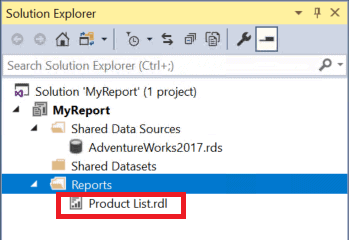
Figure 10: View the new report
The new report may be open in Design view. If not, double-click it to open it. The report canvas will look like Figure 11.
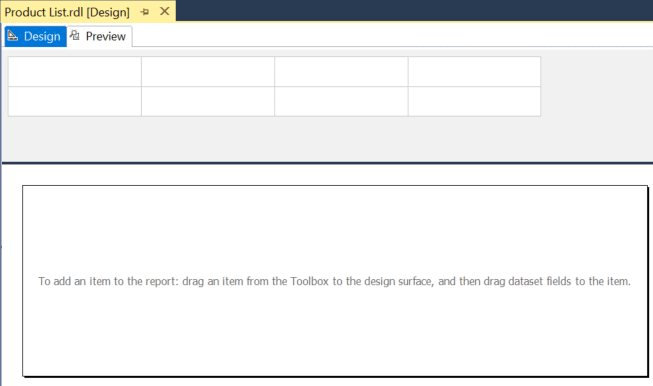
Figure11: The report in Design view
Now you have a new report. On the left side of the screen, you should see the Report Data window. (If you don’t see it, make sure the report canvas is selected and type CTRL+ALT+D.) Figure 12 shows you the Report Data window. Everything in this window is specific to the report you are editing. You’ll learn about the different folders throughout these articles.
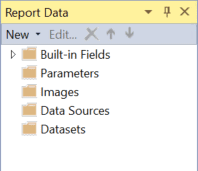
Figure 12: The Report Data window
Right-click the Data Sources folder in the Report Data window and select Add Data Source. This data source will point to a shared reference, the data source you created earlier. Give it a Name and click Use shared data source reference. Select the AdventureWorks2017 data source from the list. (Note that you can give them the same name, but for illustration purposes, I’m naming them differently.) Figure 13 shows the properties. Click OK to create the data source.
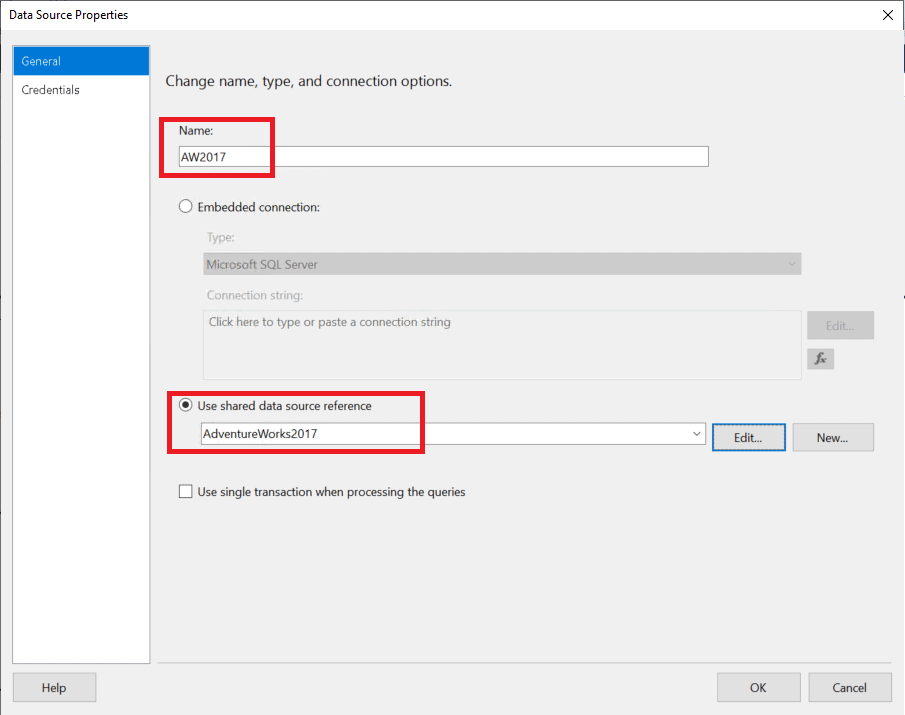
Figure 13: The data source properties
Once you create the data source, you’ll see it in the window. Notice that it has a little arrow on the icon that designates that it is pointing to a shared data source, as shown in Figure 14.
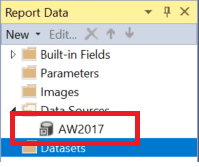
Figure 14: The new data source
You now have everything in place to create an embedded dataset.
Embedded Datasets
As mentioned earlier, it makes sense to embed most datasets in the reports instead of sharing them. Shared datasets end up published as reusable Report Parts for creating ad-hoc reports by advanced users. Most datasets are not needed for this and sharing them will clutter up the folder and make it more difficult for end users to find what they need. In the later article about parameters, you’ll learn to create shared datasets when it makes sense.
Make sure that your data source pointing to the shared data source is in place and follow these steps to create a dataset.
Fill in a Name that describes your query. Select Use a dataset embedded in my report. A dropdown box for the data source will appear. Select the data source you just created. At this point, the dialogue box will look like Figure 15.
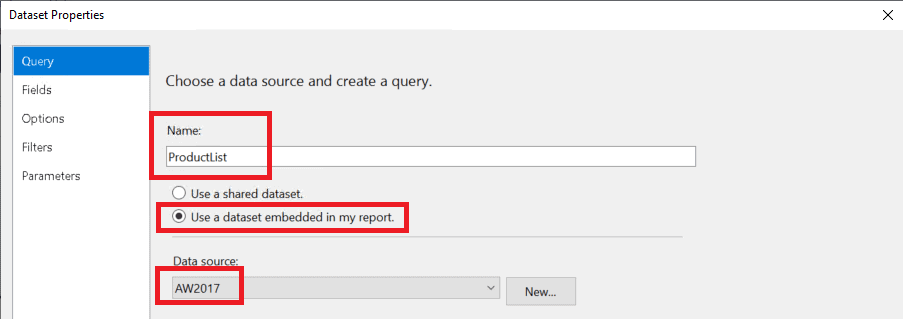
Figure 15: The Datasets Properties so far
Make sure that the Query type is set to Text and paste in this query:
|
1 2 3 4 5 6 7 8 |
SELECT Prod.ProductID, Prod.Name AS ProductName, Prod.Color, Prod.StandardCost, Prod.ListPrice, Sub.Name AS SubCategory, Cat.Name AS Category FROM Production.Product AS Prod JOIN Production.ProductSubcategory AS Sub ON Prod.ProductSubcategoryID = Sub.ProductSubcategoryID JOIN Production.ProductCategory AS Cat ON Sub.ProductCategoryID = Cat.ProductCategoryID; |
There is also a Query Designer you can use to build simple queries, or you can import a query from a text file. I recommend writing the query in SSMS or ADS and pasting it here. The Dataset Properties should look like Figure 16. Click OK to create the dataset.
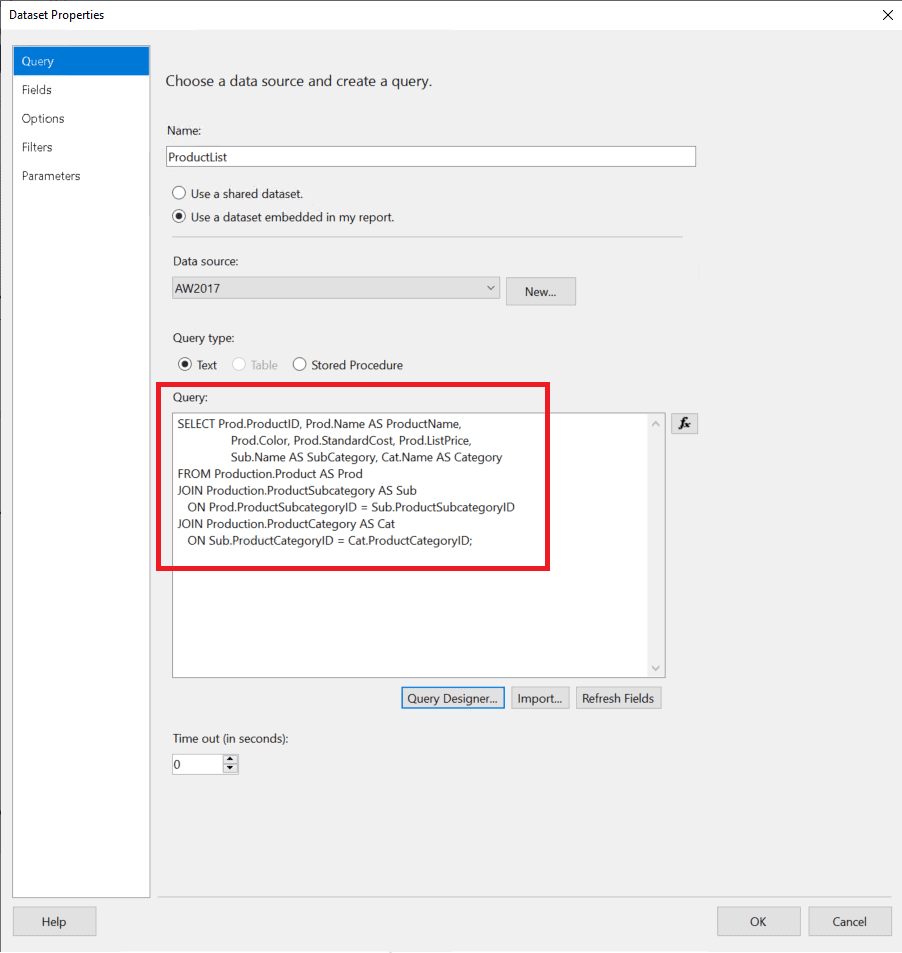
Figure 16: Paste in the query
Once you have saved the dataset, you’ll see it along with all the fields in the Report Data window. Click the arrow next to the dataset to expand the fields, as shown in Figure 17.
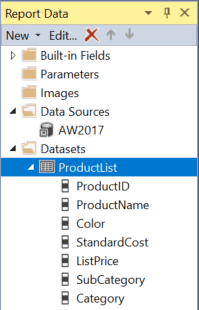
Figure 17: The new dataset
If you have made any syntax errors in the query – and it’s a good practice to make sure it runs first in SSMS – the fields will not show up. To troubleshoot, you can double-click to open the properties again and fix the query. You may need to click Refresh Fields to see the change.
Adding Fields to the Report
You’ll learn much more about creating reports throughout this series, but to make sure that what you’ve done so far works follow these steps to create a rudimentary report:
Right-click on the report canvas and select Insert Table as shown in Figure 18. You can also drag objects from the Toolbox window to the canvas to accomplish the same thing.
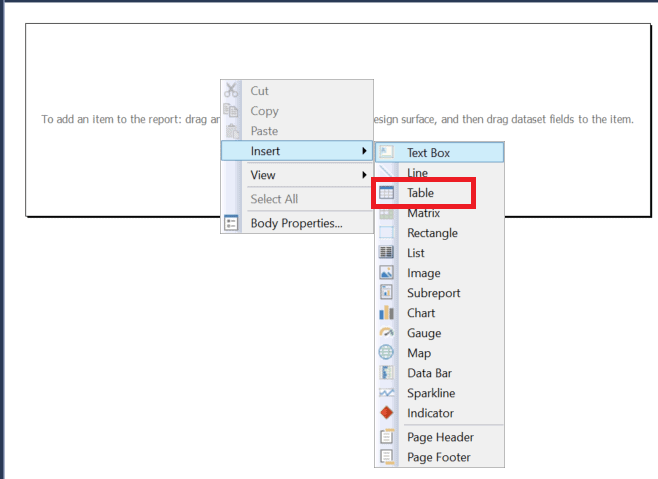
Figure 18: Insert a table
You’ll see a small grid with a Header and Detail row shown in Figure 19.

Figure 19: The new table
There are three ways to add fields to the table. You can drag them over to the Detail row from the dataset in the Report Data window. You can hover over a cell and select from the little popup menu, as shown in Figure 20. You could also type the field with brackets in the detail row, but the header will not be automatically filled in for you. If you try this last method, note that the fields are case-sensitive.
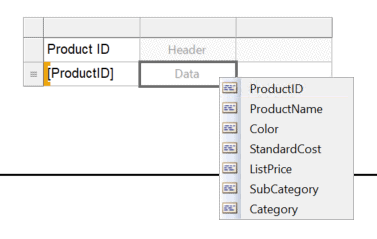
Figure 20: How to add a field to the table
Now that you have added a few fields, click Preview to view the report so far. My report looks like Figure 21.
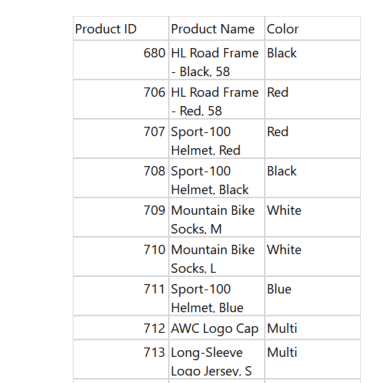
Figure 21: The report so far
Of course, there is much more work to do on this report, but this shows you that your dataset is working.
Summary
In this article, you learned how to
- Create an SSRS project
- Add a shared data source
- Add a report without launching the wizard
- Point a report data source to a shared data source
- Embed a dataset in the report
- Add a table to the report
- Add some fields to the table
I suggest that you refer to this article until you become comfortable with data sources and datasets. The concepts are confusing for many students, so having a resource you can follow will make all the difference.
The next article will build on what you know about creating reports, and you’ll get to learn about some of the other components like headers and footers that make up a report.

Load comments