- Eh? What are GROUPING SET, CUBE and ROLLUP in SQL?
- Why would ROLLUP or CUBE be useful to me?
- Are these standard SQL or are they a Microsoft-only thing?
- Can I exclude one or more columns from the ROLLUP?
- What are GROUPING SETs then? Should I know about them?
- Why would we want to combine columns in any aggregation?
- Is there more to GROUPING SETS than a way of doing ‘à la carte’ CUBEs?
- Why are the functions Grouping() and Grouping_ID() provided?
1. Eh? What are GROUPING SET, CUBE and ROLLUP in SQL?
CUBE, ROLLUP and GROUPING SET are optional operators of the GROUP BY clause of the SELECT statement for doing reports with large amounts of information. They allow you to do several GROUP BY operations in one statement, potentially saving a lot of time and computational effort. They can provide all the information needed for reporting, including totals, whilst giving good performance over large tables, and helping the Query Optimiser devise a good execution plan.
The extra ‘super-aggregate’ rows provide summary values, thereby allowing you to have several ‘aggregations’ such as SUM() or MAX() within the one result. The NULLs within these rows in the result are intended to mean ‘all’ rather than ‘unknown’. It allows you to get all the aggregations you need in one pass through the table. Because of the presence of extra rows in the results, extra functions GROUPING() and GROUPING_ID() are provided to indicate these extra ‘super-aggregate’ rows, and which columns are being aggregated.
This makes a great deal of sense if you have an application that needs to run several reports without extra computation or without going back to the database: You have everything you need in one result.
Take this standard example of a ROLLUP (I’m using AdventureWorks 2012 here)..
|
1 2 3 4 5 6 |
SELECT t.[Group] AS region, t.name AS territory, sum(TotalDue) AS revenue, datepart(yyyy, OrderDate) AS [year], datepart(mm, OrderDate) AS [month] FROM Sales.SalesOrderHeader s INNER JOIN Sales.SalesTerritory T ON s.TerritoryID = T.TerritoryID GROUP BY t.[Group], t.name, datepart(yyyy, OrderDate), datepart(mm, OrderDate) WITH ROLLUP |
As well as the simple GROUP BY aggregate rows, with the total due for each month, that you’d get with a simple grouping, you also get subtotal or super-aggregate rows, and also a grand total row. (here is the beginning of the result)
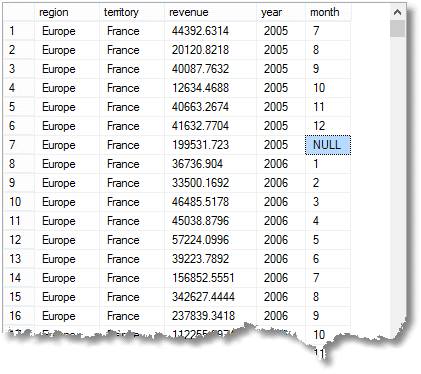
That NULL I’ve highlit means that the row is an aggregate for ‘all’ months of 2005 in France (part of Europe region)
As well as all this, you get the total due for each year, for each territory and territorial group, as well as the full total due. (from the end)
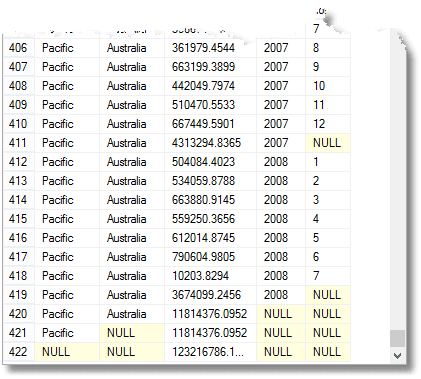
Those NULLs mean ‘All’, remember. The last row is the grand total, and above it is the total for the pacific region. Above that is Australia’s contribution to the pacific region. The fourth row from the bottom is Australia’s 2008 contribution. The number of groupings that is returned is one more than the number of expressions in the composite element list provided to the GROUP BY statement.
To get the same effect without using a rollup, you’d need to do something like this (AdventureWorks2012)
|
1 2 3 4 5 6 7 8 9 10 11 12 13 14 15 16 17 18 19 20 21 |
; WITH myGrouping ( region, territory, totalDue, [year], [month] ) AS ( SELECT t.[Group], t.name, sum(TotalDue) AS revenue, datepart(yyyy, OrderDate) AS [year], datepart(mm, OrderDate) AS [month] FROM Sales.SalesOrderHeader s INNER JOIN Sales.SalesTerritory T ON s.TerritoryID = T.TerritoryID GROUP BY t.name, t.[Group], datepart(yyyy, OrderDate), datepart(mm, OrderDate)) SELECT Region, territory, totalDue, [year], [month] FROM myGrouping UNION ALL SELECT Region, territory, sum(totalDue), [year], NULL FROM myGrouping GROUP BY Region, territory, [year] UNION ALL SELECT Region, territory, sum(totalDue), NULL, NULL FROM myGrouping GROUP BY Region, territory UNION ALL SELECT Region, NULL, sum(totalDue), NULL, NULL FROM myGrouping GROUP BY Region UNION ALL SELECT NULL, NULL, sum(totalDue), NULL, NULL FROM myGrouping |
Which is a lot more expensive in CPU and I/O. Note that the standard syntax of the GROUP BY clause in recent versions is
|
1 2 |
... 'GROUPBY ROLLUP (t.[Group],t.name,datepart(yyyy,OrderDate),datepart(mm,OrderDate))' |
This new syntax allows you some extra functionality. Remember too that the column order affects the output groupings of ROLLUP and can affect the number of rows in the result set.
The CUBE does the same general thing but, instead of providing a hierarchy of totals in ordered super-aggregate rows, it provides all the ‘super-aggregate’ permutations (‘symmetric super-aggregate’ rows), the so-called cross-tabulation rows. If you wanted to know which territory gave the most orders in march, or which territory performed least well in 2006, then you’d need a CUBE. You are providing all the possible summations in the result.
GROUPING SET allows you to fine-tune your result to provide more specialised information above and beyond CUBE. It can provide summary information on combinations of dimensions. You could get exactly the same result as in our ROLLUP example by using GROUPING SETS, but with a lot more typing.
|
1 2 3 4 5 6 7 8 9 10 |
SELECT t.[Group] AS region, t.name AS territory, sum(TotalDue) AS revenue, datepart(yyyy, OrderDate) AS [year], datepart(mm, OrderDate) AS [month] FROM Sales.SalesOrderHeader s INNER JOIN Sales.SalesTerritory T ON s.TerritoryID = T.TerritoryID GROUP BY GROUPING SETS( (T.[Group], T.name,datepart(yyyy, OrderDate), datepart(mm, OrderDate)), (T.[Group], T.name,datepart(yyyy, OrderDate) ), (T.[Group], T.name), (T.[Group]), ()) |
This is just to show how they relate. In reality, you’d resort to GROUPING SETS to get results that are impossible with ROLLUP or CUBE.
Almost all these summaries can be gained from using just GROUP BY, but only through repeatedly GROUPing the result of a GROUP BY, or by making more than one pass through the data.
When you are using CUBE, ROLLUP or GROUPING SETS, you can’t use the DISTINCT keyword in your aggregate expressions, such as AVG (DISTINCT column_name), COUNT (DISTINCT column_name), and SUM (DISTINCT column_name)
2. Why would ROLLUP or CUBE be useful to me?
ROLLUP and CUBE had their heyday before SSAS. They were useful for providing the same sort of facilities offered by the cube in OLAP. It still has its uses though. In AdventureWorks, it is overkill, but if you are handling large volumes of data you need to pass over your data only once, and do as much as possible on data that has been aggregated. Events that happened in the past can’t be changed, so it is seldom necessary to retain historic data on an active OLTP system. Instead, you only need to retain the aggregated data at the level of detail (‘granularity’) required for all foreseeable reports.
Imagine you are responsible for reporting on a telephone switch that has two million or so calls a day. If you retain all these calls on your OLTP server, you are soon going to find the SQL Server labouring over usage reports. You have to retain the original call information for a statutory time period, but you determine from the business that they are, at most, only interested in the number of calls in a minute. Then you have reduced your storage requirement on the OLTP server to 1.4% of what it was, and the call records can be archived off to another SQL Server for ad-hoc queries and customer statements. That’s likely to be a saving worth making. The CUBE and ROLLUP clauses allow you to even store the row totals, column totals and grand totals without having to do a table, or clustered index, scan of the summary table.
As long as changes aren’t made retrospectively to this data, and all time periods are complete, you never have to repeat or alter the aggregations based on past time-periods, though grand totals will need to be over-written!.
Let’s pretend, but using AdventureWorks2012 so you can play along.
Firstly, we’ll create a temporary summary table.
|
1 2 3 4 5 6 7 8 9 10 11 12 13 14 15 16 17 18 19 |
IF EXISTS (SELECT * FROM tempdb.sys.tables WHERE name LIKE '#AggregationTable%') DROP TABLE #aggregationTable --delete the temporary table if it exists GO SELECT identity(INT,1,1) AS [surrogate], --so we can have a unique column t.[Group] AS region, t.name AS territory, sum(TotalDue) AS revenue, datepart(yyyy, OrderDate) AS [year], datepart(mm, OrderDate) AS [month], grouping(t.name) AS isNameGroup, --Does this relate to ALL territories grouping(t.[Group]) AS isGroupGroup,--Does this relate to ALL continents grouping(datepart(yyyy, OrderDate)) AS isYearGroup,--Does this relate to ALL years grouping(datepart(mm, OrderDate)) AS isMonthGroup,--Does this relate to ALL months Grouping_ID (t.name,t.[Group], datepart(yyyy, OrderDate),datepart(mm, OrderDate)) AS isGroupingRow --is this an extra non-data row containing aggregate data INTO #AggregationTable FROM Sales.SalesOrderHeader s INNER JOIN Sales.SalesTerritory T ON s.TerritoryID = T.TerritoryID GROUP BY t.name, t.[Group], datepart(yyyy, OrderDate), datepart(mm, OrderDate) WITH ROLLUP |
Notice that we are adding extra ‘bit’ columns that tell us which rows contain the summary rows. If you mistakenly add them to any further aggregations you’ll get some seriously inflated results. You can’t use Grouping() or Grouping_ID on the saved result, obviously, so you ought to provide something in its stead.
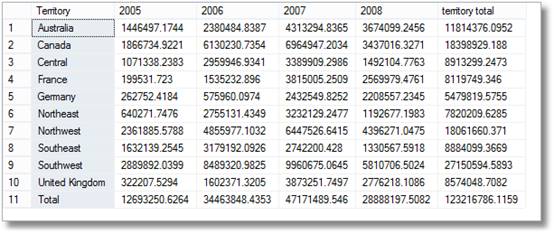
Now we can produce a pivot table very fast
|
1 2 3 4 5 6 7 8 9 10 11 12 13 14 15 16 17 18 19 |
-- now we can create a simple pivot table with row and -- column totals SELECT Territory, sum(CASE [year] WHEN 2005 THEN revenue ELSE 0 END) AS [2005], sum(CASE [year] WHEN 2006 THEN revenue ELSE 0 END) AS [2006], sum(CASE [year] WHEN 2007 THEN revenue ELSE 0 END) AS [2007], sum(CASE [year] WHEN 2008 THEN revenue ELSE 0 END) AS [2008], sum(revenue) AS [territory total] FROM #AggregationTable WHERE isGroupingrow =0 GROUP BY territory UNION ALL SELECT 'Total', sum(CASE [year] WHEN 2005 THEN revenue ELSE 0 END) AS [2005], sum(CASE [year] WHEN 2006 THEN revenue ELSE 0 END) AS [2006], sum(CASE [year] WHEN 2007 THEN revenue ELSE 0 END) AS [2007], sum(CASE [year] WHEN 2008 THEN revenue ELSE 0 END) AS [2008], sum(revenue) AS [territory total] FROM #AggregationTable WHERE isYearGroup =0 AND isMonthGroup=1 |
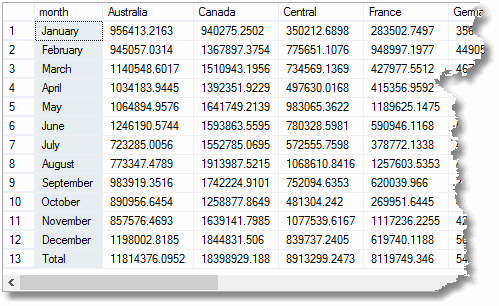
So there are brief smiles from the managers on seeing this, but then they brightly say ‘I’m sure I also asked for a breakdown by territory per month
With a brief chuckle, you do this.
|
1 2 3 4 5 6 7 8 9 10 11 12 13 14 15 16 17 18 19 20 21 22 23 24 25 26 27 28 29 30 31 32 |
SELECT datename(MONTH,dateadd(MONTH, [MONTH],'01 dec 2000')) AS [month], sum(CASE territory WHEN 'Australia' THEN revenue ELSE 0 END) AS [Australia], sum(CASE territory WHEN 'Canada' THEN revenue ELSE 0 END) AS [Canada], sum(CASE territory WHEN 'Central' THEN revenue ELSE 0 END) AS [Central], sum(CASE territory WHEN 'France' THEN revenue ELSE 0 END) AS [France], sum(CASE territory WHEN 'Germany' THEN revenue ELSE 0 END) AS [Germany], sum(CASE territory WHEN 'Northeast' THEN revenue ELSE 0 END) AS [Northeast], sum(CASE territory WHEN 'Northwest' THEN revenue ELSE 0 END) AS [Northwest], sum(CASE territory WHEN 'Southeast' THEN revenue ELSE 0 END) AS [Southeast], sum(CASE territory WHEN 'Southwest' THEN revenue ELSE 0 END) AS [Southwest], sum(CASE territory WHEN 'United Kingdom' THEN revenue ELSE 0 END) AS [United Kingdom], sum(revenue) AS [Month total] FROM #AggregationTable WHERE isGroupingrow =0 GROUP BY month UNION ALL SELECT 'Total', sum(CASE territory WHEN 'Australia' THEN revenue ELSE 0 END) AS [Australia], sum(CASE territory WHEN 'Canada' THEN revenue ELSE 0 END) AS [Canada], sum(CASE territory WHEN 'Central' THEN revenue ELSE 0 END) AS [Central], sum(CASE territory WHEN 'France' THEN revenue ELSE 0 END) AS [France], sum(CASE territory WHEN 'Germany' THEN revenue ELSE 0 END) AS [Germany], sum(CASE territory WHEN 'Northeast' THEN revenue ELSE 0 END) AS [Northeast], sum(CASE territory WHEN 'Northwest' THEN revenue ELSE 0 END) AS [Northwest], sum(CASE territory WHEN 'Southeast' THEN revenue ELSE 0 END) AS [Southeast], sum(CASE territory WHEN 'Southwest' THEN revenue ELSE 0 END) AS [Southwest], sum(CASE territory WHEN 'United Kingdom' THEN revenue ELSE 0 END) AS [United Kingdom], sum(revenue) AS [Month total] FROM #AggregationTable WHERE isGroupingrow =0 |
But if you’d used CUBE instead of Rollup, that last ‘total’ row would already be calculated. In a real example that would cost time doing the report. You can do a CUBE on up to ten dimensions; although they tend to bulk up the aggregation, they aren’t too costly.
3. Are these standard SQL or are they a Microsoft-only thing?
These are now standard ANSI SQL from 1999, though WITH CUBE and WITH ROLLUP were first introduced by Microsoft. This inclusion is somewhat surprising in that they introduce a second meaning, ‘all’, for the NULL value besides ‘unknown’. When Microsoft first introduced CUBE and ROLLUP, the syntax was slightly different, but both forms are allowed in SQL Server. Only one syntax style can be used in a single SELECT statement, and you should use the ISO compliant syntax for all new work.
4. Can I exclude one or more columns from the ROLLUP?
If you want to! Imagine that I didn’t want a super-aggregate total for all the regions (t.[group])
|
1 2 3 4 5 6 |
SELECT t.[Group] AS region, t.name AS territory, sum(TotalDue) AS revenue, datepart(yyyy, OrderDate) AS [year], datepart(mm, OrderDate) AS [month] FROM Sales.SalesOrderHeader s INNER JOIN Sales.SalesTerritory T ON s.TerritoryID = T.TerritoryID GROUP BY t.[group], ROLLUP (t.name, datepart(yyyy, OrderDate), datepart(mm, OrderDate)) |
Here we are using the ANSI SQL 2006 compliant syntax. You can do the same thing with a cube. I’ve never found a practical use for this but you might come across it
5. What are GROUPING SETs then? Should I know about them?
GROUPING SET means you are asking SQL to group the result several times. You can use the GROUPING SETS syntax to specify precisely which aggregations to compute. Here’s an example.
|
1 2 3 4 5 6 |
SELECT t.[Group] AS region, t.name AS territory, sum(TotalDue) AS revenue, datepart(yyyy, OrderDate) AS [year], datepart(mm, OrderDate) AS [month] FROM Sales.SalesOrderHeader s INNER JOIN Sales.SalesTerritory T ON s.TerritoryID = T.TerritoryID GROUP BY t.[GROUP], GROUPING SETS(ROLLUP(t.name), ROLLUP(datepart(yyyy, OrderDate), datepart(mm, OrderDate))) |
Here, you are asking for the breakdown by territory group for every month of every year with month and year totals, followed by a summary total by territory name, but without a grand total. Unlike the ROLLUP, you get the same result whatever the order of the columns within each GROUPING SET and the order of the GROUPING SETS.
GROUPING SETs can give you precisely what CUBE and ROLLUP gives you and a lot more besides. As you can see with this last example, you can use standard ‘table d’hôte’ CUBE and ROLLUP mixed together with directly-expressed ‘à la carte ‘GROUPING SETs.
6. Why would we want to combine columns in any aggregation?
Where two columns should be combined in some reports, it is useful to declare an aggregation that combines two columns. In the first example we combine year and month for the rollup, having the effect of restricting the totals to just each territory,
|
1 2 3 4 5 6 7 |
--get the totals for each territory only - no totals for each region or year SELECT t.[Group] AS region, t.name AS territory, sum(TotalDue) AS revenue, datepart(yyyy, OrderDate) AS [year], datepart(mm, OrderDate) AS [month] FROM Sales.SalesOrderHeader s INNER JOIN Sales.SalesTerritory T ON s.TerritoryID = T.TerritoryID GROUP BY t.[Group], t.name, ROLLUP ((datepart(yyyy, OrderDate), datepart(mm, OrderDate))) |
That extra bracket in the ROLLUP clause has had the effect of restricting the aggregations to just the territory and the month/year. Leave them out, and you get totals for each year.
|
1 2 3 4 5 6 7 8 9 10 |
--get the totals for each year within each territory as well as the totals --for each territory -- no totals for each region SELECT t.[Group] AS region, t.name AS territory, sum(TotalDue) AS revenue, datepart(yyyy, OrderDate) AS [year], datepart(mm, OrderDate) AS [month] FROM Sales.SalesOrderHeader s INNER JOIN Sales.SalesTerritory T ON s.TerritoryID = T.TerritoryID GROUP BY t.[Group], t.name, ROLLUP (datepart(yyyy, OrderDate), datepart(mm, OrderDate)) |
This can be very useful for certain data. We have avoided needing to combine columns here. If you were to do a CUBE, and the terms for territories used the words like ‘Northern’ or ‘Southern’ to describe a territory in more than one region, you would have some bizarre aggregations that apply to ‘northern’ territories that are unrelated. By combining columns, you would avoid this.
7. Is there more to GROUPING SETS than a way of doing ‘à la carte’ CUBEs?
I’m not sure that I’d be shy about asking this question. SQL:1999’s GROUPING SETS provide a rich recursive syntax that allows you to aggregate combinations of columns and define all sorts of esoteric reports providing up to ten dimensions. The aggregations can be nested and you can nest CUBEs within ROLLUPs and nest ROLLUPs within CUBEs. You will need to read a specialist publication to find out more about this.
8. Why are the functions Grouping() and Grouping_ID() provided?
It isn’t really a good idea to use NULL to signify that a column is an aggregation. The problem is that, if a grouping column contains null values, all null values are considered equal, and put into a single NULL group which masquerades as a summary. To get around the obvious difficulty of NULL values in the original data, two functions are provided: Grouping() and Grouping_ID().
The Grouping() function is passed the name of a column that participated in the ROLLUP, CUBE or GROUPING SET. It returns zero if this row is a summary for this column with a NULL value meaning ‘all’ or whether it contains a value.
The GROUPING_ID function is passed a list that must exactly match the expression in the GROUP BY list. GROUPING_ID is created as a bitmap of the respective summary columns. If, for example the territory column has a NULL meaning ‘all’ territories rather than a name of a territory, and it is listed as the second column, then the second bit from the left is set. This integer is then returned.
Grouping_ID() is generally used to indicate whether the row is a primary or secondary aggregation (0 or >0) and, if secondary, then excluded from any further GROUP BY manipulation.
It is usually considered good practice to include a bit column for every dimension (such as ‘Territory’ or ‘Region’ in our example) that is set if the row is a summary for that dimension, together with a Grouping_ID() value to assist any further grouping of the result.
To illustrate the way that Grouping_ID actually works, here we get to look at the way the bits in the Grouping_ID are set according to the type of summary. We’ll use Phil Factor’s function ToBinaryString to show the bits.
|
1 2 3 4 5 6 7 8 9 |
SELECT t.[Group] AS region, t.name AS territory, sum(TotalDue) AS revenue, datepart(yyyy, OrderDate) AS [year], datepart(mm, OrderDate) AS [month], right ( dbo.ToBinaryString(--list all the group by items as they are Grouping_ID(t.[Group], t.name, datepart(yyyy, OrderDate),datepart(mm, OrderDate)) ),4) AS [Grouping Bitmap]--just use the last four characters as we have four columns in our list. FROM Sales.SalesOrderHeader s INNER JOIN Sales.SalesTerritory T ON s.TerritoryID = T.TerritoryID GROUP BY CUBE(t.[Group], t.name, datepart(yyyy, OrderDate),datepart(mm, OrderDate)) |
This gives (just a sample of course)…
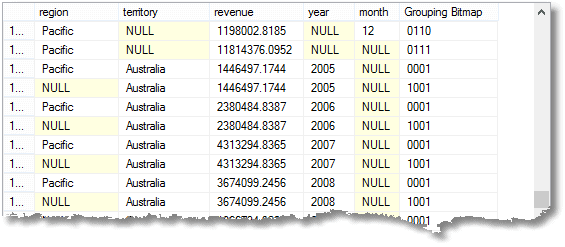
The interesting thing here is that each ‘1’ in the grouping bitmap represents the corresponding group-by element. The top row has pacific region (0) all territories (1), all years, (1), 12th month (0). That last row has All regions (1), Australia (0), 2008(0) and all months (1). With some simple bit-manipulation you can avoid dealing with nulls!

Load comments