
In-Memory OLTP is an advanced feature of SQL Server that you can use to gain incredible performance in high transnational workloads. With the release of Service pack 1 for SQL Server 2016 this previously Enterprise-only feature became available on all edition of SQL Server 2016. So how does the Query Store interact with In-Memory OLTP? As it turns out, both technologies play nicely with each other, though some special attention is required if you want to get the most out of both of them.
What is In-Memory OLTP?
In-Memory OLTP, codename ‘Hekaton’, is a technology aimed at making the execution of transactions and access to data more efficient. Although it was first introduced in SQL Server 2014 as an Enterprise-Only feature, it then became available on all editions of SQL Server 2016 with the release of Service pack 1.
In-Memory OLTP introduces memory-optimized tables, meaning that they reside entirely in the memory of your server but are fully durable. By ‘durable’, we mean that a restart, or crash, of SQL Server that forces your memory to flush doesn’t impact the Memory-optimized table. Along with introducing Memory-optimized tables, Microsoft completely changed the lock and latch behavior for those queries that accessed Memory-optimized tables, removing the contention that can occur on traditional disk-based tables.
Another very powerful addition to the In-Memory OLTP technology is the natively compiled stored procedure. Natively compiled stored procedures are similar to traditional stored procedures but they are directly compiled into native (machine) code. This means that natively compiled stored procedures avoid the interpretation that is required for normal stored procedures and can run directly on the CPU. Natively compiled stored procedures are restricted to execution against Memory-optimized tables, but are very efficient in use.
So let’s take a look how the Query Store interacts with queries against Memory-optimized tables and the usage of natively compiled stored procedures!
Setting up out tests
Before we can get started with analyzing Query Store data in combination with In-Memory OLTP, we have to configure our test database. For this I am going to use the AdventureWorks database on my test system. This database has the Query Store enabled. If you want to replay these tests yourself, make sure it is enabled before running the demos.
The first thing we need to do before a database can use In-Memory OLTP is to create a Memory-Optimized Filegroup to our database. The queries below will add a filegroup called “InMemory” to the AdventureWorks database and create a file that holds our durable Memory-Optimized table data.
|
1 2 3 4 |
ALTER DATABASE AdventureWorks ADD FILEGROUP InMemory CONTAINS MEMORY_OPTIMIZED_DATA; GO ALTER DATABASE AdventureWorks ADD FILE (name='InMemory', filename='D:\data\InMemory.ndf') TO FILEGROUP InMemory; GO |
Now that we have our Memory-Optimized Filegroup in place, it is time to create our first Memory-Optimized table. The script below will create a new table called Sales.SalesOrderDetail_InMemory. Notice the WITH (MEMORY_OPTIMIZED=ON) at the end of the statement. That indicates that this table is going to be a Memory-Optimized table.
Notice the WITH (MEMORY_OPTIMIZED=ON) at the end of the statement. That indicates that this table is going to be a Memory-Optimized table.
|
1 2 3 4 5 6 7 8 9 10 11 12 13 14 15 16 |
CREATE TABLE [Sales].[SalesOrderDetail_InMemory] ( [SalesOrderID] [int] , [SalesOrderDetailID] [int] PRIMARY KEY NONCLUSTERED NOT NULL, [CarrierTrackingNumber] [nvarchar](25) NULL, [OrderQty] [smallint] NOT NULL, [ProductID] [int] NOT NULL, [SpecialOfferID] [int] NOT NULL, [UnitPrice] [money] NOT NULL, [UnitPriceDiscount] [money] NOT NULL, [LineTotal] [money], [rowguid] [uniqueidentifier] NOT NULL, [ModifiedDate] [datetime] NOT NULL ) WITH (MEMORY_OPTIMIZED=ON) GO |
To generate some more interesting Execution Plans, I am going to add an index to the ProductID column.
|
1 2 |
ALTER TABLE Sales.SalesOrderDetail_InMemory ADD INDEX idx_ProductID HASH (ProductID) WITH (BUCKET_COUNT = 64) |
You’ll have noticed that the index is a special type of index you can only use with Memory-Optimized tables, the Hash Index. Hash indexes work very differently from clustered or non-clustered indexes. Murilo Miranda wrote a nice write-up how Hash Indexes are structured in his article here: https://www.simple-talk.com/sql/database-administration/in-memory-oltp-row-structure-and-indexes/.
The last thing we need to do now is adding some rows into our Memory-Optimized table. For this I am selecting all the rows in the Sales.SalesOrderDetail table and inserting them into our Sales.SalesOrderDetail_InMemory table.
|
1 2 3 4 5 6 7 8 9 10 11 12 13 14 15 16 17 18 |
INSERT INTO Sales.SalesOrderDetail_InMemory ( [SalesOrderID], [SalesOrderDetailID], [CarrierTrackingNumber], [OrderQty], [ProductID], [SpecialOfferID], [UnitPrice], [UnitPriceDiscount], [LineTotal], [rowguid], [ModifiedDate] ) SELECT * FROM Sales.SalesOrderDetail GO |
Finally I am going to purge all the data inside the Query Store so we have a bit of an easier time looking up Query Data inside the Query Store.
|
1 |
ALTER DATABASE AdventureWorks SET QUERY_STORE CLEAR; |
Now that we have our Memory-Optimized table in place, let’s take a look what the Query Store records when we query the table.
Query Store and Memory-Optimized tables
I am going to run a very simple query against our Memory-Optimized table that we created earlier: This query returns a single row from the Sales.SalesOrderDetail_InMemory table.
|
1 2 3 4 |
SELECT * FROM Sales.SalesOrderDetail_InMemory WHERE SalesOrderDetailID = 121115 |
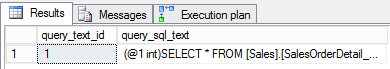
After executing this query I am then using the query below to retrieve the query_text_id for the query we executed above.
|
1 2 3 4 5 |
SELECT query_text_id, query_sql_text FROM sys.query_store_query_text WHERE query_sql_text = '(@1 int)SELECT * FROM [Sales].[SalesOrderDetail_InMemory] WHERE [SalesOrderDetailID]=@1' |
In this case, because I purged the Query Store before running these queries, the ID is ‘1’.
This information already confirms that the Query Store is recording information about queries that execute against Memory-Optimized tables. If the Query Store would not capture these queries there would be no data returned when we ran the query above.
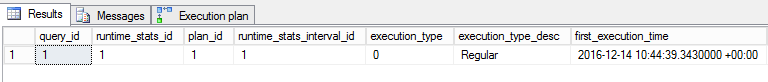
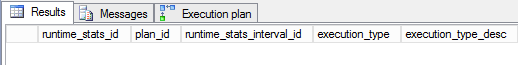
Let’s use the query_text_id we retrieved and use it to retrieve the runtime statistics of the query against the Memory-Optimized table.
|
1 2 3 4 5 6 7 8 9 |
SELECT qsq.query_id, qsrs.* FROM sys.query_store_query qsq INNER JOIN sys.query_store_plan qsp ON qsq.query_id = qsp.query_id INNER JOIN sys.query_store_runtime_stats qsrs ON qsp.plan_id = qsrs.plan_id WHERE qsq.query_text_id = 1 |
As you can see in the figure below, the Query Store keeps track of the runtime statistics of queries against Memory-Optimized tables.
However, not all metrics are recorded for queries against Memory-Optimized tables:
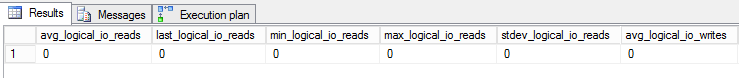
Basically every runtime metric that involves logical or physical IO and query memory usage will remain ‘0’ for queries accessing Memory-Optimized tables.
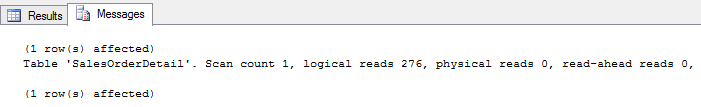
The reason for this is that, because Memory-Optimized tables function so differently to traditional disk-based tables, no IO or memory grant information is recorded by the query execution engine. We can test this ourselves easily by enabling the IO statistics before we execute a query:
|
1 2 3 4 5 6 7 8 9 10 11 12 |
SET STATISTICS IO ON -- Query disk-based table SELECT * FROM Sales.SalesOrderDetail WHERE SalesOrderDetailID = 121115 -- Query Memory-Optimized table SELECT * FROM Sales.SalesOrderDetail_InMemory WHERE SalesOrderDetailID = 121115 SET STATISTICS IO OFF |
If we switch to the message tab to take a look at the IO statistics, you can see only the query against the disk-based table returns them.
Even though there is only limited runtime statistics data inside the Query Store for queries against Memory-Optimized tables, we still get information about the duration, CPU time, degree of parallelism and the rows returned. This also has an impact on the Query Store reports. For instance, if you were to select top 25 queries based on CPU time in your Query Store report, queries against Memory-Optimized tables are included. If you were to change it to top 25 queries based on logical reads, queries against Memory-Optimized tables are not returned.
Natively Compiled Stored Procedures
Now that we have seen how regular queries against Memory-Optimized tables return (limited) runtime statistics through the Query Store, let’s take a look at how natively-compiled stored procedures behave.
Using the script below, I created a natively compiled stored procedure named sp_SalesbyProduct_InMemory that selects rows based on the ProductID in the Memory-Optimized table. Notice that the CREATE PROCEDURE parameters change a bit when natively compiled stored procedures are concerned. These extra parameters are required, and indicate that this stored procedure is a natively compiled one.
|
1 2 3 4 5 6 7 8 9 10 11 12 13 14 15 16 17 18 |
CREATE PROCEDURE [dbo].[sp_SalesbyProduct_InMemory] @ProductID INT WITH NATIVE_COMPILATION, SCHEMABINDING AS BEGIN ATOMIC WITH ( TRANSACTION ISOLATION LEVEL = SNAPSHOT, LANGUAGE = N'English' ) SELECT SalesOrderID, OrderQty, UnitPrice FROM Sales.SalesOrderDetail_InMemory WHERE ProductID = @ProductID; END GO |
Now that we have a natively compiled stored procedure, let’s run it:
|
1 |
EXEC sp_SalesbyProduct_InMemory @ProductID = 878 |
We have executed the natively stored procedure, so we can now see what information the Query Store recorded for its execution. To do this I ran the query below that retrieves some information from various Query Store DMVs based on the object ID of our natively stored procedure:
|
1 2 3 4 5 6 7 8 9 10 11 12 13 |
SELECT qsp.plan_id, qsp.query_id, CAST(qsp.query_plan AS XML), qsp.is_trivial_plan, qsp.is_natively_compiled, qsq.last_execution_time, qsp.initial_compile_start_time, qsp.last_compile_start_time FROM sys.query_store_plan qsp INNER JOIN sys.query_store_query qsq ON qsp.query_id = qsq.query_id WHERE qsq.[object_id] = OBJECT_ID('sp_SalesbyProduct_InMemory') |
As you can see in the image below, the Query Store does record the execution plan and various other metrics related to either the query or the plan.

I would like to point out two specific columns you can see in the image above: Notice the is_natively_compiled column. This is a means to identify natively-compiled stored procedures. The other column is the last_execution_time column; notice it is NULL. This value is rather confusing, how can the last execution plan be NULL, considering that we just executed the stored procedure and it is clearly recorded in the Query Store? Let’s see if we can find out some more information about this behavior.
The query below retrieves the runtime statistics from the Query Store based on the plan ID. In this case our natively-compiled stored procedure received a plan id of ‘4’.
|
1 2 3 4 |
SELECT * FROM sys.query_store_runtime_stats WHERE plan_id = 4 |
Interestingly enough, no runtime statistics are returned for our natively stored procedure. As it turns out, we need to specifically enable the collection of statistics for natively compiled stored procedures through the sp_xtp_control_query_exec_stats stored procedure. Keep in mind, though, that enabling the collection of statistics for natively-compiled stored procedure can cause performance degradation. Thankfully we can very easily control the collection of statistics by enabling it for only specific natively compiled stored procedures and turn it on and off directly.
Let’s turn on the statistics collection for just our test natively compiled stored procedure using the query below.
|
1 2 3 4 5 6 |
DECLARE @dbid INT = DB_ID('AdventureWorks') DECLARE @procid INT = OBJECT_ID('sp_SalesbyProduct_InMemory') EXEC sp_xtp_control_query_exec_stats @new_collection_value = 1, @database_id = @dbid, @xtp_object_id = @procid |
Now, we will run our natively compiled stored procedure again, and look at the information in the Query Store DMVs.
|
1 2 3 4 5 6 7 8 9 10 11 12 13 14 15 16 |
-- Run the stored procedure again EXEC sp_SalesbyProduct_InMemory @ProductID = 878 -- Grab Query Store information SELECT qsp.plan_id, qsp.query_id, CAST(qsp.query_plan AS XML), qsp.is_trivial_plan, qsp.is_natively_compiled, qsq.last_execution_time, qsp.initial_compile_start_time, qsp.last_compile_start_time FROM sys.query_store_plan qsp INNER JOIN sys.query_store_query qsq ON qsp.query_id = qsq.query_id WHERE qsq.[object_id] = OBJECT_ID('sp_SalesbyProduct_InMemory') |
If we look at the results of the last query we notice a change in the last_execution_time column:

Apparently it registered the execution this time!
Let’s look at the runtime statistics again:
|
1 2 3 4 |
SELECT * FROM sys.query_store_runtime_stats WHERE plan_id = 4 |

There they are! After enabling the collection of statistics for our test natively compiled stored procedure the runtime statistics are saved inside the Query Store! Keep in mind though, just like regular queries against Memory-Optimized tables, IO and memory statistics are not captured when running natively compiled stored procedures. And don’t forget that enabling the collection of statistics for natively compiled stored procedures can negatively impact their performance.
Summary
When you have the Query Store enabled on databases that use In-Memory OLTP features like Memory-Optimized tables and natively compiled stored procedures, query and plan information is captured automatically. For normal queries runtime statistics are also automatically captured but when you are using natively compiled stored procedures we have to explicitly enable the collection of runtime statistics. Not everything is captured for either queries that run against Memory-Optimized tables or for natively compiled stored procedures. Runtime statistics regarding IO and memory consumption will remain in the runtime statistics DMVs and Query Store reports.