The series so far:
- Power BI Introduction: Tour of Power BI — Part 1
- Power BI Introduction: Working with Power BI Desktop — Part 2
- Power BI Introduction: Working with R Scripts in Power BI Desktop — Part 3
- Power BI Introduction: Working with Parameters in Power BI Desktop — Part 4
- Power BI Introduction: Working with SQL Server data in Power BI Desktop — Part 5
- Power BI Introduction: Power Query M Formula Language in Power BI Desktop — Part 6
- Power BI Introduction: Building Reports in Power BI Desktop — Part 7
- Power BI Introduction: Publishing Reports to the Power BI Service — Part 8
- Power BI Introduction: Visualizing SQL Server Audit Data — Part 9
Power BI Desktop plays a pivotal role in the Power BI suite of tools, which is why it’s been the focus of much of this series. If you’ve been following along, you learned how to import and transform data, build reports and visualizations, incorporate R scripts, navigate the Power Query M formula language, and perform a variety of other tasks.
Although there is still much more you can do in Power BI Desktop, the ultimate goal is always the same—to build visually rich reports that provide stakeholders with actionable insights into the underlying data.
But building reports is only part of the equation. You must also make these reports available to the people who depend on the information they provide. For this, you need to publish the reports to the Power BI service or save them to Power BI Report Server (if you have a Power BI Premium subscription). Although you can share Power BI Desktop .pbix files with other users, this is not nearly as effective as disseminating the reports through one of the appropriate channels.
In this article, you’ll learn how to publish a report to the Power BI service and work with the published report through the Power BI interface. The article steps you through such tasks as viewing and updating the report, saving report components to a dashboard, and creating a new report based on the published dataset. You’ll also learn how you can update the report in Power BI Desktop and then republish it to the Power BI service.
Publishing to the Power BI Service
The examples in this article are based on the report file created in the previous article in this series, Building Reports in Power BI Desktop — Part 7. On my system, I named the report SalesRepOrders, which is the name used in the examples to follow. Figure 1 shows the report’s Matrix visual page as it appears in Report view. The report is made up of five pages, with visuals on each page.
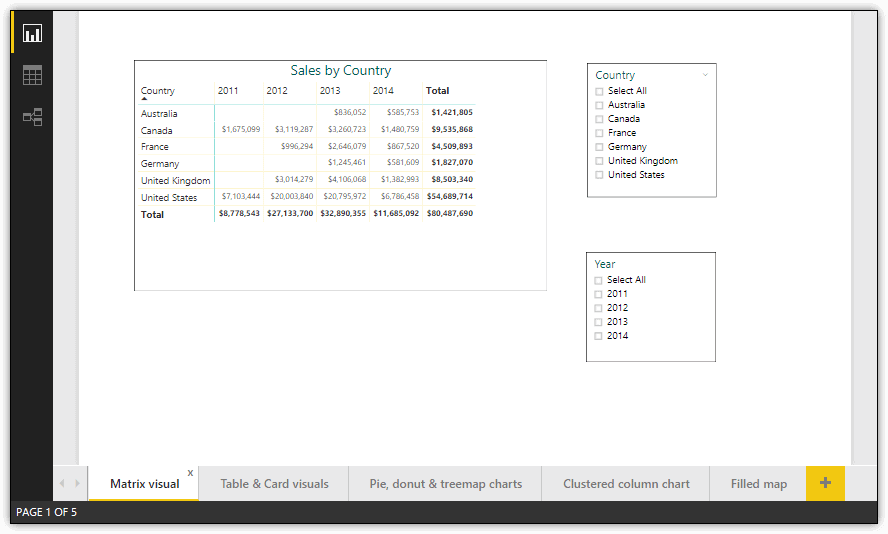
Figure 1. Viewing the SalesRepOrders report in Power BI Desktop
NOTE: To make it easier to follow along with this article, rename your visuals to match Figure 1 if you didn’t name them when creating the report in the previous article.
To publish the SalesRepOrders report to Power BI, go to the File tab, point to Publish, and click Publish to Power BI. If you’re not already signed into the Power BI service, you’ll be prompted to provide your login credentials. Once you’re connected, you’ll then be prompted to choose a destination. Select the My workspace option if it is not selected, and then click Select, as shown in Figure 2.
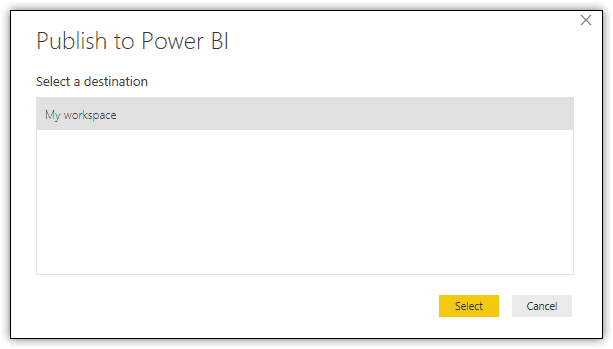
Figure 2. Publishing the SalesRepOrders report to My workspace
After you select a destination, the Publishing to Power BI dialog box will appear showing the publishing status. Ultimately, you should receive a Success! message, preceded by a green checkmark, as shown in Figure 3. The dialog box also displays a Do You Know? message that provides a tip about using the Power BI service.
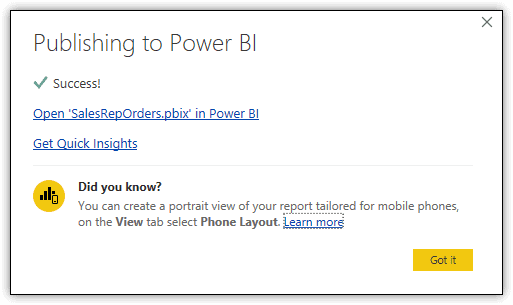
Figure 3. Verifying publication of the SalesRepOrders report
If you want to access the published report immediately, click the link Open ‘SalesRepOrders.pbix’ in Power BI. This will launch the Power BI service in your system’s default browser. You might again be prompted for login credentials.
If you want to go to the Power BI site and automatically generate insights in the process, click the second link, Get Quick Insights. Insights are interactive visualizations that Power BI generates on demand. I’ve had mixed success when using this link.
If you don’t want to connect to the Power BI service at this time, click the Got it button to close the dialog box.
Working with Reports in Power BI
You can access your published report through the Power BI site from any supported browser. For example, I’ve been able to access the site from Chrome and Edge in Windows and from Chrome and Safari in macOS. When you sign in, you’re taken to a development interface that provides the tools necessary to import and visualize data. Figure 4 shows the interface after publishing the SalesRepOrders report file.
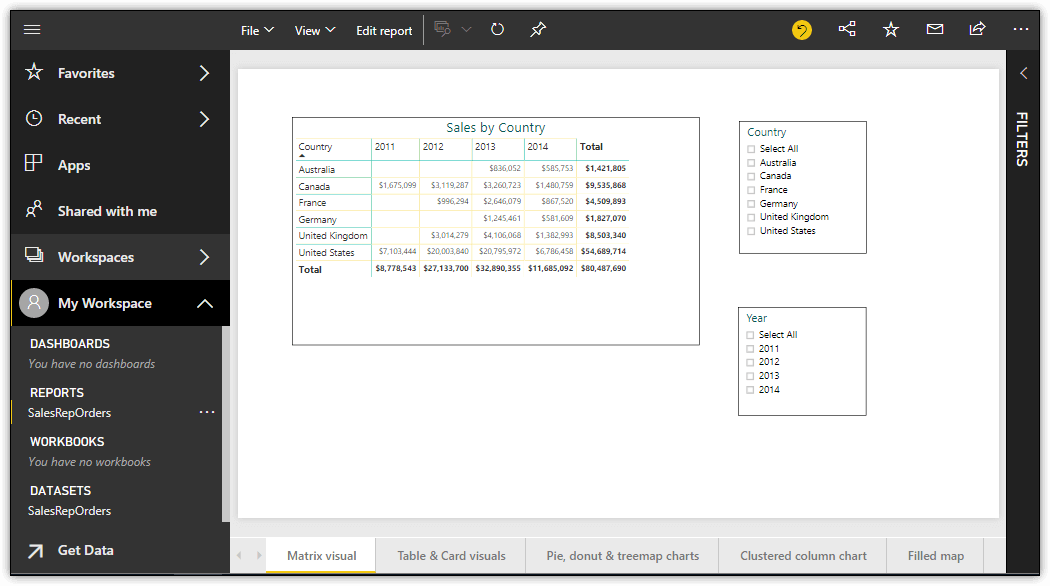
Figure 4. Viewing the SalesRepOrders report in the Power BI service
The SalesRepOrders report and dataset are listed in the My Workspace section in the left pane. (You might have to expand this section after signing into the service.) The My Workspace section is your personal work area for accessing and modifying your own dashboards, reports, and datasets.
From the My Workspace section, you can access resources in any of the following four categories:
- Dashboards: Canvases for presenting data through tiles or widgets. A dashboard can be associated with only one workspace, but it can display visualizations from multiple datasets or reports. If you’re a Power BI Pro or Premium subscriber, you can also share dashboards.
- Reports: Collections of visualizations based on data in the defined datasets. A report can be associated with only one workspace, but it can be associated with multiple dashboards within that workspace. You can interact with a report either in Reading view or Editing view, depending on your granted level of permissions. Each report is made up of one or more pages.
- Workbooks: Special types of datasets created by uploading Microsoft Excel files to the Power BI service. You can upload an Excel file from within the Power BI service or by publishing the file directly from Excel. The workbook data requires no special formatting. This is different from importing an Excel file, which adds the dataset to the Datasets category. To import an Excel file, the data within the file must be formatted as an Excel table.
- Datasets: Collections of related data that you import or connect to. A dataset is similar to a database table and can be used in multiple reports, dashboards, and workspaces. You can retrieve data from files, databases, online services, or Power BI apps published by other people in your organization.
In Figure 4, the SalesRepOrders report in the Reports section is selected, with the report contents displayed in the main window. In this case, the Matrix visual page is selected, but you can choose any of the other pages to view those visuals, just like you saw in Power BI Desktop.
From the main Reports window, you can carry out several operations, such as saving a copy of the report, refreshing the data, sharing the report, or pinning the page to a dashboard which is covered later in the article.
By default, Power BI displays the report in Reading view. If you have the proper permissions, you can also work with the report in Editing view. To get into Editing view, click the Edit report button at the top of the window. This allows you to modify the report and visualizations directly within the Power BI interface.
Updating a visualization in the Power BI service is much like updating a visualization in Power BI Desktop, as shown in Figure 5. Notice that Editing view includes both the Visualizations pane and Fields pane.
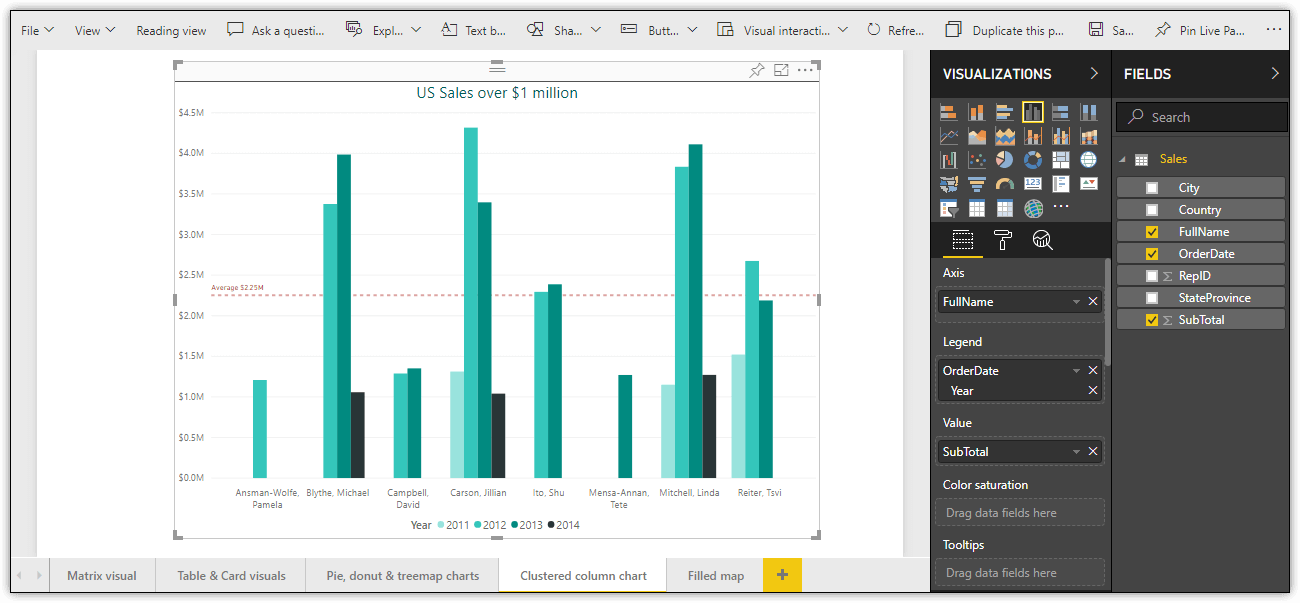
Figure 5. Editing the SalesRepOrders report in the Power BI service
A simple way to test the editing features is to update the report’s Clustered column chart visual to display sales greater than $2 million, rather than $1 million. To update the visual, first make sure you have selected it and then expand the SubTotal column in the Filters section of the Visualizations pane, change the 1000000 value to 2000000, and click Apply filter.
You can then save the report under the same name or save it to a different name using the options available to the File menu at the top of the design surface. (On my system, I saved the report to a different name so the original report remained unchanged.)
In addition to updating the visualizations, you can also modify the report itself. For example, you can insert a shape, button, text box, or Ask a question section. You’ll find the tools for making these changes at the top of the design surface.
Updating and Republishing Reports
Rather than updating reports directly within the Power BI service, you might prefer to modify them in Power BI Desktop and then republish them to the Power BI service. For example, suppose you want update the SalesRepOrders report by adding drillthrough filters to the Matrix visual, using the Country and FullName columns for the filters, as shown in Figure 6.
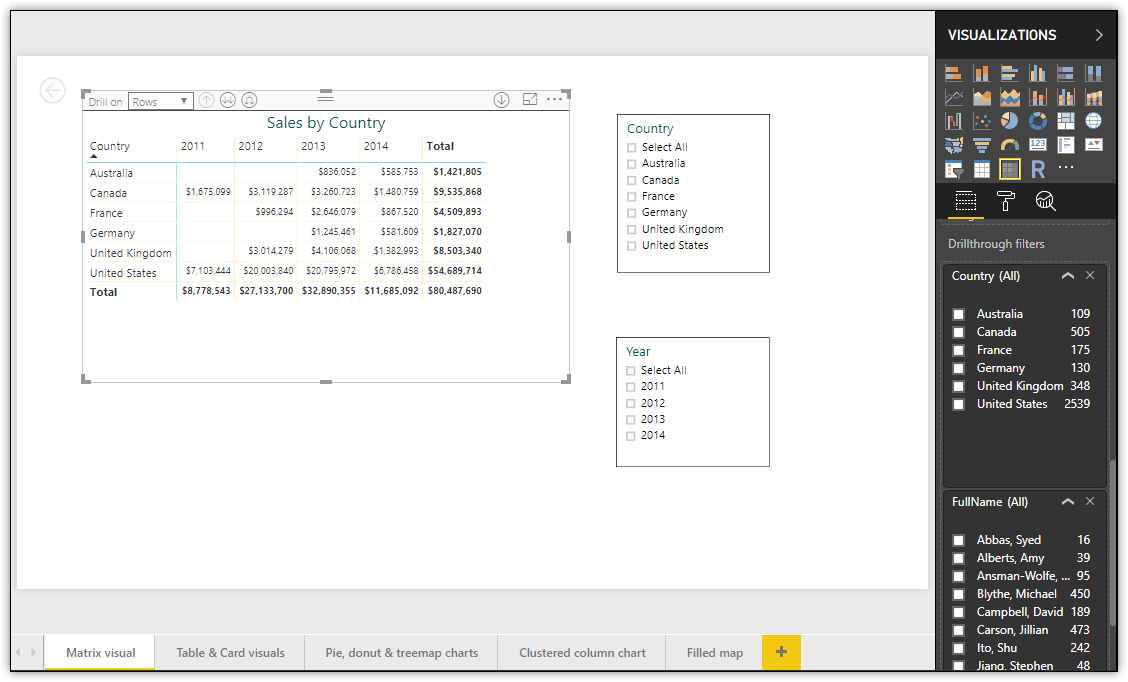
Figure 6. Updating the Matrix visual in Power BI Desktop
To add the drillthrough filters, select the Matrix visual and then drag the Country column from the Fields pane to the Drillthrough section of the Visualizations pane. Next, drag the FullName column to the Drillthrough section, just below the Country column.
Drillthrough filters make it possible for users to access one report based on values in another report. Because the Country and FullName columns have been added as drillthrough filters for the Matrix visual, users will be able to access the visual directly from other visuals that include Country or FullName values. Power BI automatically filters the Matrix visual by the selected country or sales rep name. (You’ll see this in action in just a bit.)
After you’ve updated and saved the report in Power BI Desktop, you can publish it to the Power BI service just like you did before, except that you’ll be prompted to verify that you’re replacing the existing dataset, as shown in Figure 7. To confirm the update, click Replace.
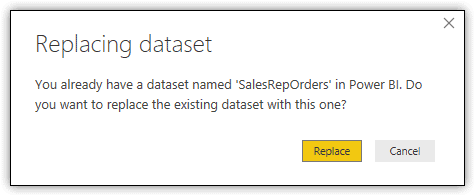
Figure 7. Republishing the SalesRepOrders report to the Power BI service
Although the wording of the Replacing dataset dialog box is specific to the SalesRepOrders dataset, the report itself is also updated in the Power BI service. You can verify this by returning to the Power BI service and viewing the Matrix report, which should now look similar to the one shown in Figure 8. (You might have to refresh the web page.) Notice that the Drillthrough section of the Filters tab now lists the Country and FullName columns as drillthrough filters.
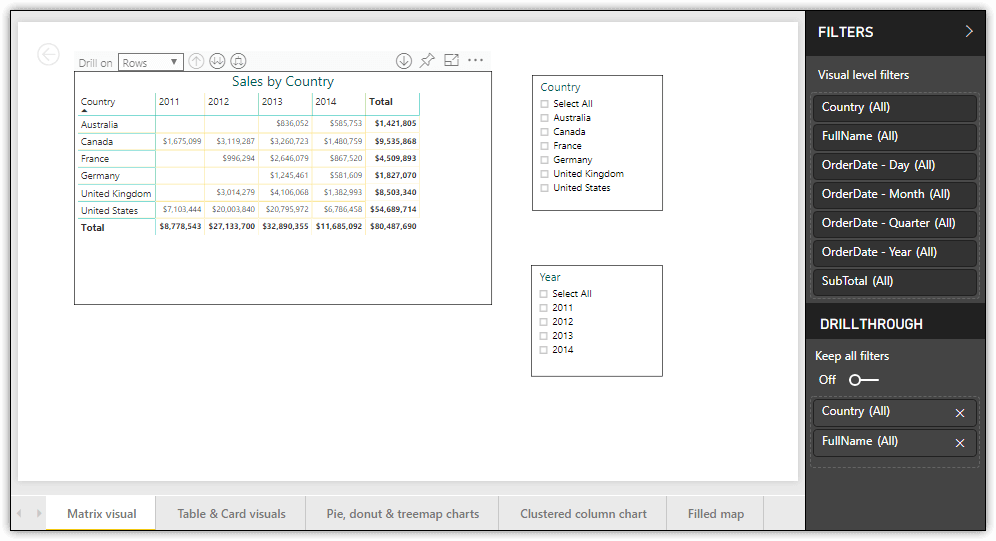
Figure 8. Viewing the updated report in Power BI
To test the drillthrough feature, go to the Pie, donut and treemap chart page, right-click the Canada section on the Pie chart visual, point to Drillthrough, and then click Matrix visual, as shown in Figure 9.
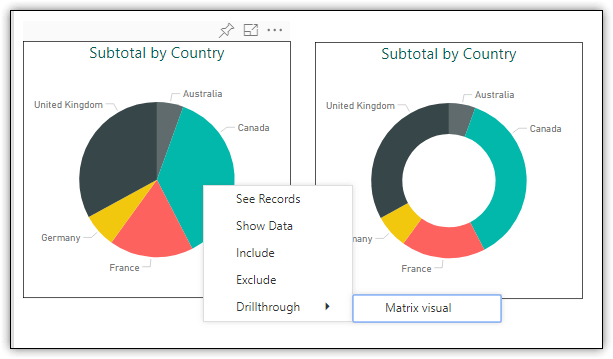
Figure 9. Drilling through to the Matrix visual in Power BI
When you click the Matrix visual option, Power BI takes you to the Matrix visual page, with the data filtered by Canada, as shown in Figure 10. Notice that Canada is also the only country listed in the Country slicer.
NOTE: If your Matrix Visual report shows quarters and/or months, select Columns from the Drill on list and click the up arrow. You may also need to remove the Year filter.
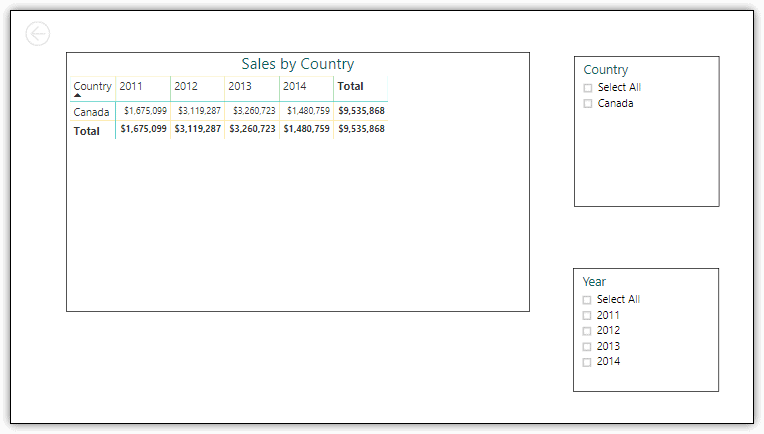
Figure 10. Viewing Canadian sales in the Matrix visual
Next, you’ll test drilling through to the Matrix visual from a sales rep value. First, you must clear the drillthrough filter on the Matrix visual. To do so, make sure the Matrix visual is still selected, expand the Country column in the Drillthrough section of the Filters tab, and then clear the Canada checkbox. Next, go to the Clustered column chart page. On the visual, right-click the 2012 bar for Jillian Carson, point to Drillthrough, and then click Matrix visual.
When the Matrix visual appears, the matrix will include only a row for the United States, the country where Jillian Carson resides. Click the double down-arrow button with the pop-up label that reads Go to the next level in the hierarchy. Jillian Carson’s sales data should now be displayed in the Matrix visual, as shown in Figure 11.
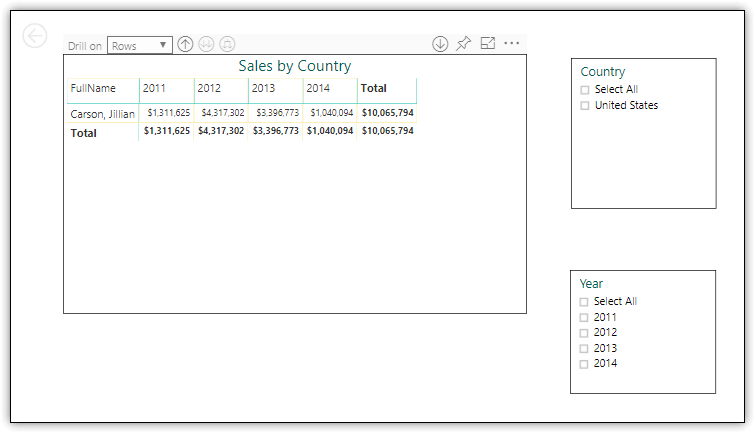
Figure 11. Viewing sales rep data in the Matrix visual
When you accessed the Matrix visual from the Clustered column chart visual, Power BI retained all sales data for Jillian Carson, even though you clicked the 2012 bar. However, you can limit the data to the year as well when accessing the Matrix visual through a drillthrough filter.
To demonstrate how this works, ensure that the Matrix visual is selected and then, in the Drillthrough section of the Filters tab, enable the Keep all filters option. Next, go to the Clustered column chart visual and again use the drillthrough feature to access the Matrix visual. This time, only the data for year 2012 is displayed, as shown in Figure 12.
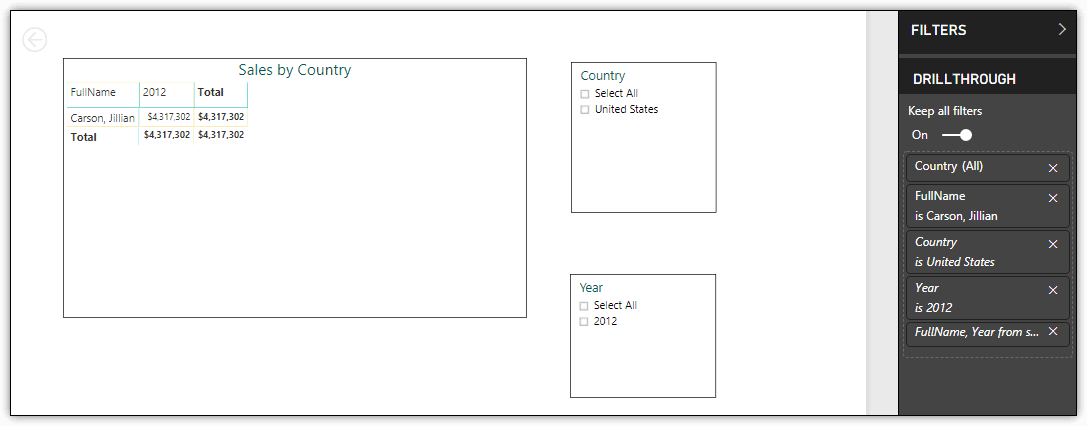
Figure 12. Retaining filters when drilling through to a visual
As you can see, the Matrix visual and Year slicer now include only the year 2012. Not only does this demonstrate how the drillthrough capabilities work in Power BI, but also how you can update a visual in Power BI Desktop and republish the report file to the Power BI service, without having to take any steps within the Power BI service.
Pinning Reports to a Dashboard
When you publish a report file to the Power BI service, only the report and its datasets are added to the service. If you want to include report components on a dashboard, you must specifically pin them to the dashboard.
You can pin report items on a page-by-page basis directly within the report. For example, to add the Clustered column chart page to a dashboard, go to that page and click the Pin Live Page button at the top design surface. When the Pin to dashboard dialog box appears, you can choose to add the page to an existing dashboard or to create a new dashboard, as shown in Figure 13.
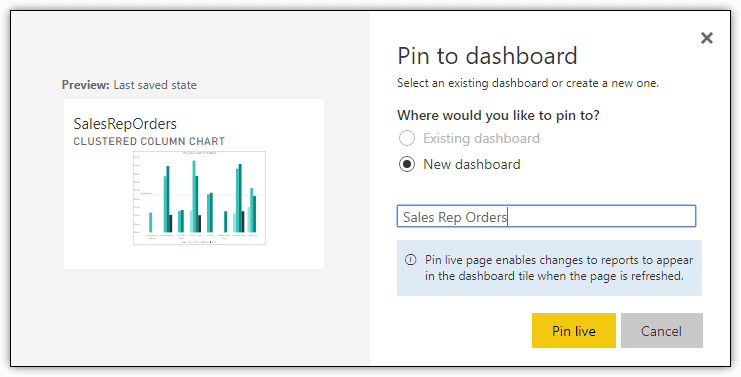
Figure 13. Pinning a report page to a new dashboard
If you choose the Existing dashboard option, you must then select the dashboard from a drop-down list. If choose the New dashboard option, you must provide a name for that dashboard. In Figure 13, a dashboard named Sales Rep Orders will be created.
After you select the dashboard or type the new name, click Pin live. When the Pinned to dashboard dialog box appears, click Go to dashboard, as shown in Figure 14. Later you’ll see how you can set up your dashboard for a smartphone as well as a web page.
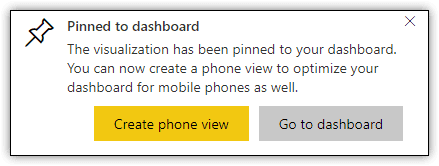
Figure 14. Creating a phone app version for the dashboard
By default, Power BI displays the dashboard in Web view, as shown in Figure 15. The report page is added as a tile to the dashboard. You can resize or reposition the tile, edit details about the tile, and carry out other steps.
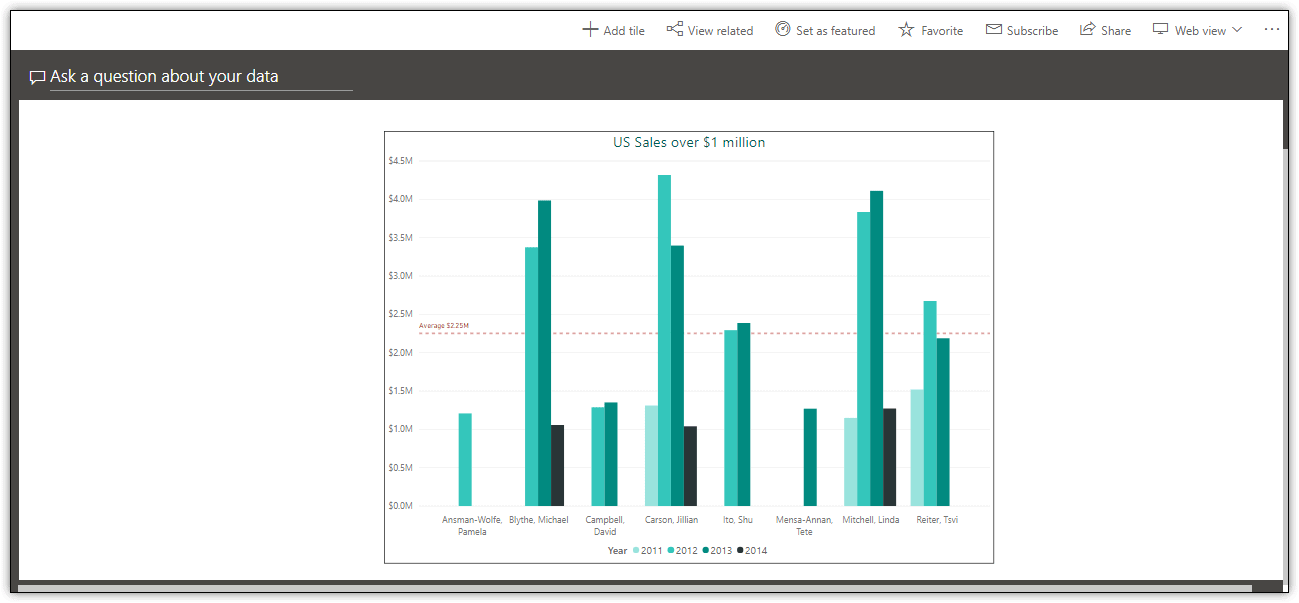
Figure 15. Viewing the Bar Chart visual in web view
You can also make changes to the dashboard itself. For example, you can apply a different theme, refresh the tiles, or remove the Ask a question section. You can also switch to Phone view.
Phone view provides an approximation of what your dashboard will look like on a smartphone. To go to Phone view, click the Web view down arrow and then select Phone view. When you first select Phone view, you’ll receive a message about viewing the tiles as they appear on a phone. Simply click Continue. You’ll then be taken to Phone view, as shown in Figure 16.
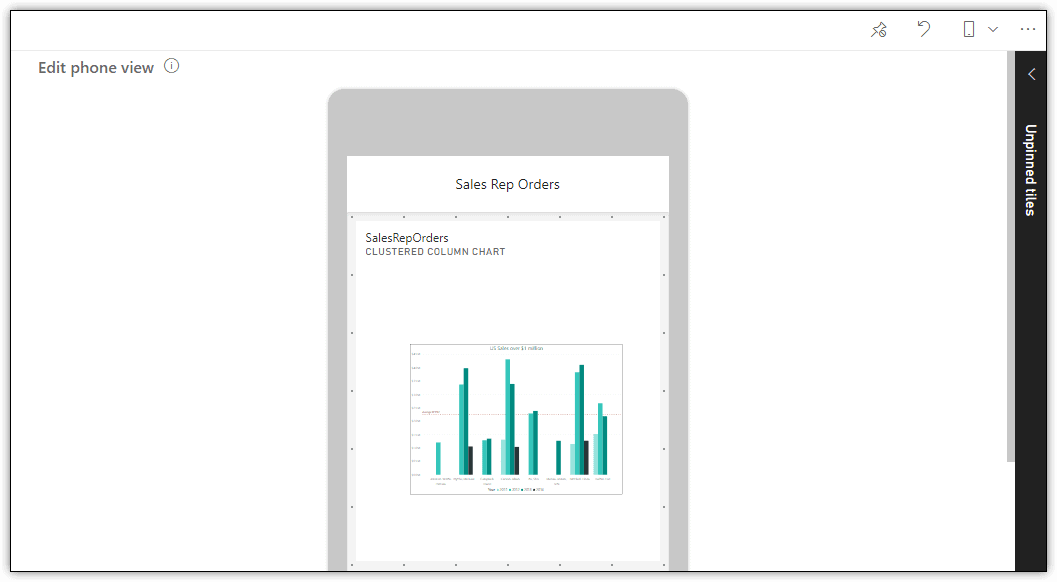
Figure 16. Viewing the Bar Chart visual in phone view
In Phone view, you can resize and reset tiles, but you can do little else. Even so, it should give you a good sense of how the dashboard will look on a smartphone. You can also view the dashboard in the Power BI app on a mobile device. For example, Figure 17 shows the Clustered column chart tile of the Sales Rep Orders dashboard on an iPhone.
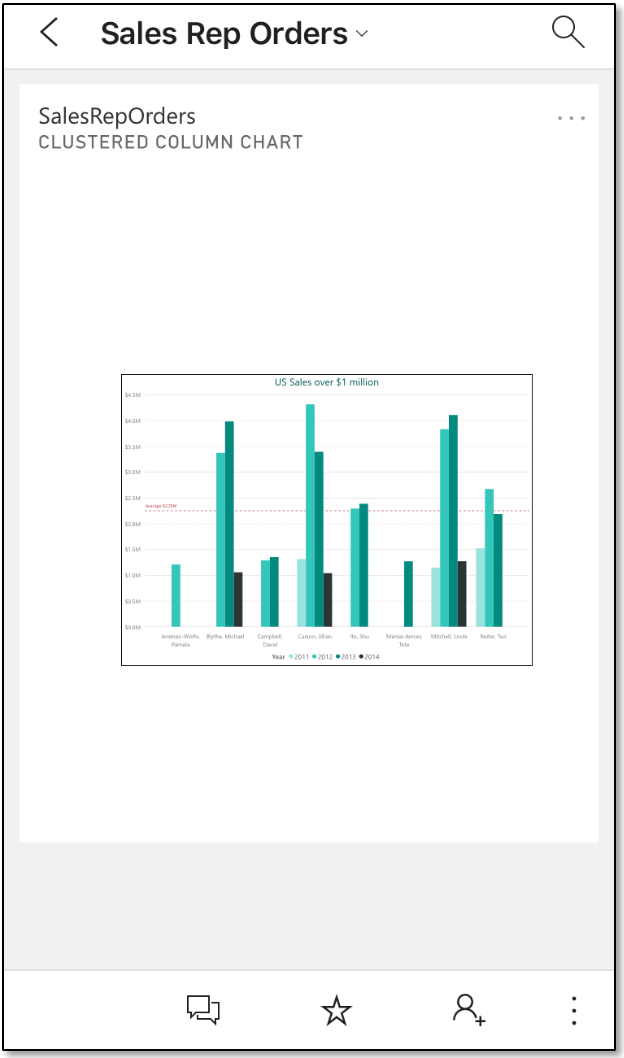
Figure 17. Viewing the dashboard report on an iPhone
There is, of course, a lot more you can do with the report and dashboard features in the Power BI service than what’s been covered here. I encourage you to play around with the individual features as much as possible. The more time you spend with them, the better you’ll be able to leverage their capabilities to effectively visualize data.
Creating Reports from a Dataset
In Power BI, you can also work directly with the datasets that you publish to the Power BI service. To access the SalesRepOrders dataset, select it in the Datasets category of the My Workspace section in the left pane. This will take you to a workspace similar to Report view in Power BI Desktop, where you can create a report and add pages and visualizations. For example, Figure 18 shows a Bar chart visual that I created based on the SalesRepOrders dataset
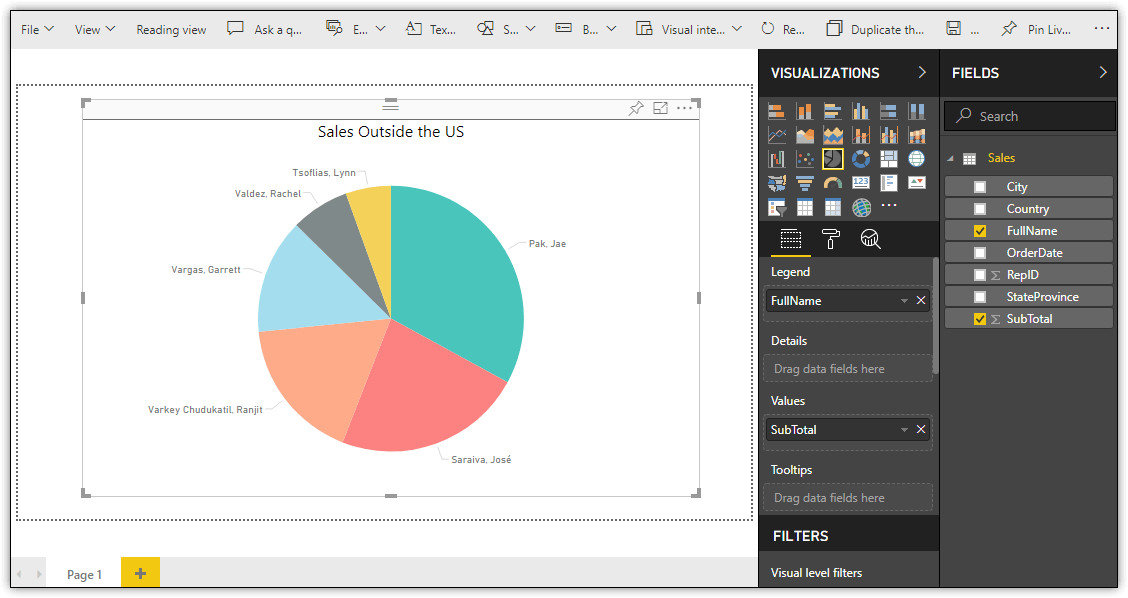
Figure 18. Creating a Bar chart visual based on the SalesRepOrders dataset
After you add the necessary pages and visualizations, you can save the report to the Power BI service, using the options available in the File menu. You can then access the report from the Reports category in the My Workspace section, just like the SalesRepOrders report.
For this example, I saved the report shown in Figure 18 as SalesOutsideUS. I then accessed the report from the Reports category, as shown in Figure 19. When you create a report in this way, you can pin the report pages to a dashboard, along with pages from other reports.
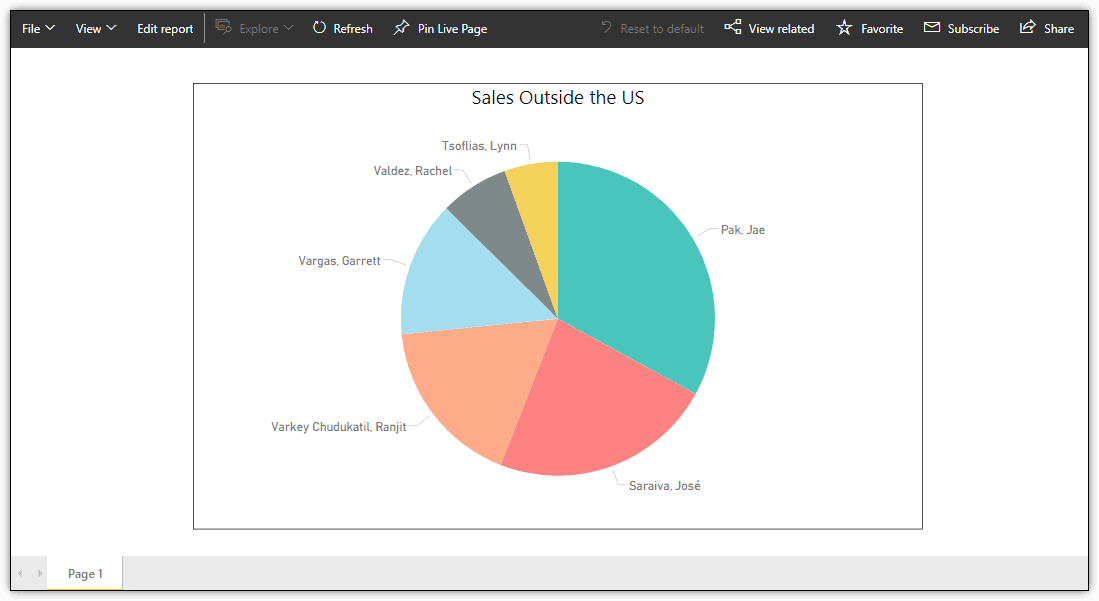
Figure 19. Viewing the SalesOutsideUS report in the Power BI interface
Being able to create reports directly from a published dataset provides you with even greater flexibility when working with the Power BI service. This can be especially beneficial when collaborating with other users to build reports and visualizations for your organization and other stakeholders.
Moving Beyond the Power BI Basic Service
The features covered in this article are all available as part of the Power BI Free service level. To use such features as sharing, collaboration, auditing, and auto-refresh, you (or your organization) must sign up for the Power BI Pro service. If your organization requires dedicated resources for deploying Power BI at scale, you’ll need a Power BI Premium subscription.
Even at the Free service level, you can learn a lot about Power BI and its capabilities, especially when used in conjunction with Power BI Desktop. But Power BI is not just about the service and desktop application. The Power BI suite also includes the Power BI mobile apps, Power BI Report Server, and the Power BI API, with the promise of more components to come.
Microsoft also positions Power BI as part of something much larger called the Microsoft Power Platform (or Business Application Platform or whatever happens to be Microsoft’s branding de jour). Not only does the platform include Power BI, but also PowerApps, Microsoft Flow, and perhaps Microsoft Stream, although it’s not clear exactly which components are included or how they fit together. Even so, Power BI is a force to be reckoned with in its own right, and I suspect we’ll be hearing a lot more about Power BI in the days to come.
Load comments