
When I look back over my career as a SQL Server DBA, analyzing the kinds of issues that I have had to resolve, usually under pressure, nothing brings me out in a colder sweat than the runaway data, log or TempDB file. I would estimate that for every time I’ve had to deal with an emergency restore, including point in time restores using transaction log backups, I’ve probably had to deal with a hundred disk capacity issues. Overall, I would estimate that such issues account for around 80% of the problems that a DBA team faces on a weekly basis.
Occasionally, the cause of these space issues is just poor capacity planning. In other words, the growth in file size was entirely predictable, but someone failed to plan for it. Predictable growth patterns are something that should be analyzed right at the start, preferably before SQL Server is even installed. In my experience, though, these space issues are often caused by bugs, or failure to adhere to best practices.
In this article, I’ll delve into the most common causes of space management issues, covering model database configuration, inefficient bulk modifications, indexes and TempDB abuse, and how to fix them. I will finish the article by describing a query that you should store securely in your the SQL Server tacklebox, SizeQuery. I use this query on more or less a daily basis to monitor and track space utilization on my SQL Server instances. Used in conjunction with the DBA repository to query multiple SQL Servers, it has proved to be an invaluable reporting tool.
I have given a name to the time in the morning at which a DBA typically staggers in to work, bleary eyed, having spent most of the previous night shrinking log files and scouring disks for every precious Gigabyte of data, in order to find enough space to clear an alert. That name is DBA:M (pronounced D-BAM), and it’s usually around 9.30AM. My main goal with this article is to help fellow DBAs avoid that DBA:M feeling.
Common causes of space issues
The following issues are among the most-common of DB space-related sorrow:
- Poorly configured Model database – meaning that subsequent databases adopt properties (AutoGrowth, Recovery Model and so on) that are inappropriate for their intended use.
- Inefficient Delete, Insert or Bulk Insert statements – such processes, plus those that create temp tables, can very quickly fill the log file with unnecessary data. The situation is exacerbated by incorrect Model database configuration.
- Indexes and large row counts – clustered indexes can take up a lot of space for tables that contain millions of rows of data. However, you simply need to plan for this because the consequences of not having these indexes can severely impact performance.
- Blatant misuse of TempDB – Temporary tables often play an important role when developers are tasked with comparing millions of rows of data, to return a small subset of results. This practice can have unwanted consequences, such as inadvertently filling the TempDB database. It is our job, as DBAs, to make sure this does not happen, often by performing a code review and offering an alternate solution.
Over the coming sections, I am going to delve into each of these issues, and discuss the techniques I have used to analyze and fix each one, where possible. I say “where possible” because sometimes data growth really does exceed all expectation and confound even the most rigorous capacity planning. The only course of action, in such cases, is to expand disks or add additional SAN space, things only peripherally known to many DBAs.
I want to stress that this article is not going to shine a light on SQL Server internals. I will not be taking you on a journey to the heart of the database engine to explore the esoteric concepts of leaf level storage. Every DBA needs to understand where and how objects, such as tables and indexes, use up space on your servers, and be very familiar with core concepts such as pages, extents, fill factors, as well as internal and external fragmentation. However, I will leave those details to Books Online. Here, I intend to drive the All Terrain Vehicle of my experience right to the source of the space allocation issues that wreak havoc on the waking and sleeping life of the on-call DBA.
Being a model DBA
This article is about space utilization in SQL Server and there is no better place to begin than with the Model database. The first thing I will say about the Model database is that, if it were up to me, I would rename it. Out of the box, there is nothing “model” about it; it is not a “model” citizen nor should it be considered a “role model” for other databases. Nevertheless, it is the template upon which all subsequent databases are based, including TempDB. In other words, new databases created on the server, unless otherwise specified, will inherit the configuration settings of the model database.
The full list of options for the Model database, including their default settings, can be found at http://technet.microsoft.com/en-us/library/ms186388.aspx. The defaults for most of the options are fine for most databases. Most significantly, however, the model database settings determine the following:
- Autogrowth properties for the data and log files
- Recovery model for the database
The default settings for each of these are definitely not appropriate for all databases, and it’s easy for new DBAs, or even us old haggard DBAs, to forget to check these settings especially where we’re working with a server configured by a previous DBA.
Beware of default autogrowth and recovery
By default, the data file (modeldev) for the Model database, for both SQL Server 2005 and 2008 will be roughly 3MB in size initially, and is set to autogrow in 1 MB (1024 K) increments, unrestricted, until the disk is full. The log file is set at an initial size of 2MB and is set to grow in 10% increments, again until the disk is full. These settings are shown in Figure 1.
Note: Microsoft SQL Server 2008 Books Online states: “The sizes of these files can vary slightly for different editions of SQL Server.” I am using Standard Edition for the examples in this article.
In SQL Server storage terms, 1024K is 128 pages; pages are stored in 8K blocks. For applications that are going to potentially load millions of records, growing the data file of a database every 128 pages incurs a large performance hit, given that one of the major bottlenecks of SQL Server is I/O requests.
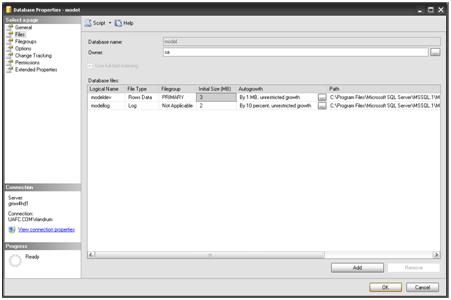
Figure 1: Initial sizes and growth characteristics for the model database data and log files.
Rather than accept these defaults, it is a much better practice to size the data file appropriately at the outset, at say 2G. The same advice applies for the log file. Generally, growth based on a percentage is fine until the file reaches a threshold where the next growth will consume the entire disk. Let’s say you had a 40G log file on a 50G drive. It would only take two 10% growths to fill the disk, and then the alerts go out and you must awake, bleary-eyed, to shrink log files and curse the Model database.
Coupled with the previously-described file growth characteristics, our databases will also inherit from the default model database a recovery model of Full. Transactions in the log file for a Full recovery database are only ever removed from the log upon a transaction log backup. This is wonderful for providing point in time recovery for business critical applications that require Service Level Agreements (SLAs), but it does mean that if you do not backup the transaction log, you run the risk of eventually filling up your log drive.
If you have a database that is subject to hefty and /or regular (e.g. daily) bulk insert operations, and you are forcing the data file to be incremented in size regularly, by small amounts, then it’s likely that the performance hit will be significant. It is also likely that the size of your log file will increase rapidly, unless you are performing regular transaction log backups.
To find out how significant an impact this can have, let’s take a look at an example. I’ll create a database called All_Books_Ever_Read, based on a default model database, and then load several million rows of data into a table in that database, while monitoring file growth and disk I/O activity, using Profiler and PerfMon, respectively. Loading this amount of data may sound like an extreme case, but it’s actually “small fry” compared to many enterprise companies, that accumulate, dispense and disperse Terabytes of data.
Note: I just happen to own a file, Books-List.txt, that allegedly contains a listing of all books ever read by everyone on the planet Earth, which I’ll use to fill the table. Surprisingly the file is only 33 MB. People are just not reading much any more.
The first step is to create the All_Books_Ever_Read database. The initial sizes of the data and log files, and their growth characteristics, will be inherited from the Model database, as described in Figure 1. Once I’ve created the database, I can verify the initial data (mdf) and log file (ldf) sizes are around 3 and 2 MB respectively, as shown in Figure 2.
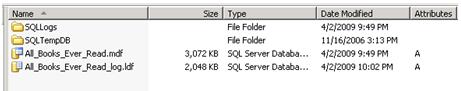
Figure 2: Data and log files sizes prior to data load.
The next step is to back up the database. It’s important to realize that, until I have performed a full database backup, the log file will not act like a typical log file in a database set to Full recovery mode. In fact, when there is no full backup of the database, it is not even possible to perform a transaction log backup at this point, as demonstrated in Figure 3.
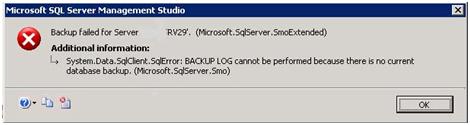
Figure 3: Can’t backup log if no full database backup exists.
Until the first full backup of the database is performed, this database is acting as if it is in Simple recovery mode and the transaction log will get regularly truncated at checkpoints, so you will not see the full impact of the data load on the size of the log file.
With the database backed up, I need to set up Profiler and PerfMon so that I can monitor the data load. To monitor auto growth behavior using Profiler, simply start it up, connect to the SQL Server 2008 instance that holds the All_Books_Ever_Read database, and then set up a trace to monitor Data and Log file Auto Grow events, as shown in Figure 4.
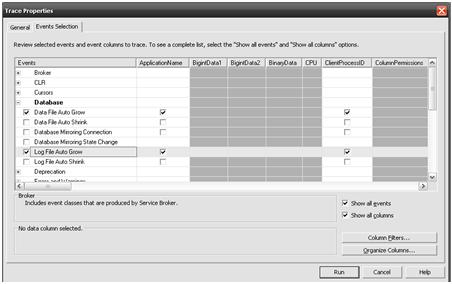
Figure 4: Setting SQL Server Profiler to capture data and log file growth.
All you have to do then is click “Run”.
Next, I’ll set up Perfmon (Administrative Tools | Performance) in order to monitor disk I/O activity. Click on the “+” button in the toolbar of the graph; Perfmon will connect to the local server by default. Select “Physical Disk” as the performance object, as shown in Figure 5, and then select “% Disk Time” as the counter and click” Add”.
Next, change to the Physical Disk object and select the “Average Disk Queue Length” and “Current Disk Queue Length” counters. These settings will capture the amount of disk activity, to review after the data load.
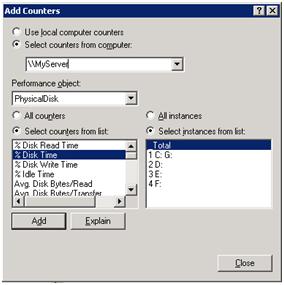
Figure 5: Physical Disk performance object in Perfmon.
With all monitoring systems a go, I am ready to load up a heap table called book_list that I created in the All_Books_Ever_Read database. The Books-List.txt file has approximately 58 thousand records, so I’m going to use the BCP batch file technique to iterate through the file 50 times, and load 2.9 million records into the database:
|
1 2 3 4 5 6 7 8 9 10 |
set n=%1 set i= 1 :loop bcp dba_rep..SQL_Conn in C:\Writing\Simple Talk Book\Ch3\Out1.txt" -n -b 50000 -T -h "TABLOCK" if %i% == %n% goto end set /a i=i+1 goto loop :end |
Now it is time to begin the load. A quick peek at Perfmon, see Figure 6, shows the current absence of activity prior to executing a hefty query.
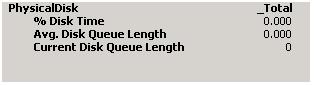
Figure 6: Perfmon low disk activity.
Executing Load … now! Please don’t turn (or create) the next page …!!
Sorry! I could not resist the Sesame Street reference to The Monster at the End of This Book. In fact, the load proceeds with little fanfare. Imagine this is being done in the middle of the afternoon, perhaps after a big lunch or, worse, early in the AM (DBA:M most likely) before your second sip of coffee, with you blissfully unaware of what’s unfolding on one of your servers. Figure 7 shows the BCP bulk insert process running.
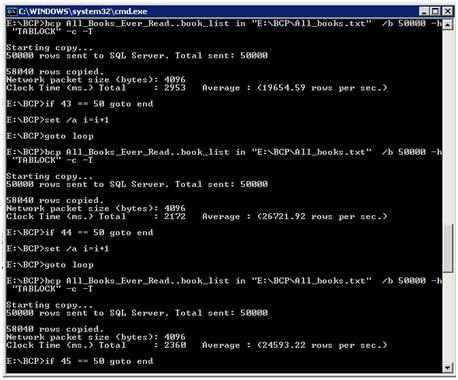
Figure 7: BCPing data into the All_Books_Ever_Read database.
You can see that the batch process ran 50 times at an average of 2.5 seconds a run, with a total load time of roughly 2 minutes. Not bad for 2.9 million records. Now for the bad news: Figure 8 shows how much growth can be directly attributed to the load process.
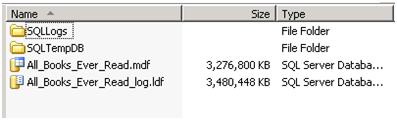
Figure 8: Log file growth loading millions of records into table.
Note: For comparison, in a test I ran without ever having backed up the database, the data file grew to over 3 GB, but the log file grew only to 150 MB.
Both the data file and the log file have grown to over 3GB. The Profiler trace, as shown in Figure 9, reveals that a combined total of 3291 Auto Grow events took place during this data load. Notice also that the duration of these events, when combined, is not negligible.
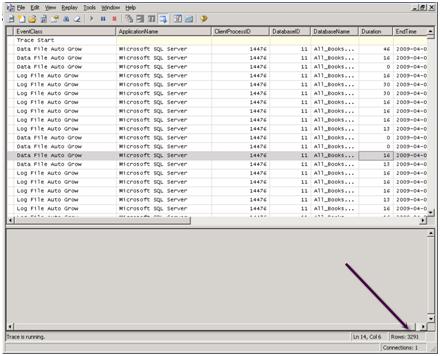
Figure 9: Data and log file growth captured with Profiler.
Finally, Figure 10 shows the Perfmon output during load. As you can see, % Disk Time obviously took a hit at 44.192 %. This is not horrible in and of itself; obviously I/O processes require disk reads and writes and, because “Avg Disk Queue Length” is healthily under 3, it means the disk is able to keep up with the demands. However, if the disk being monitored has a %DiskTime of 80%, or more, coupled with a higher (>20) Avg Disk Queue Length, then there will be performance degradation because the disk cannot meet the demand. Inefficient queries or file growth may be the culprits.
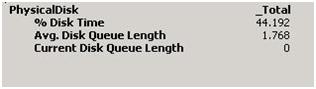
Figure 10: Perfmon disk monitor.
Average and Current Disk Queue Lengths are indicators of whether or not bottlenecks might exist in the disk subsystem. In this case, an Average Disk Queue Length of 1.768 is not intolerably high and indicates that, on average, fewer than 2 requests were queued, waiting for I/O processes, either read or write, to complete on the Disk.
What this also tells me is that loading 2.9 million records into a heap table, batching or committing every 50,000 records, and using the defaults of the Model database, is going to cause significant I/O lag, resulting not just from loading the data, but also from the need to grow the data and log files a few thousand times.
Furthermore, with so much activity, the database is susceptible to unabated log file growth, unless you perform regular log backups to remove inactive log entries from the log file. Many standard maintenance procedures implement full backups for newly created databases, but not all databases receive transaction log backups. This could come up to bite you, like the monster at the end of this article, if you forget to change the recovery model from Full to Simple, or if you restore a database from another system and unwittingly leave the database in Full recovery mode.
Appropriately sizing your data and log files
Having seen the dramatic impact of such bulk load operations on file size, what I really want to know now is how much I could reduce the I/O load, and therefore increase the speed of the load process, if the engine hadn’t had to grow the files 3291 times, in 1 MB increments for the data file, and 10% increments for the log file.
In order to find out, I need to repeat the load process, but with the data and log files already appropriately sized to handle it. I can achieve this by simply truncating the table and backing up the transaction log. This will not shrink the physical data or log files but it will free up all of the space inside them. Before I do that, take a look at the sort of space allocation information that is provided by the sp_spaceused built-in stored procedure in Figure 11.
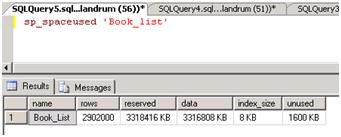
Figure 11: Output of sp_spaceused for the loaded Book_List table.
As you can see, the Book_List table is using all 3.3 GB of the space allocated to the database for the 2.9 million records. Now simply issue the TRUNCATE command.
|
1 |
Truncate Table Book_List |
And then rerun sp_spaceused. The results are shown in Figure 12.
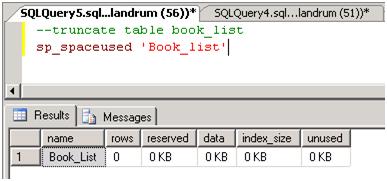
Figure 12: sp_spaceused after truncation.
You can verify that the data file, although now “empty”, is still 3.3GB in size using the Shrink File task in the SSMS GUI. Right click on the database, and select “Tasks |Shrink | Files”. You can see in Figure 13 that the All_Books_Ever_Read.mdf file is still 3.3 GB in size but has 99% available free space.
What this means to me as a DBA, knowing I am going to load the same 2.9 million records, is that I do not expect that the data file will grow again. Figure 14 shows the command window after re-running the BCP bulk insert process, superimposed on the resulting Profiler trace.
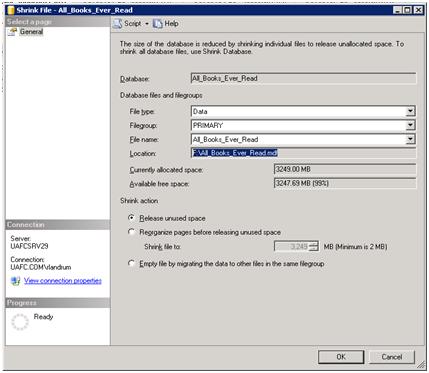
Figure 13: Free space in data file after truncate table statement.
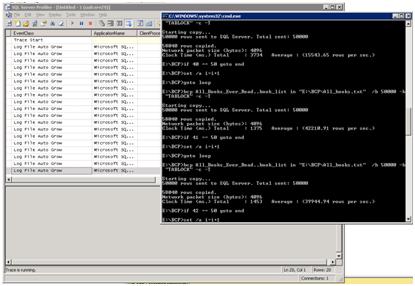
Figure 14: Minimal log file growing with data load.
This time there were no Auto Grow events for the data file, and only 20 for the log file. The net effect is that the average time to load 50,000 records is reduced from 2.5 seconds to 1.3 seconds. A time saving of just over 1 second per load may not seem significant at first, but consider the case where the same process normally takes an hour. Just by ensuring log and data growth was controlled, you have cut the process down to under 30 minutes, and saved a lot of I/O processing at the same time.
Handling space problems
I’ve shown that having incorrectly sized data and log files and inappropriate Auto Grow properties, both inherited from the model database, can significantly increase the I/O load during bulk insert processes. I’ve also demonstrated the dangers of unabated log file growth, unless you change the default recovery model or perform regular log backups.
Even for a database that is subject to as few as 50K transactions per day, I have seen the database log file grow to over 220G over the course of a few months, because no log backups have been taken. The reason for this is that, generally, there are databases with low level SLAs, meaning that a full nightly backup is all that is required.
As I’ve stressed previously, handling these space issues is mainly about planning. The DBA needs to:
- Correctly size the files – if you know that the database you are managing can expect a 2 Gig growth per month, size the data file(s) at 4G initially, not the 3 MB size that will be the default from the Model database.
- Set correct auto grow properties – while 10% growth for data and log files may be sufficient for low utilization databases, typically I set at least 500 MB for the auto growth settings for the data and log files. Unless I expect there to be unusually high data growth, 500 MB represents a good average growth rate, and keeps space utilization at a manageable level but allows for growth over time without heavy I/O impact.
- Make sure only those databases that need FULL recovery are using it – you will determine this from the business and will be part of the SLA for the application and database. If point-in-time recovery is required, make sure you have regular log backups taken of the databases in Full recovery mode.
- Switch to bulk-logged mode for bulk insert operations – bulk loading is a common practice and, if done correctly, will incur minimal log growth, while reaping the performance benefits bulk loading brings. However, make sure you understand the consequences of changing the recovery models while bulk loading data. For instance, you will be unable to perform a point-in-time recovery for the bulk transactions.
If you fail to plan properly, or are simply subject to unexpected and unpredictable file growth, what does this mean for the DBA?
Suppose a database has been inadvertently set to Full recovery with no log backups. The log file has gown massively in size and, ultimately, the drive will run out of space. If you are lucky enough, as I am to have an alerting system, the problem will be caught before that happens and I will get an alert, predictably at 2:30 AM when I have just gone to bed after resolving a different issue.
What I do in such situations, after cursing myself or other innocent people on my team for not catching this sooner, is to issue the following simple statement:
|
1 |
BACKUP LOG <databasename> WITH Truncate_Only |
This statement has the net effect of removing all of the inactive transactions from the log file that would have otherwise been removed with a standard log backup.
Next, I shrink the log file via the GUI (or, if I am not too tired, with code) and then change the recovery model to Simple and go back to bed. Doing this will generally reclaim the necessary disk space to clear all alerts, and ensure that no further log growth will ensue. You can use DBCC to physically shrink a data or log file, as follows:
|
1 |
DBCC SHRINKFILE (filename, target_size) |
Many of the situations that require you to shrink a log file can be avoided simply by planning accordingly and being diligent and fastidious in your installation process, in particular by making sure the model database is always set to Simple and not Full recovery mode. It only needs to happen to you once or twice. I quote George W. Bush, “Fool me once … shame on … shame on you … Fool me can’t get fooled again.
Take that, SQL Server Model Database.
Indexes and large row counts
All DBAs know that indexes are necessary for Olympic style query performance. We also know that they come at a price; and that price is paid in the currency of space and maintenance time. As much as I desperately yearn for the developer’s queries to work efficiently, the DBA is still the gatekeeper of the data and feels obliged to point out the specifics of why queries will and will not benefit from the indexes that the developers suggest.
Often, these index recommendations come from sources like the Database Tuning Advisor (DTA), so we DBAs often eschew them in favor of our own. I do not mean to seem high-minded on this point, my DBA nose pointed straight up in the air. However, rightly or wrongly, DBAs want to control the types of objects (triggers, temp tables, linked servers, and so on) that are added to their servers, and indexes are just another type of object that DBAs must understand, manage and maintain.
I am all in favor of a clustered index on almost every table, backed by a healthy volume of covering non-clustered indexes, but I also know from experience that indexes, for all their good, will only be utilized when proper code is executed that will take advantage of them. It is always worthwhile to explain to SQL developers why their queries do not perform as they expect, with their proposed indexes.
In this section, I am going to add indexes to the Book_List table in order to find out:
- How much extra space is required in order to add a clustered index to a table containing 2.9 million rows.
- Whether this space consumption is justified, by examining the proposed queries that intend to take advantage of the indexes.
Let’s first get a “before” glimpse of space utilization in our Book_List table, using the sp_spaceused stored procedure, as shown in Figure 15. Notice the 8K of index size.
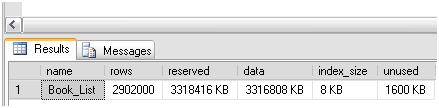
Figure 15: index_size of Book_List table.
Before I can add a clustered index, I need to add an identity column, called Read_ID, on which to place the clustered index. Adding the identity column is, in itself, an expensive task for 2.9 million records. The code is as follows:
|
1 2 |
ALTER TABLE Book_list ADD Read_ID INT IDENTITY |
We can now create the clustered index on this Read_ID column, as shown in Listing 1.
|
1 2 3 4 5 6 7 8 9 10 11 12 13 |
USE [All_Books_Ever_Read] GO CREATE UNIQUE CLUSTERED INDEX [Read_ID] ON [dbo].[Book_List] ( [Read_Date] ASC ) WITH ( STATISTICS_NORECOMPUTE = OFF, SORT_IN_TEMPDB = OFF, IGNORE_DUP_KEY = OFF, DROP_EXISTING = OFF, ONLINE = OFF, ALLOW_ROW_LOCKS = ON, ALLOW_PAGE_LOCKS = ON) ON [PRIMARY] GO |
Listing 1: Creating a clustered index on the Read_ID column of the Book_List table.
As you can see from Figure 16, building a clustered index on almost 3 million records takes some time and processing power.

Figure 16: It takes over 12 minutes to build the clustered index.
Also, it should be noted that users will be unable to connect to the Book_List table for the duration of the index build. Essentially, SQL Server has to physically order those millions of records to align with the definition of the clustered index.
Let’s see what the index took out of my hide by way of space. The former index space for this table was 8K and data space was over 3 Gig. What does sp_spaceused tell me now? See Figure 17.
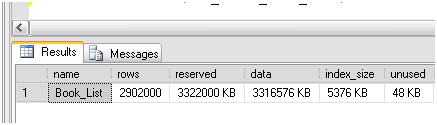
Figure 17: Building the clustered index has increased the index_size to 5376KB.
An increase in index_size to 5376K does not seem too significant. When you create a clustered index, the database engine takes the data in the heap (table) and physically sorts it. In the simplest terms, both a heap and a clustered table (a table with a clustered index) both store the actual data, one is just physically sorted. So, I would not expect that adding a clustered index for the Read_ID column to cause much growth in index_size.
However, while the data size and index size for the Book_List table did not grow significantly, the space allocated for the database did double, as you can see from Figure 18.
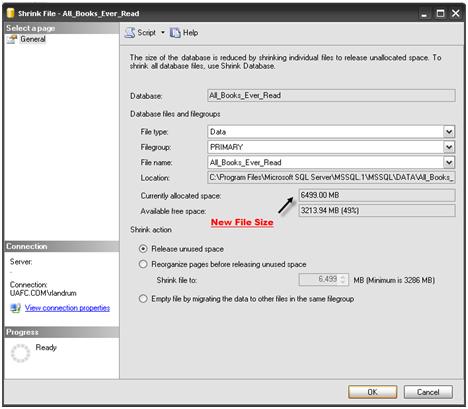
Figure 18: Creating the clustered index caused the data file to double in size.
So not only did the index addition take the table offline for the duration of the build, 12 minutes, it also doubled the space on disk. The reason for the growth is that SQL Server had to do all manner of processing to reorganize the data from a heap to a clustered table and additional space, almost double, was required to accommodate this migration from a heap table to a clustered table. Notice, though, that after the process has completed there is nearly 50% free space in the expanded file.
The question remains, did I benefit from adding this index, and do I need to add any covering non-clustered indexes? First, let’s consider the simple query shown in Listing 2. It returns data based on a specified range of Read_ID values (I know I have a range of data between 1 and 2902000 records).
|
1 2 3 4 5 6 |
Select book_list.Read_ID, book_list.Read_Date, book_list.Book, book_list.Person from book_list where Read_Id between 756000 and 820000 |
Listing 2: A query on the Read_ID column.
This query returned 64,001 records in 2 seconds which, at first glance, appears to be the sort of performance I’d expect. However, to confirm this, I need to examine the execution plan, as shown in Figure 19./p>
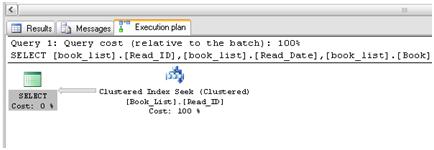
Figure 19: Beneficial use of clustered index for the Book_list table.
You can see that an Index Seek operation was used, which indicates that this index has indeed served our query well. It means that the engine was able to retrieve all of the required data based solely on the key values stored in the index. If, instead, I had seen an Index Scan, this would indicate that the engine decided to scan every single row of the index in order to retrieve the ones required. An Index Scan is similar in concept to a table scan and both are generally inefficient, especially when dealing with such large record sets. However, the query engine will sometimes choose to do a scan even if a usable index is in place if, for example, a high percentage of the rows need to be returned. This is often an indicator of an inefficient WHERE clause.>
Let’s say I now want to query a field that is not included in the clustered index, such as the Read_Date. I would like to know how many books were read on July 24th of 2008. The query would look something like that shown in Listing 3.
|
1 2 3 4 5 6 |
Select count(book_list.Read_ID), book_list.Read_Date from book_list where book_list.Read_Date between '07/24/2008 00:00:00' and '07/24/2008 11:59:59' Group By book_list.Read_Date |
Listing 3: A query that is not covered by the clustered index.
Executing this query, and waiting for the results to return, is a bit like watching paint dry or, something I like to do frequently, watching a hard drive defragment. It took 1 minute and 28 seconds to complete, and returned 123 records, with an average count of the number of books read on 7/24/2008 of 1000.
The execution plan for this query, not surprisingly, shows that an index scan was utilized, as you can see in Figure 20.
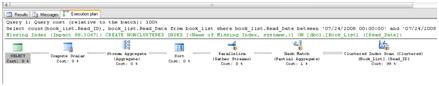
Figure 20: Clustered index scan for field with no index.
What was a bit surprising, though, is that the memory allocation for SQL Server shot up through the roof as this query was executed. Figure 21 shows the memory consumption at 2.51G which is pretty drastic considering the system only has 2G of RAM.
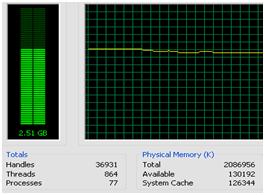
Figure 21: Memory utilization resulting from date range query.
The reason for the memory increase is that, since there was no available index to limit the data for the query, SQL Server had to load several million records into the buffer cache in order to give me back the 123 rows I needed. Unless you have enabled AWE, and set max server memory to 2G (say) less than total server memory, then the server is going to begin paging, as SQL Server grabs more than its fair share of memory, and thrashing disks. This will have a substantial impact on performance.
If there is one thing that I know for sure with regard to SQL Server configuration and management, it is that once SQL Server has acquired memory, it does not like to give it back to the OS unless prodded to do so. Even though the query I ran has completed many minutes ago, my SQL Server instance still hovers at 2.5G of memory used, most of it by SQL Server.
It’s clear that I need to create indexes that will cover the queries I need to run, and so avoid SQL Server doing such an expensive index scan. I know that this is not always possible in a production environment, with many teams of developers all writing their own queries in their own style, but in my isolated environment it is an attainable goal.
The first thing I need to do is restart SQL Server to get back down to a manageable level of memory utilization. While there are other methods to reduce the memory footprint, such as freeing the buffer cache (DBCC DROPCLEANBUFFERS), I have the luxury of an isolated environment and restarting SQL Server will give me a “clean start” for troubleshooting. Having done this, I can add two non-clustered indexes, one which will cover queries on the Book field and the other the Read_Date field.
Having created the two new indexes, let’s take another look at space utilization in the Book_List table, using sp_spaceused, as shown in Figure 22.
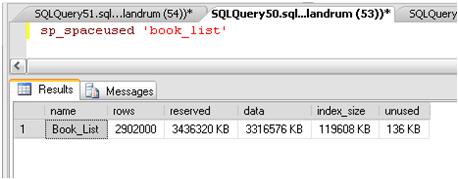
Figure 22: Increased index size for 2 non clustered indexes.
The index_size has risen from 5MB to 119MB, which seems fairly minimal, and an excellent trade-off assuming we get the expected boost in the performance of the read_date query.
If you are a DBA, working alongside developers who give you their queries for analysis, this is where you hold your breath. Breath held, I click execute. And … the query went from 1 minute 28 seconds to 2 seconds without even a baby’s burp in SQL Server memory. The new execution plan, shown in Figure 23, tells the full story.
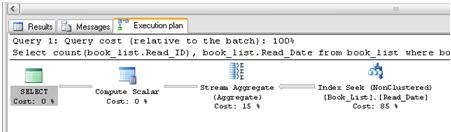
Figure 23: Addition of covering indexes leads to an efficient index seek operation.
So, while indexes do indeed take space, this space utilization is usually more than warranted when they are used correctly, and we see the desired pay-off in query performance.>
The issue with indexes arises when development teams adopt a scattergun approach to indexes, sometimes to the point of redundancy and harm to the database. Adding indexes arbitrarily can often do as much harm as good, not only because of the space that they take up, but because each index will need to be maintained, which takes time and resources./p>
TempDB
No DBA who has been working with SQL Server for long will have been immune to runaway TempDB growth. If this growth is left unchecked, it can eventually fill up a drive and prohibit any further activity in SQL Server that also requires the use of the TempDB database.
SQL Server uses the TempDB database for a number of processes, such as sorting operations, creating indexes, cursors, table variables, database mail and user defined functions, to name several. In addition to internal processes, users have the ability to create temporary tables and have free reign to fill these tables with as much data as they wish, assuming that growth of the TempDB data file is not restricted to a specific value, which by default it is not.
I do not recommend restricting growth for TempDB files, but I do recommend that you be aware of what will happen if TempDB does fill up. Many SQL Server processes, including user processes, will cease and an error message will be thrown, as I will show.
The TempDB database is created each time SQL Server is restarted. It is never backed up nor can it be. It is always in Simple mode and the recovery model cannot be changed.
There are a couple of TempDB “properties”, though, that you can and should change when configuring your server:
- Its location
- Its autogrowth rate
By default, TempDB is created in the default data folder, which is set during SQL installation. It is highly recommended that, if possible, this location be changed so that TempDB resides on its own disk. Many DBAs also create multiple TempDB files, typically one per processor, with the aim of boosting performance still further. However, be warned that you will need to spread the load of these multiple files across multiple disks, in order to achieve this.
Like all other databases, TempDB adopts the default configuration of the model database, which means that it will grow in 10% increments with unrestricted growth, unless you specify otherwise. In my opinion, having an autogrowth of 10% on TempDB is a bad idea because when rogue queries hit your server, calling for temporary tables, as they will do eventually, you do not want the TempDB database filling up the drive. Let’s assume that you have a 30G TempDB database sitting on a 50G drive and autogrowing in 10% (i.e. 3G) increments. It would take only 6 growth events to fill the drive. Ideally, you will want to set a fixed growth rate of 3G for TempDB and use multiple TempDB data files across multiple disks.
When loading multiple tens of millions of records into TempDB, bearing in mind that 1 million records is roughly equivalent to 1G, you can see how this can happen fairly easily. So, what happens when TempDB fills up? Let’s find out!
I’d have to generate a lot of TempDB activity to fill up 50GB of disk, so I am going to artificially restrict the data file for TempDB to a size of 200 MB, via the “maximum file size” property. Figure 24 shows the configuration.
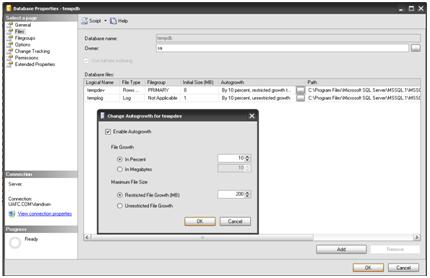
Figure 24: Changing the TempDB maximum file size to 2 Gigabytes for simulation.
Now that I’ve set the maximum file size for TempDB, it is time to fill it up and for that I will turn to our old friend, the endless loop. I have seen only a few of these in the wild but they do exist, I promise, and when you combine an endless loop with data or log space limitation, something has to give. Listing 4 shows the loopy code.
|
1 2 3 4 5 6 7 8 9 10 11 12 13 14 15 16 17 18 19 |
CREATE TABLE #HoldAll ( Read_ID INT, Read_Date DATETIME, Person VARCHAR(100) ) GO DECLARE @cnt int = 1 WHILE @cnt = 1 BEGIN INSERT INTO #HoldAll SELECT Read_ID, Read_Date, Person FROM All_Books_Ever_Read.dbo.book_List WHERE Read_Date > '05/21/08' END GO |
Listing 4: The dreaded endless loop.
Notice that @cnt is given the value of 1, but nowhere subsequently is the value changed, so this query will run and run until it fills up a drive or surpasses a file size threshold, whichever comes sooner. In this example, the query runs for 3 minutes before we hit the 200MB file size limit, as shown in Figure 25, and get an error that the filegroup is full.
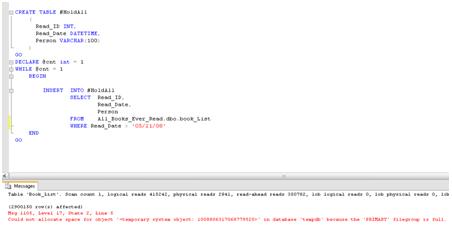
Figure 25: Filling up TempDB.
At this point the query fails, obviously, as will any other queries that need to use TempDB. SQL Server is still functioning properly, but as long as the temp table #HoldAll exists, TempDB will stay filled.
Hopefully, you’ve got notifications and alerts set up to warn you of the imminent danger, before the file actually fills up. In any event, you are likely to experience that DBA:M feeling, having spent half the night trying to track down the problem query and resolve the issue.
Note: I cover notifications, alerts and monitoring in depth in Chapter 6 of my book, SQL Server Tacklebox, from which this article is extracted and which is available in eBook form as a free download.
Your three options, as a DBA, are to:
- Restart SQL Server.
- Try to shrink the TempDB database.
- Find the errant query and eradicate it.
Generally speaking, restarting is not always an option in a production system. Shrinking TempDB is a valid option, assuming that it can be shrunk. Sometimes, when there are open transactions, it is not possible. Therefore, finding and killing the offending query is the more likely course of action. The techniques you can use to do this are the focus of my article on Troubleshooting.
For now, I am going to simply close the query window which should force the temp table to be deleted and so allow the shrink operation to go ahead. Sure enough, once I’d closed the connection I was able to select Tasks | Shrink |Database from within SSMS, and so shrink TempDB from 200 MB back down to its original size of 8K. Problem solved.
Now, back to bed with a sleepy note to self to find the developer who wrote this code, and chastise him or her. Wait, I am the DBA who let this get into production in the first place, so new list … chastise self, get back to sleep, find the developer tomorrow and chastise him or her anyway; if they ask how it got into production … change subject.
A query to determine current space utilization
I have written a few articles about various queries that help me with my day to day job as a DBA. The following query is one that I use every single day to monitor potential space issues on my servers. If I notice a “danger signal” I can then dig deeper and determine the root cause, which is usually one of the issues discussed in this article i.e. log file growth due to incorrect recovery models, too many indexes, TempDB filling up, or just poor capacity planning.
The SizeQuery query, shown in Listing 5, combines output from several sources, such as sp_MSForEachDB and xp_fixeddrives, and merges them to show how much data and log space is used, what drive that space is used on, and how much free space is available.
|
1 2 3 4 5 6 7 8 9 10 11 12 13 14 15 16 17 18 19 20 21 22 23 24 25 26 27 28 29 30 31 32 33 34 35 36 37 38 39 40 41 42 43 44 45 46 47 48 49 50 51 52 53 54 55 56 57 58 59 60 61 62 63 64 65 66 67 68 69 70 71 72 |
Set NoCount On --Check to see the temp table exists IF EXISTS ( SELECT Name FROM tempdb..sysobjects Where name like '#HoldforEachDB%' ) --If So Drop it DROP TABLE #HoldforEachDB_size --Recreate it CREATE TABLE #HoldforEachDB_size ( [DatabaseName] [nvarchar](75) COLLATE SQL_Latin1_General_CP1_CI_AS NOT NULL, [Size] [decimal] NOT NULL, [Name] [nvarchar](75) COLLATE SQL_Latin1_General_CP1_CI_AS NOT NULL, [Filename] [nvarchar](255) COLLATE SQL_Latin1_General_CP1_CI_AS NOT NULL, ) ON [PRIMARY] IF EXISTS ( SELECT name FROM tempdb..sysobjects Where name like '#fixed_drives%' ) --If So Drop it DROP TABLE #fixed_drives --Recreate it CREATE TABLE #fixed_drives ( [Drive] [char](1) COLLATE SQL_Latin1_General_CP1_CI_AS NOT NULL, [MBFree] [decimal] NOT NULL ) ON [PRIMARY] --Insert rows from sp_MSForEachDB into temp table INSERT INTO #HoldforEachDB_size EXEC sp_MSforeachdb 'Select ''?'' as DatabaseName, Case When [?]..sysfiles.size * 8 / 1024 = 0 Then 1 Else [?]..sysfiles.size * 8 / 1024 End AS size,[?]..sysfiles.name, [?]..sysfiles.filename From [?]..sysfiles' --Select all rows from temp table (the temp table will auto delete when the connection is gone. INSERT INTO #fixed_drives EXEC xp_fixeddrives Select @@Servername print '' ; Select rtrim(Cast(DatabaseName as varchar(75))) as DatabaseName, Drive, Filename, Cast(Size as int) AS Size, Cast(MBFree as varchar(10)) as MB_Free from #HoldforEachDB_size INNER JOIN #fixed_drives ON LEFT(#HoldforEachDB_size.Filename, 1) = #fixed_drives.Drive GROUP BY DatabaseName, Drive, MBFree, Filename, Cast(Size as int) ORDER BY Drive, Size Desc print '' ; Select Drive as [Total Data Space Used |], Cast(Sum(Size) as varchar(10)) as [Total Size], Cast(MBFree as varchar(10)) as MB_Free from #HoldforEachDB_size INNER JOIN #fixed_drives ON LEFT(#HoldforEachDB_size.Filename, 1) = #fixed_drives.Drive Group by Drive, MBFree print '' ; Select count(Distinct rtrim(Cast(DatabaseName as varchar(75)))) as Database_Count from #HoldforEachDB_size |
Listing 5: Size query.
Example results of the Size query are shown in Figure 26.
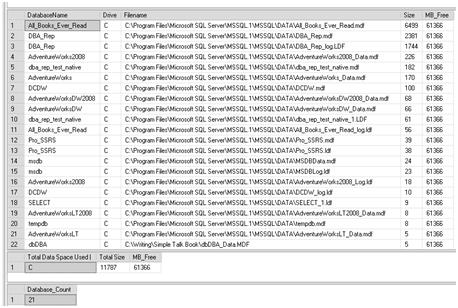
Figure 26: Output of Size query.
You can see that the All_Books_Ever_Read database has 6.4G of allocated space on the C: drive. Since my sample databases reside only on the C: drive, all allocation is for this drive. However, if I were to have my log files on E: and TempDB on F:, for example, then query output would show the breakdown for each drive that actually stores any database file. You can see there is 61G free on the C: drive and of that 11G consists of database files.
Summary
In this article, I have explored some of the scenarios where disk space is consumed by processes, in many cases because of incorrect configurations for recovery models, data growth for large objects and queries that overtax TempDB resources. Many of these scenarios can be avoided with proper planning. However, it can be expected that, at some point, there will arise a situation that requires the DBA team to jump in and rescue the SQL Server.
When this happens, and it happens quite frequently, DBAs need to have an arsenal of troubleshooting tools at their disposal.
This article is taken from Chapter 4 of his book, SQL Server Tacklebox. You can buy a hard copy of the book from Amazon.com, or, if you are a subscriber, download a free e-copy from Simple-Talk.
If you enjoyed this chapter, then you’ll like these articles by Rodney also taken from the book …
Eating SQL Server Installations for Breakfast
Finding Data Corruption
The DBA as Detective: Troubleshooting Locking and Blocking