
Every statement executed against SQL Server is transactional, and SQL Server implements various transaction isolation levels, to ensure the ACID (Atomicity, Consistency, Isolation, and Durability) properties of these transactions. In practical terms, this means that it uses locks and latches to mediate transactional access to shared database resources, and so prevent “interference” between the transactions. When a transaction encounters a locked resource it must, of course, wait for the resource to become free before proceeding. If such blocking occurs frequently or is protracted, it greatly restricts the number of concurrent users that can access the system.
This article explains how to use the transaction-related Dynamic Management Objects (DMOs) to locate the transactions that are causing locking and blocking issues on their SQL Server instances, and the sessions to which they belong. Having located the offending transactions, the DBA can then take steps to alleviate the blocking, either by tuning the SQL or, if this is not possible, by careful scheduling of the more resource-hungry and/or longer-running business reports, so that they occur separately from the main Online Transaction Processing (OLTP) load.
We’ll also examine how to use the transaction-related DMOs to, for example, investigate long-running transactions that may be preventing transaction log truncation, and transactions that are causing large amounts of data to be written to the transaction log, making it grow rapidly in size.
What is a transaction, anyway?
Microsoft Books Online is as good a place as any to start, for a definition of the term, transaction:
A transaction is a sequence of operations performed as a single logical unit of work. A logical unit of work must exhibit four properties, called the ACID properties, to qualify as a transaction.
For a transaction to pass the ACID Test, all of its data modifications must complete or be rolled back (Atomic); the end result must be that all data and supporting structures such as indexes must be consistent with the rules that apply to them (Consistent). A transaction cannot be impacted by any other transactions occurring concurrently (Isolated); the results of the transaction being permanently recorded in the RDBMS (Durability).
As noted in the introduction to this article, every statement executed against SQL Server is transactional. If we issue a single SQL statement, an implicit transaction is run under the covers, which auto-starts and auto-completes. If we use explicit BEGIN TRAN / COMMIT TRAN commands, then we can group together in an explicit transaction a set of statements that must fail or succeed together. This is easily demonstrated by the series of queries shown in Listing 1 and the resulting output.
|
1 2 3 4 5 6 7 8 9 10 11 12 13 14 15 16 17 18 19 20 21 22 23 24 25 26 27 |
SELECT DTAT.transaction_id FROM sys.dm_tran_active_transactions DTAT WHERE DTAT.name <> 'worktable' ; SELECT DTAT.transaction_id FROM sys.dm_tran_active_transactions DTAT WHERE DTAT.name <> 'worktable' ; BEGIN TRAN SELECT DTAT.transaction_id FROM sys.dm_tran_active_transactions DTAT WHERE DTAT.name <> 'worktable' ; SELECT DTAT.transaction_id FROM sys.dm_tran_active_transactions DTAT WHERE DTAT.name <> 'worktable' ; COMMIT TRAN transaction_id -------------------- 18949550 ... 18949551 ... 18949552 ... 18949552 |
Listing 1: All statements within SQL Server are transactional.
According to the results of these queries, any statements executed outside of an explicit transaction will execute as separate transactions, and each will result in a row with a unique transaction_id in our result sets. All statements executed within an explicit transaction will be reported with a single transaction_id.
This article is adapted from a chapter of ‘Performance Tuning with SQL Server Dynamic Management Views’ by Louis Davidson and Tim Ford. To learn more about this book, visit the Amazon page.
SQL Server will attempt to ensure that each unit of work, be it a single-statement implicit transaction, or any number of individual SQL statements within an explicit transaction, conforms to the ACID test characteristics.
What we hope to demonstrate, in this article, is how to observe these units of work via the DMOs. Since the lifespan of these transactions is measured in milliseconds, when everything is going right, the focus will be on those transactions that are having difficulty completing in a timely fashion, whether due to contention for resources, poor tuning, or other issues.
Investigating Locking and Blocking
Locking is an integral aspect of any RDBMS. Locks control how transactions are allowed to interact, impact, and impede one another when running simultaneously against common objects. Unless you restrict data access to one user at a time, clearly not a viable option, locks are necessary to the smooth functioning of any RDBMS.
Locks are to be neither feared nor shunned but, nevertheless, can cause problems for the reckless or unwary. When using SQL Server’s default isolation level, READ COMMITTED, shared read locks are acquired during data reads. These locks prevent another transaction from modifying that data while the query is in progress, but do not block other readers. Furthermore, “dirty reads” are forbidden so SQL Server acquires exclusive locks during updates, to prevent a transaction from reading data that has been modified by another transaction, but not committed. Of course, this means that if one transaction (A) encounters data that is being modified by another transaction (B), then transaction A is blocked; it needs access to a resource that is locked by B and cannot proceed until B either commits or rolls back.
As noted, this is normal behavior but, in conditions of highly concurrent user access, the potential for blocking will increase. The situation will be exacerbated by, for example, transactions that are longer than they need to be or are poorly written, causing locks to be held for longer than necessary. As locking and blocking increase, so does the overhead on the RDBMS and the end result is a significant reduction in concurrency.
READ UNCOMMITTED – Don’t do it
If you want concurrency at all costs, then READ UNCOMMITTED isolation level will shun locks as far as possible. This mode allows dirty reads, so use it at the expense of your data consistency and integrity.
In READ COMMITTED mode, shared read locks are released as soon as a query completes, so data modification transactions can proceed at that point, even if the transaction to which the query belongs is still open. Therefore, non-repeatable reads are possible; if the same data is read twice in the same transaction, the answer may be different. If this is not acceptable, the isolation level can be made more restrictive. The REPEATABLE READ level will ensure that all the rows that were read cannot be modified or deleted until the transaction which read them completes. However, even this level does not prevent new rows(called phantom rows) being inserted that satisfy the query criteria, meaning that reads are not, in the true sense, repeatable. To prevent this, you could switch to SERIALIZABLE, the most restrictive isolation level of all, which basically ensures that a transaction is completely isolated from the effects of any other transaction in the database.
However, as the isolation level becomes more restrictive, so the use of locks becomes more prevalent and the likelihood of blocking, and even deadlocking, where transaction A is waiting for a resource that is held by B, and vice versa, increases dramatically. Note also, that it is not only competing modifications that can cause a deadlock. It is just as possible for a modification to deadlock with a reporting query. In short, DBAs need a way of investigating blocking on their SQL Server instances.
Snapshot isolation level
The snapshot isolation level was introduced in SQL Server 2005 and eliminates blocking and deadlocking by using row versioning in the tempdb version store to maintain concurrency, rather than establishing locks on database objects. There exist five DMOs dedicated to investigation of this isolation level and of version store usage. These will not be covered in this article, but more information can be found in our book Performance Tuning with SQL Server DMVs, as well as in Books Online.
DMOs, Activity Monitor and sp_who2
Pre-SQL Server 2005, the only way a DBA could analyze blocking behavior in a SQL Server instance was to query the sysprocesses system table or to use sp_who and sp_who2. With SQL 2005, the situation has improved dramatically, and this information is now available through several new routes:
- using the sys.dm_trans_locks DMV
- the “blocked process report” in SQL Server Profiler
- using Activity Monitor in SSMS
Activity Monitor is basically a graphical representation of sysprocesses and it can provide basic information regarding sessions that are blocked and blocking. For example, if we establish some blocking on a table in AdventureWorks, then open Activity Monitor (Ctrl+Alt+A), we can quickly establish that session 54 is blocked by session 52, as shown in Figure 1.
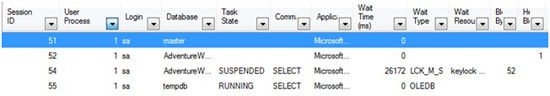
Figure 1: Investigating blocking with Activity Monitor
However, the information provided is pretty limited and, as we hope to demonstrate, the sys.dm_trans_lock DMV provides a wealth of extra information regarding the lock being held; you can query the available data in such a way that everything you need to resolve the problem is presented in a single result set.
An overview of the sys.dm_tran_locks DMV
The sys.dm_tran_locks DMV provides insight into the current state of locking in a SQL Server instance, across all databases. It returns a row for every currently active request to the lock manager for a lock that has been granted or is waiting to be granted. The columns provided offer information regarding both the resource on which the lock is being held (or has been requested), and the owner of the request. The sys.dm_tran_locks DMV provides a snapshot of the state of the server at the point in time the query is executed.
The resource-related columns identify the resource being locked, its type, and the database on which the locking is occurring.
- resource_type – target resource object for the lock, such as Table (OBJECT locks), Page (PAGE locks), Row (RID locks), or Key (KEY locks).
- resource_database_id – ID of the database on which the locked resource resides. This column can be used to join to the dbid column in sys.sysdatabases, as well as to several other system views and DMVs.
- resource_associated_entity_id – depending upon the resource_type, this value is either:
- object_id of the target object, if resource_type = OBJECT
- the object_id of the parent object (courtesy of sys.partitions), if the resource_type is a KEY, PAGE, or RID.
Returning the name of the object is possible via the OBJECT_ID() system function, by passing in both the object_id and the database_id (respectively).
Of particular interest here is the resource_type column, which indentified the lock type being requested. SQL Server can lock a number of different types of resource, the most obvious being tables (OBJECT locks), pages (PAGE locks), rows (RID locks), and keys (KEY locks), in order of increasing granularity. Locks are granted and released on these objects as needed, in order to satisfy the requirements of the isolation levels in use by the various sessions. In the locking hierarchy, row and key locks are the lowest level, most granular forms of lock. The more granular the lock, the higher the degree of concurrent access can be supported. However, with that comes a higher memory overhead, from having to manage a large number of individual locks.
SQL Server automatically chooses locks of the highest possible granularity, suitable for the given workload. However, if too many individual locks are being held on an index or heap, or if forced to do so due to memory pressure, SQL Server may use lock escalation to reduce the total number of locks being held. For example, a large number of individual row locks may be escalated to a single table lock, or a number of page locks may be escalated to a table lock (escalation is always to a table lock). While this will result in lower overhead on SQL Server, the cost will be lower concurrency. If processes are running on your servers that are causing lock escalation, it’s worth investigating whether the escalation is justified, or if SQL tuning can be performed to prevent it. The index_lock_promotion_count column of the sys.dm_db_index_operational_stats DMV can let you know if lock escalation is occurring frequently on a given index or heap.
Lock escalation
A full discussion of this topic is beyond the scope of this book, but good explanations are offered on MSDN and by Sunil Agarwal, Program Manager for the Storage Engine Group.
The remaining columns of the sys.dm_tran_locks DMV offer a means to determine the nature, status and owner of the lock request, and to relate this locking information to that available from other DMVs, regarding the sessions or transactions with which the locks are associated.
- request_mode – type of lock that is being held, or has been requested, such as Shared (S), Update (U), Exclusive (X), Intent Exclusive (IX), and so on. Please see BOL for full details on the various locking modes.
- request_status – status of the lock:
- GRANT -indicates the lock has been taken
- CONVERT – the request is in the process of being fulfilled
- WAIT – the resource is not locked, but is trying to lock the resource.
- request_owner_type – type of owner of the transaction:
- TRANSACTION
- CURSOR
- SESSION
- SHARED_TRANSACTION_WORKSPACE
- EXCLUSIVE_TRANSACTION_WORKSPACE.
- request_session_id – the session_id of the requestor. Exposing this column allows the DBA to join back to the information provided in any of the sys.dm_exec_* DMVs as well as sys.sysprocesses (via a join to its spid column).
- request_owner_id – this column is only valid when the request_owner_type is TRANSACTION. In that case the value is the transaction_id for the associated transaction.
One final column that is very useful is the lock_owner_address, which is a binary address used internally to track the lock request. It is not interesting to the DBA in its own right, but in the fact that it can be used to join to the resource_address column in the sys.dm_os_waiting_tasks DMV, to relate locking information to tasks that are waiting for a resource to become available, before proceeding (i.e. are blocked). We’ll discuss this in much more detail in the section entitled Investigating Blocking.
Other sys.dm_tran_locks columns
This DMV provides other columns that I don’t often use as a DBA, and so have omitted. For a full column listing, please refer to: http://technet.microsoft.com/en-us/library/ms190345.aspx.
Investigating locking
A single request to query or modify some data may cause multiple locks to be granted, against several resources in the database. For example, consider the UPDATE statement below against the Production.ProductCategory table in the AdventureWorks database, shown in Listing 2.
|
1 2 3 4 5 |
BEGIN TRANSACTION UPDATE [Production].[ProductCategory] SET [Name] = 'Parts' WHERE [Name] = 'Components'; --ROLLBACK TRANSACTION |
Listing 2: An uncommitted update of the Production table in AdventureWorks.
A query against the sys.dm_trans_locks DMV, shown in Listing 3, will reveal the locks acquired in the AdventureWorks database, as a result of our uncommitted UPDATE.
|
1 2 3 4 5 6 7 8 9 10 11 12 13 14 15 16 17 18 19 |
SELECT [resource_type] , DB_NAME([resource_database_id]) AS [Database Name] , CASE WHEN DTL.resource_type IN ( 'DATABASE', 'FILE', 'METADATA' ) THEN DTL.resource_type WHEN DTL.resource_type = 'OBJECT' THEN OBJECT_NAME(DTL.resource_associated_entity_id, DTL.[resource_database_id]) WHEN DTL.resource_type IN ( 'KEY', 'PAGE', 'RID' ) THEN ( SELECT OBJECT_NAME([object_id]) FROM sys.partitions WHERE sys.partitions.hobt_id = DTL.resource_associated_entity_id ) ELSE 'Unidentified' END AS requested_object_name , [request_mode] , [resource_description] FROM sys.dm_tran_locks DTL WHERE DTL.[resource_type] <> 'DATABASE' ; |
Listing 3: Locking due to single UPDATE statement against a user table in SQL Server.
The query is actually very straightforward, but made to look a little more intimidating by the CASE statement, where we return a value for the object name (or parent object name, when dealing with PAGE and KEY locks, in this case) for the locked resource. The way in which we need to do this depends on the type of lock being held. In the case of DATABASE, FILE, or METADATA locks, the query simply returns the value for the lock type. For OBJECT locks, the parent object is directly associated with the object_id. For PAGE, RID, or KEY locks, we need to look up the object_id associated to the object_id in the sys.partitions catalog view, by joining the hobt_id in that view to the resource_associated_entity_id in sys.dm_tran_locks. Each session on SQL Server also creates a DATABASE shared lock, which I’ve filtered out in the WHERE clause.
The output of the query looks as shown in Figure 2.
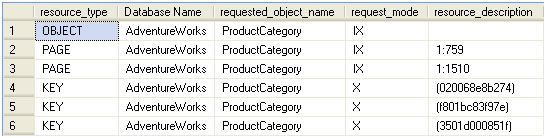
Figure 2: Locking results for the AdventureWorks database
You’ll note that locks are issued against multiple objects and at different granularities to allow for the update:
- an intent-exclusive lock is placed on the ProductCategory table denoting the intent to take exclusive locks lower in the hierarchy
- two pages (one in each of two indexes) are also granted intent-exclusive locks; the n:x notation in the resource_description column signifies the nth partition and the xth page in that partition, for a given PAGE lock
- three exclusive KEY locks are granted against the individual index keys; the values listed in resource_description are hashes of the key value.
When everyone plays by the rules this architecture works fairly well. However, situations arise when transactions don’t release locks in a timely manner, due to I/O bottlenecks on the server, or when locks are held longer than they should be due to poorly coded T-SQL.
Reducing lock times
In this book, we must focus on the DMOs, so a full discussion of strategies for minimizing the length of time that locks are held is out of scope. SQL Server MVP Brad McGehee offers his take on reducing lock times on SQLServerPerformance.com.
If, from a second tab in SSMS, we now run a second query, shown in Listing 4 (having neither committed or rolled back the query in Listing 2), we’ll introduce some blocking in the AdventureWorks database.
|
1 2 |
SELECT * FROM [Production].[ProductCategory] ; |
Listing 4: A simple query against the ProductCategory table, which will be blocked.
We’ll present a more detailed script for detecting blocking in the next section, but the one in Listing 5 demonstrates the basic pattern for joining to the execution-related DMOs to find out which sessions are involved in blocking, which login “owns” these sessions, and what SQL statements they are executing.
|
1 2 3 4 5 6 7 8 9 10 11 12 13 14 15 16 17 18 19 20 21 22 23 24 25 26 27 28 29 30 31 32 33 34 35 36 37 |
SELECT DTL.[request_session_id] AS [session_id] , DB_NAME(DTL.[resource_database_id]) AS [Database] , DTL.resource_type , CASE WHEN DTL.resource_type IN ( 'DATABASE', 'FILE', 'METADATA' ) THEN DTL.resource_type WHEN DTL.resource_type = 'OBJECT' THEN OBJECT_NAME(DTL.resource_associated_entity_id, DTL.[resource_database_id]) WHEN DTL.resource_type IN ( 'KEY', 'PAGE', 'RID' ) THEN ( SELECT OBJECT_NAME([object_id]) FROM sys.partitions WHERE sys.partitions.hobt_id = DTL.resource_associated_entity_id ) ELSE 'Unidentified' END AS [Parent Object] , DTL.request_mode AS [Lock Type] , DTL.request_status AS [Request Status] , DER.[blocking_session_id] , DES.[login_name] , CASE DTL.request_lifetime WHEN 0 THEN DEST_R.TEXT ELSE DEST_C.TEXT END AS [Statement] FROM sys.dm_tran_locks DTL LEFT JOIN sys.[dm_exec_requests] DER ON DTL.[request_session_id] = DER.[session_id] INNER JOIN sys.dm_exec_sessions DES ON DTL.request_session_id = DES.[session_id] INNER JOIN sys.dm_exec_connections DEC ON DTL.[request_session_id] = DEC.[most_recent_session_id] OUTER APPLY sys.dm_exec_sql_text(DEC.[most_recent_sql_handle]) AS DEST_C OUTER APPLY sys.dm_exec_sql_text(DER.sql_handle) AS DEST_R WHERE DTL.[resource_database_id] = DB_ID() AND DTL.[resource_type] NOT IN ( 'DATABASE', 'METADATA' ) ORDER BY DTL.[request_session_id] ; |
Listing 5: Which sessions are causing blocking and what statement are they running?
The result set returned is shown in Figure 3.
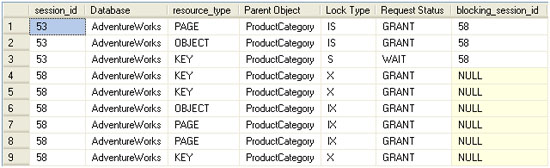
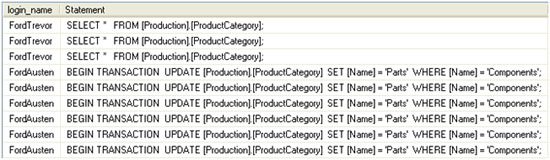
Figure 3: Locking and blocking results in AdventureWorks, based upon two sample transactions.
The LEFT JOIN in Listing 5 is necessary because the request no longer exists for the initial (blocking) UPDATE statement; although it is neither committed nor rolled back, execution is complete. Therefore, an INNER JOIN would omit those rows in the sys.dm_tran_locks view that refer to the updating query. This is also part of the reason why we need two OUTER APPLY joins to sys.dm_exec_sql_text: one using sql_handle from sys.dm_exec_requests and one using sys.dm_exec_connections.most_recent_sql_handle. Since the request no longer exists for the blocking update, sys.dm_exec_connections needs to supply the sql_handle. Conversely, however, sys.dm_exec_connections (and sys.dm_exec_sessions) is only updated with cumulative values for such columns as cpu_time, memory_usage, and sql_handle after associated requests complete execution. The blocked query is still executing and so we can’t rely on SDEC.most_recent_sql_handle for the command text of the live request. The acid test for deciding how to call sys.dm_exec_sql_text is the request_lifetime column in sys.dm_tran_locks. If request_lifetime is 0 it signifies that the request is still active and sys.dm_exec_requests.sql_handle should be used. Otherwise, the value needs to come from sys.dm_exec_connections.most_recent_sql_handle.
Blocking analysis using sys.dm_trans_locks and sys.dm_os_waiting_tasks
A certain amount of blocking activity is normal and to be expected in SQL Server. In the course of daily operation, SQL Server will intentionally prevent one process from accessing an object if another process has a lock on it, in order to preserve data integrity and present a consistent view of the data. The DBA always hopes that the lifespan of a request, i.e. the time between the first transaction starting to execute, and the final commit for the last transaction associated with the request, is fleeting; more akin to the digital equivalent of the fruit fly than the tortoise. In such cases, blocking will generally be of the order of milliseconds and users will be unaffected by it.
In systems with many concurrent transactions, some degree of blocking is probably unavoidable, but the situation can be greatly exacerbated by transactions that are longer or more complex than is strictly dictated by the business requirements, or that need to use more restrictive transaction isolation levels (such as REPEATABLE READ or SERIALIZABLE). In my experience as a DBA, the most common causes of these issues are listed below.
- Poorly written transactions – these include transactions that contain an unnecessarily high number of statements, and transactions that process an unnecessarily large amount of data due to lack of a WHERE clause, or predicates that are not as restrictive as they could be. The best query is one that makes as few passes through the data as possible, returns as few rows as is necessary, and only returns the columns required to satisfy the user’s needs.
- Poorly designed databases – absent indexing, lack of foreign keys, incorrect or inadequate clustering keys, and poorly chosen data types may all lead to decreased concurrency and excessive blocking.
- Poorly maintained databases – fragmented indexes and outdated statistics can lead to suboptimal query execution, which causes locks to be held longer than is necessary, and results in table or index scans when a seek should, and could, be used.
- Poorly designed applications – in terms of crimes against databases committed by application code, I’ve seen it all: applications that request a batch of records from the database and iterate through the recordset row by row; applications that make almost exclusive use of SELECT *… queries; applications that submit ad hoc SQL code and make no use of stored procedures or other optimized processes. In many cases, particularly when hosting the database for third-party applications, the DBA cannot alter the code and has little influence over getting it fixed.
All of this leads to transactions that take longer than necessary to complete, hold locks for longer than necessary, and so cause significant blocking of other transactions.
When investigating blocking issues as a DBA, what we really need is a clear, single page of data that shows the transactions involved in blocking, including the actual SQL statements within those transactions, the sessions to which these transactions belong, and the users who own these sessions.
In order to achieve this, we can start our investigation at the sys.dm_os_waiting_tasks DMV. This DMV returns one row for each task that is waiting for a resource to become available before proceeding (i.e. is blocked). Armed with a session_id for any tasks that are currently waiting, we can use the resource_address column in this DMV to join back to the lock_owner_address column in the sys.dm_tran_locks DMV, and so relate the waiting tasks information to information on the locks that are being held. Initially, it might seem more logical to join on session_id rather than resource_address, but remember that the goal is to determine what resource contention is occurring; what resource is locked and therefore causing waits for other sessions that need to acquire locks on the object in contention.
From here, we can join to other session/transaction-related views in order to arrive, ultimately, at a big picture overview of locks that may be causing blocking problems, the sessions and statements that caused those locks to be acquired and those that are blocked as a result. The resulting script, shown in Listing 6, will present both the blocking and blocked requests on the same row, and so provide a very easy way to spot, analyze, and diagnose blocking issues.
|
1 2 3 4 5 6 7 8 9 10 11 12 13 14 15 16 17 18 19 20 21 22 23 24 25 26 27 28 29 30 31 32 33 34 35 36 37 38 39 40 41 42 43 44 45 46 |
USE [AdventureWorks] ; GO SELECT DTL.[resource_type] AS [resource type] , CASE WHEN DTL.[resource_type] IN ( 'DATABASE', 'FILE', 'METADATA' ) THEN DTL.[resource_type] WHEN DTL.[resource_type] = 'OBJECT' THEN OBJECT_NAME(DTL.resource_associated_entity_id) WHEN DTL.[resource_type] IN ( 'KEY', 'PAGE', 'RID' ) THEN ( SELECT OBJECT_NAME([object_id]) FROM sys.partitions WHERE sys.partitions.[hobt_id] = DTL.[resource_associated_entity_id] ) ELSE 'Unidentified' END AS [Parent Object] , DTL.[request_mode] AS [Lock Type] , DTL.[request_status] AS [Request Status] , DOWT.[wait_duration_ms] AS [wait duration ms] , DOWT.[wait_type] AS [wait type] , DOWT.[session_id] AS [blocked session id] , DES_blocked.[login_name] AS [blocked_user] , SUBSTRING(dest_blocked.text, der.statement_start_offset / 2, ( CASE WHEN der.statement_end_offset = -1 THEN DATALENGTH(dest_blocked.text) ELSE der.statement_end_offset END - der.statement_start_offset ) / 2 AS [blocked_command] , DOWT.[blocking_session_id] AS [blocking session id] , DES_blocking.[login_name] AS [blocking user] , DEST_blocking.[text] AS [blocking command] , DOWT.resource_description AS [blocking resource detail] FROM sys.dm_tran_locks DTL INNER JOIN sys.dm_os_waiting_tasks DOWT ON DTL.lock_owner_address = DOWT.resource_address INNER JOIN sys.[dm_exec_requests] DER ON DOWT.[session_id] = DER.[session_id] INNER JOIN sys.dm_exec_sessions DES_blocked ON DOWT.[session_id] = DES_Blocked.[session_id] INNER JOIN sys.dm_exec_sessions DES_blocking ON DOWT.[blocking_session_id] = DES_Blocking.[session_id] INNER JOIN sys.dm_exec_connections DEC ON DTL.[request_session_id] = DEC.[most_recent_session_id] CROSS APPLY sys.dm_exec_sql_text(DEC.[most_recent_sql_handle]) AS DEST_Blocking CROSS APPLY sys.dm_exec_sql_text(DER.sql_handle) AS DEST_Blocked WHERE DTL.[resource_database_id] = DB_ID() |
Listing 6: Investigating locking and blocking based on waiting tasks
To see it in action, we’ll set up some activity on the Production.Culture table of the AdventureWorks database. It’s a narrow table with three columns and two indexes, one clustered index on the primary key and one unique non-clustered index on the Name column. Additionally, there is a DEFAULT constraint on the ModifiedDate column that sets the value to the results of the getdate() function.
Open a tab in SSMS and execute the query shown in Listing 7. This is our blocking session.
|
1 2 3 4 5 |
BEGIN TRANSACTION UPDATE Production.Culture SET Name = 'English-British' WHERE Name = 'English' ; --ROLLBACK TRANSACTION |
Listing 7: An uncommitted UPDATE transaction on the Production.Culture table
In a separate session, execute the code in Listing 8, to read data from the same table.
|
1 2 3 |
SELECT ModifiedDate FROM Production.Culture WHERE Name = 'English' ; |
Listing 8: A blocked query against the Production.Culture table
Finally, in a third session, INSERT a new value into the same table and then read the table.
|
1 2 3 4 5 6 |
INSERT INTO Production.Culture ( CultureID, Name ) VALUES ( 'jp', 'Japanese' ) ; SELECT * FROM Production.Culture ; |
Listing 9:An INSERT against the Production.Culture table
Having executed all three queries, run the DMO script in Listing 6. What we expect to see is that the UPDATE query blocks both subsequent SELECT queries from the other sessions, but not the INSERT, as confirmed by the results shown in Figure 4.
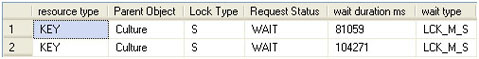
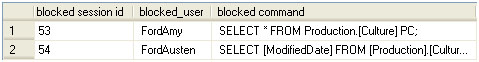

Figure 4: Blocking in AdventureWorks.
This script is one of my favorites; it provides exactly what I need to know. The first half of the results displays information regarding who and what is being blocked, while the second half of the results provides metrics regarding who and what is doing the blocking.
The final column, resource_description (aliased in the results as “blocking resource detail”) provides a value that concatenates the lock type, object type and id, database id, lock id, lock type, and parent/associated object id for the lock. Quite a bit of information for a single column wouldn’t you say? This is a result of the denormalized nature of the information that this column stores. The problem is in parsing the values in it; any universal process to do so is undocumented at this time, and we can only hope that at some point (SQL 11 perhaps) Microsoft makes it easier to parse the information, or normalizes the information by adding columns to sys.dm_os_waiting_tasks.
The value of the script really becomes evident when one encounters a multi-session blocking situation. Figure 5 show how it can reveal a real-life blocking chain (one I encountered just today on one of my servers). I’ve omitted all security and identifier columns for my environment, but the remaining data is real.
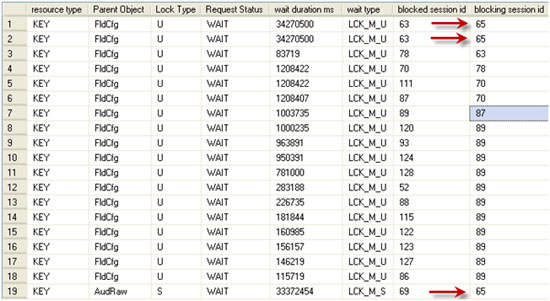
Figure 5: A real-life blocking chain.
Session 65 was blocking session 63, which in turn blocked session 78, which blocked 70, which blocked both 111 and 87. Session 87 blocked session 89, which, in turn, blocked about ten other sessions. My DMO script revealed that session 65 was the root cause of the blocking, and the command text returned for this session revealed that I could safely kill that session. Having done so, and by the time I switched query windows in SSMS to re-execute the DMO query, the results were clean. All blocking had been resolved.
Analyzing Transactional Activity
There are three DMVs that allow us to monitor active transactions on our SQL Server instances and, in particular, long-running transactions, as well as those transaction that are causing the transaction log to grow rapidly:
- sys.dm_tran_session_transactions – is primarily an intermediate view that allows us to join the sys.dm_exec DMVs (identified primarily on the session_id column) with the other sys.dm_tran_* DMVs
- sys.dm_tran_active_transactions – stores transactional information relating to status, type, and state of each transaction currently initiated but not yet completed, on the SQL instance; it also provides information on distributed transactions though some of the DTC-centric columns have been deprecated in SQL Server 2008
- sys.dm_tran_database_transactions – stores much of the same information in regard to transaction state, status, and type; but also provides extremely granular transaction log metrics and record count and size metadata.
Over the coming sections we’ll very briefly review some of the more interesting columns in these DMVs, and then provide some sample troubleshooting scripts. Please refer to the relevant section of Books Online for a full column description for each DMV.
Transactional DMOs vs. DBCC OPENTRAN
Prior to SQL Server 2005, most DBAs used the DBCC OPENTRAN command to return information regarding currently open transactions on their SQL Server instances. I continue to use DBCC OPENTRAN for the purpose for which it was designed: to provide information about the oldest transaction still active in a specific database. This tool is a one-trick pony, however. The scripts we’re going to use based upon the DMVs provide a wealth of extra information. For more information on the syntax and use of DBCC OPENTRAN please visit Microsoft Books Online.
sys.dm_tran_session_transactions
As stated, this view is used primarily for joining the sys.dm_exec_* DMVs to the sys.dm_tran_* DMVs we’re discussing here.
- session_id – identifies the session to which the transaction belongs. The session_id may be the most important column for this particular DMV as it allows us to join transactional metadata with, for example, the execution-related DMOs, as well as the sys.sysprocesses system compatibility view (as spid).
- transaction_id – just as session_id allows us to join back to the various sys.dm_exec_ DMVs, so transaction_id allows the join to the myriad of sys.dm_tran_ DMVs we discuss in this article. This provides the link between sessions and transactions, from a logical perspective, allowing the DBA to make associations between user sessions and requests and the transactions they run, in terms of their activity, characteristics, and locking behavior.
The only other column that we’ll mention here is is_user_transaction, which denotes whether the transaction is a user-initiated transaction (1) or a system transaction (0). This is particularly valuable when we wish to isolate only user transactions. Other columns allow us to exclude or isolate distributed, enlisted, or bound transactions, as required by our circumstances.
Listing 10 illustrates a very simple query against this DMV, just to illustrate the sort of result set returned for current transactions on the active session.
|
1 2 3 4 5 6 7 8 9 10 11 12 13 14 |
BEGIN TRANSACTION SELECT DTST.[session_id] , DTST.[transaction_id] , DTST.[is_user_transaction] FROM sys.[dm_tran_session_transactions] AS DTST WHERE DTST.[session_id] = @@SPID ORDER BY DTST.[transaction_id] COMMIT session_id transaction_id is_user_transaction ----------- -------------------- ------------------- 56 1550381 1 (1 row(s) affected) |
Listing 10: Basic query against sys.dm_tran_session_transactions for transactions on the current session.
sys.dm_tran_active_transactions
The sys.dm_tran_active_transactions DMV returns a list of all transactions that are active at the time the query is executed. This view operates at the scope of the entire SQL instance, meaning that results are returned for all databases on the instance. Since this view provides a point-in-time snapshot of currently active transactions, the results will change each time the query is executed, depending upon the state of the individual transactions.
Identification columns returned by this view are transaction_id, which uniquely identifies a transaction across the entire SQL Server instance, and name, which is the name of the transaction. I consider it a good habit, if not a best practice, to name transactions, as the following code snippet demonstrates:
|
1 2 3 |
BEGIN TRANSACTION Trans_Name --Some SQL Code goes here COMMIT TRANSACTION Trans_Name |
In this example, Trans_Name will be returned as the value for the name column for this record in sys.dm_tran_active_transactions, assuming the transaction is still active when you issue a query against this DMV. If the transaction is not explicitly named, this column will be populated by values such as SELECT, INSERT, UPDATE, DELETE in the case of those Data Modification Language (DML) transactions. You’ll also see Worktable as a value when returning results from tempdb for the hashing and temp/intermediate transactional processing that occurs there. Finally, you will see the value of DTCXACT for unnamed distributed transactions.
This DMV also returns the time that the transaction was started (transaction_begin_time), as well as columns that indentify the type (transaction_type) and state (transaction_state, or dtc_state for distributed transactions). These type and state columns return integer values, the meanings of which are deciphered in the sample query shown in Listing 11.
|
1 2 3 4 5 6 7 8 9 10 11 12 13 14 15 16 17 18 19 20 21 22 23 24 25 26 27 28 29 30 31 32 |
SELECT DTAT.transaction_id , DTAT.[name] , DTAT.transaction_begin_time , CASE DTAT.transaction_type WHEN 1 THEN 'Read/write' WHEN 2 THEN 'Read-only' WHEN 3 THEN 'System' WHEN 4 THEN 'Distributed' END AS transaction_type , CASE DTAT.transaction_state WHEN 0 THEN 'Not fully initialized' WHEN 1 THEN 'Initialized, not started' WHEN 2 THEN 'Active' WHEN 3 THEN 'Ended' -- only applies to read-only transactions WHEN 4 THEN 'Commit initiated'-- distributed transactions only WHEN 5 THEN 'Prepared, awaiting resolution' WHEN 6 THEN 'Committed' WHEN 7 THEN 'Rolling back' WHEN 8 THEN 'Rolled back' END AS transaction_state , CASE DTAT.dtc_state WHEN 1 THEN 'Active' WHEN 2 THEN 'Prepared' WHEN 3 THEN 'Committed' WHEN 4 THEN 'Aborted' WHEN 5 THEN 'Recovered' END AS dtc_state FROM sys.dm_tran_active_transactions DTAT INNER JOIN sys.dm_tran_session_transactions DTST ON DTAT.transaction_id = DTST.transaction_id WHERE [DTST].[is_user_transaction] = 1 ORDER BY DTAT.transaction_begin_time |
Listing 11: Querying sys.dm_db_tran_active_transactions.
Notice that we are able to isolate user transactions via a join back to sys.dm_tran_session_transactions, filtering on the is_user_transaction column. The results of this query are shown in Figure 6.
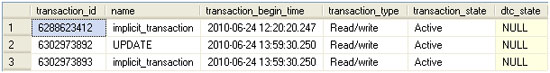
Figure 6: Currently active user transactions.
Had we not filtered out transactions associated with system sessions, we’d also have see results for hash work being performed in tempdb, similar to the record shown in Figure 7.

Figure 7: Worktable transaction records in sys.dm_db_tran_active_transactions.
Queries against sys.dm_tran_active_transactions will often return a great number of results that look like this, since these worktables are created and destroyed all the time on our SQL instances as a result of sorting and hashing intermediate results sets before returning them to an end-user.
An alternative way to eliminate the worktables would be to add a predicate to the name column, as the code snippet in Listing 12 demonstrates.
|
1 2 3 4 |
... FROM sys.dm_tran_active_transactions DTAT WHERE DTAT.name <> 'worktable' ORDER BY DTAT.transaction_begin_time |
Listing 12: Eliminating worktables from the results returned by active_transactions.
While information regarding the transaction start time, type and the current state of the transaction may be valuable, it is rare to query this DMV in isolation, as it provides an incomplete picture of transactional activity. We cannot tell, for example, the databases on which these transactions are running, the sessions or users that are running them, or the statements that comprise each transaction. To retrieve this information, we’ll need to join DMVs via the transaction_id column, as will be demonstrated shortly.
sys.dm_tran_database_transactions
The sys.dm_tran_database_transactions DMV is server-scoped (the name is deceptive) and provides detailed information about the transactions occurring on your SQL Server instance. Like the sys.dm_db_tran_active_transactions view, it provides point-in-time snapshot data, so the results may vary each time the view is queried. A cursory glance at the available columns may lead one to assume that the data retuned will be similar to that provided by the sys.dm_tran_active_transactions view. In fact, however, sys.dm_tran_database_transactions provides a much more granular level of detail about each transaction and gives “physical presence” to a transaction, in that it returns information about how it is using the transaction log file.
Alongside a transaction_id column, the DMV exposes a database_id column, which identifies the database to which the transaction is associated. Occasionally, for example when isolating issues associated with just those databases using a particular isolation level or recovery model, it is useful to use this column to join to the sys.database system catalog view in order to return such columns as the snapshot_isolation_state, recovery_model, and so on. The database_id column can also be used as the sole parameter of the DB_NAME() function, in order to return the name of the database.
Like the active_transactions DMV, the database_transactions DMV also exposes columns describing the type (database_transaction_type) and state (database_transaction_state) of a transaction. The integer values returned must be “decoded” in our queries, as demonstrated for the state column by the code snippet in Listing 13.
|
1 2 3 4 5 6 7 8 |
CASE SDTDT.database_transaction_state WHEN 1 THEN 'Not initialized' WHEN 3 THEN 'initialized, but not producing log records' WHEN 4 THEN 'Producing log records' WHEN 5 THEN 'Prepared' WHEN 10 THEN 'Committed' WHEN 11 THEN 'Rolled back' WHEN 12 THEN 'Commit in process' |
Listing 13: Decoding the integer values returned by database_transaction_state.
Below is a list of some of the other important columns available through sys.dm_tran_database_transactions that allow us to investigate long-running transactions, as well as use and abuse of the transaction log.
- database_transaction_begin_time – time at which the transaction began producing log records. Note that this may not be the same as the time when the transaction was initiated, as there may be a delay between a transaction being initiated and it starting processing, if required resources are locked or if there is a wait for server resources such as CPU.
- database_transaction_log_record_count – number of log records for the transaction at the time the query executed. Note that, if the value of database_transaction_state is 5 or less, the transaction will still be producing log records, so the value of database_transaction_log_record_count will not be equal to the total number of records that will be generated by the transaction.
- database_transaction_log_bytes_used – amount of bytes this transaction currently contributes to the total used in the transaction log for the database.
- database_transaction_log_bytes_reserved – bytes reserved in the log for this transaction.
- database_transaction_begin_lsn, database_transaction_last_lsn – Log Sequence Number (LSN) of the first and last records in the log for this transaction.
- database_transaction_most_recent_savepoint_lsn – if savepoints are used, this is the most recent one that can be rolled back to. Savepoints are not discussed further in this article.
- database_transaction_commit_lsn – the LSN that recorded the commit for the transaction.
- database_transaction_last_rollback_lsn – if a rollback has occurred, this is the most recent LSN that the transaction was rolled back to. If there was no rollback, the value will be the last LSN recorded in the log.
- database_transaction_next_undo_lsn – during the undo portion of a recovery, this will be the LSN to be rolled back (undone).
Assessing transaction log impact
The sys.dm_tran_database_transactions DMV is the only one that provides insight into the effects of user activity on the database transaction logs. Using this DMV, and joining across to other transaction-related and execution-related DMVs, as described previously, we can develop a query, shown in Listing 14, which will identify all active transactions and their physical effect on the databases’ transaction logs. This is especially useful when seeking out transactions that may be causing explosive transaction log growth.
|
1 2 3 4 5 6 7 8 9 10 11 12 13 14 15 16 17 18 19 20 21 22 23 24 25 26 27 28 29 30 31 32 33 34 35 36 37 38 39 40 41 42 |
SELECT DTST.[session_id], DES.[login_name] AS [Login Name], DB_NAME (DTDT.database_id) AS [Database], DTDT.[database_transaction_begin_time] AS [Begin Time], -- DATEDIFF(ms,DTDT.[database_transaction_begin_time], GETDATE()) AS [Duration ms], CASE DTAT.transaction_type WHEN 1 THEN 'Read/write' WHEN 2 THEN 'Read-only' WHEN 3 THEN 'System' WHEN 4 THEN 'Distributed' END AS [Transaction Type], CASE DTAT.transaction_state WHEN 0 THEN 'Not fully initialized' WHEN 1 THEN 'Initialized, not started' WHEN 2 THEN 'Active' WHEN 3 THEN 'Ended' WHEN 4 THEN 'Commit initiated' WHEN 5 THEN 'Prepared, awaiting resolution' WHEN 6 THEN 'Committed' WHEN 7 THEN 'Rolling back' WHEN 8 THEN 'Rolled back' END AS [Transaction State], DTDT.[database_transaction_log_record_count] AS [Log Records], DTDT.[database_transaction_log_bytes_used] AS [Log Bytes Used], DTDT.[database_transaction_log_bytes_reserved] AS [Log Bytes RSVPd], DEST.[text] AS [Last Transaction Text], DEQP.[query_plan] AS [Last Query Plan] FROM sys.dm_tran_database_transactions DTDT INNER JOIN sys.dm_tran_session_transactions DTST ON DTST.[transaction_id] = DTDT.[transaction_id] INNER JOIN sys.[dm_tran_active_transactions] DTAT ON DTST.[transaction_id] = DTAT.[transaction_id] INNER JOIN sys.[dm_exec_sessions] DES ON DES.[session_id] = DTST.[session_id] INNER JOIN sys.dm_exec_connections DEC ON DEC.[session_id] = DTST.[session_id] LEFT JOIN sys.dm_exec_requests DER ON DER.[session_id] = DTST.[session_id] CROSS APPLY sys.dm_exec_sql_text (DEC.[most_recent_sql_handle]) AS DEST OUTER APPLY sys.dm_exec_query_plan (DER.[plan_handle]) AS DEQP ORDER BY DTDT.[database_transaction_log_bytes_used] DESC; -- ORDER BY [Duration ms] DESC; |
Listing 14: Transaction log impact of active transactions.
Note the use of OUTER APPLY to join to sys.dm_exec_query_plan. The OUTER APPLY functions as a hybrid of OUTER JOIN and CROSS APPLY in that it will return NULL if no value is returned by the function. This prevents the entire row from being excluded from the result set in cases where a plan does not exist for the request (the request may no longer exist in sys.dm_exec_requests by the time Listing 14 is run). Sample output from this Listing is shown in Figure 8.
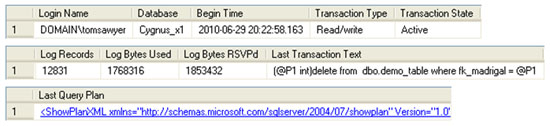
Figure 8: Transactions writing heavily to the transaction log.
Simply by un-commenting the calculation of the transaction duration, in Listing 14, and swapping the ORDER BY clause, we can investigate the activity of long-running transactions that may be bloating the transaction log file, or preventing it from being truncated.
Summary
The sys.dm_tran-prefixed Dynamic Management Objects have a broad scope in SQL Server. They not only span the range of DMOs associated with activity at the transactional level of the query engine, but also expose locking and blocking between user sessions, as well as exposing the effects and existence of snapshot isolation in your SQL Server database and the instance in general.
Via queries against sys.dm_tran_locks, joining to various sys.dm_exec-prefixed DMOs as well as sys.dm_os_waiting_tasks, we were able to diagnose locking and blocking occurring within our SQL databases.
Using sys.dm_tran_session_transactions we were able to correlate session-based results from sys.dm_exec_connections, sys.dm_exec_sessions, and sys.dm_exec_requests with data from the sys.dm_tran-prefixed DMOs. Using sys.dm_tran_active_transactions and sys.dm_tran_database_transactions, we collected metrics on the duration and status of our users’ transactions, and observed the physical effects of those transactions on the database transaction log files on disk.
This article is adapted from a chapter of ‘Performance Tuning with SQL Server Dynamic Management Views’ by Louis Davidson and Tim Ford. To learn more about this book, visit the Amazon page.