The series so far:
- Introduction to SQL Server Security — Part 1
- Introduction to SQL Server Security — Part 2
- Introduction to SQL Server Security — Part 3
- Introduction to SQL Server Security — Part 4
- Introduction to SQL Server Security — Part 5
- Introduction to SQL Server Security — Part 6
SQL Server offers a wide range of tools for ensuring that your environment remains secure and that privacy is protected. In the last article in this series, I covered some of the system views and functions that can help you safeguard that environment.
In this article, I continue the discussion by providing an overview of five other important features: SQL Server Configuration Manager, server-level facets, the sp_configure system stored procedure, the SQL Vulnerability Assessment tool, and the SQL Data Discovery & Classification tool. As with any SQL Server tools, the better you understand how to use these features, the more effectively you can protect your databases and the data they contain.
SQL Server Configuration Manager
SQL Server Configuration Manager is a Microsoft Management Console snap-in that lets you manage the services, network protocols, and network connectivity configurations associated with a SQL Server instance. Through this tool, you can start, pause, resume, or stop services, or you can view or change service properties. You can also enable or disable connection protocols, force protocol encryption, or configure SQL Server to listen on a specific port, pipe, or network protocol.
Figure 1 shows SQL Server Configuration Manager with the SQL Server Services node selected. You can navigate through any of the nodes, as well as drill into specific services or configurations, where you can view or modify property settings.
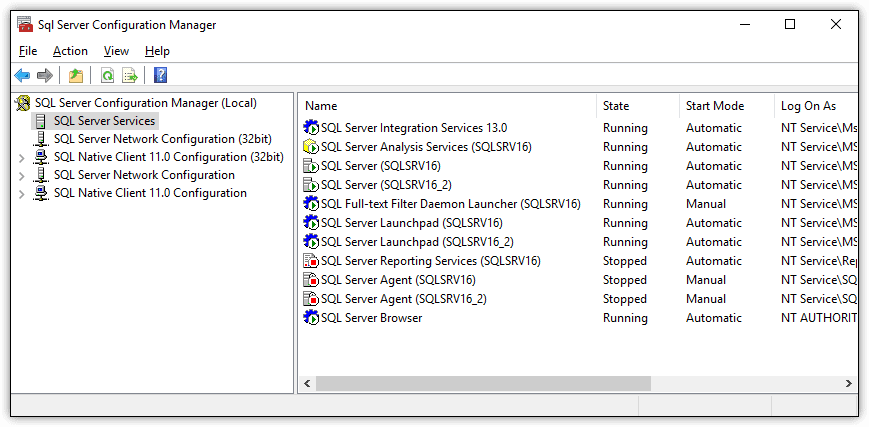
Figure 1. Viewing services and configurations in SQL Server Configuration Manager
To access a component’s properties, double-click the listing in the right pane. For example, one of the services shown in Figure 1 is SQL Server (SQLSRV16), which is a running instance of SQL Server 2016. When I double-click the service, the SQL Server (SQLSRV16) Properties dialog box appears, as shown in Figure 2.
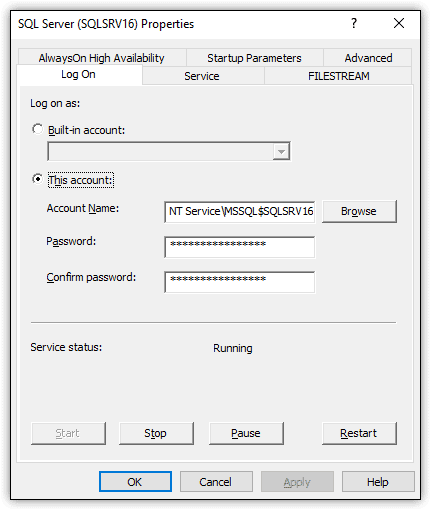
Figure 2. Viewing service details in SQL Server Configuration Manager
The options available in the Properties dialog box depend on the selected service or configuration. In this case, the dialog box opens to the Log On tab, where you can start, stop, pause, and restart the service. You can also change the service account or update the password.
The other tabs provide additional options. For example, on the Service tab, you can set the service to start automatically, specify that the service must be started manually, or disable the service altogether.
SQL Server Configuration Manager is a good place to start for handling services, network protocols, and network connectivity configurations all in one interface. The interface is simple to use and is a lot easier than wading through all a system’s services to find those specific to SQL Server.
SQL Server Configuration Facets
In SQL Server Management Studio (SSMS), you can configure several server-wide facets related to SQL Server security. A facet is a collection of logical properties that apply to a specific area of management.
To access the server-level facets, right-click the SQL Server instance name in Object Explorer and then click Facets. When the View Facets dialog box appears, select the Surface Area Configuration facet from the Facet drop-down list. The main window displays the properties associated with the selected facet, as shown in Figure 3.
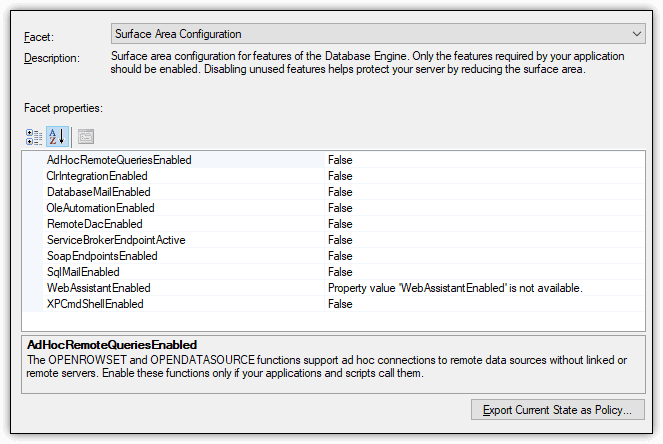
Figure 3. Accessing the Surface Area Configuration facet
As the name suggests, the Surface Area Configuration facet provides quick access to surface area configuration settings. Here you can enable or disable features as necessary, the idea being that you should disable any unnecessary features to reduce the surface area. For example, you can configure the SqlMailEnabled property, which supports legacy applications that exchange email messages with the database engine.
Another useful facet is Server Security, which is shown in Figure 4. Here you can enable or disable security-related properties that apply at the server-level, such as the CrossDBOwnershipChainingEnabled property, which controls cross-database ownership chaining. Currently, the property is set to False, so chaining is not permitted.
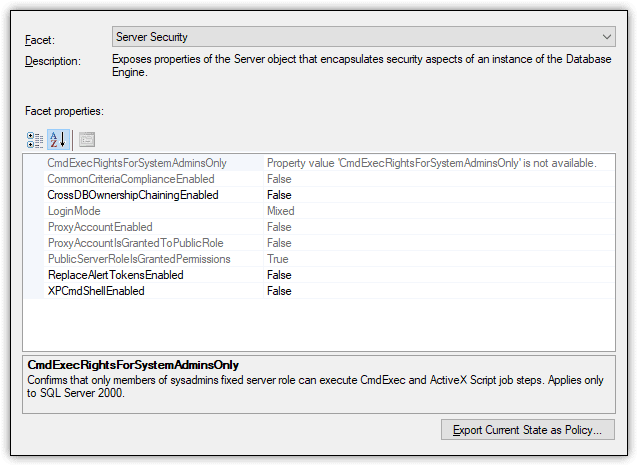
Figure 4. Accessing the Server Security facet properties
In the View Facets dialog box, you can also access a number of other facets, such as Server Audit and Server Configuration. Facets provide a quick and easy way to adjust settings from within SSMS. However, you can also use the sp_configure stored procedure to set database engine options, which provides more flexibility for controlling SQL Server settings.
SQL Server sp_configure Stored Procedure
The sp_configure system stored procedure lets you view or modify server-wide configuration settings. When used to modify a setting, the stored procedure is often executed in conjunction with a RECONFIGURE statement, which applies the new setting immediately to the server environment—if the setting is dynamic. If it’s not dynamic, the new setting does not take effect until the SQL Server service has been restarted.
You can use the sys.configurations system view to determine whether a setting is dynamic. The view also returns other important information about configuration settings. The following SELECT statement uses the sys.configurations view to return details about the server-wide configuration settings available to the current SQL Server instance:
|
1 2 3 |
USE master; GO SELECT * FROM sys.configurations; |
Figure 5 shows part of the results returned by the SELECT statement on my system, a local instance of SQL Server 2017. The statement returns a total of 77 rows.
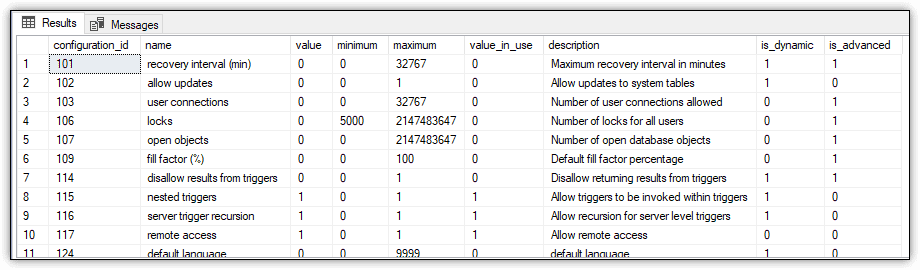
Figure 5. Viewing all server-wide configuration options
In addition to the name and description of each setting, the sys.configurations view returns several other columns, which have implications when using the sp_configure stored procedure:
- The
valuecolumn is the option’s configured value. - The
minimumcolumn is the option’s permitted minimal value. - The
maximumcolumn is the option’s permitted maximum value. - The
value_in_usecolumn is the value currently in effect. This value can be different from the one in thevaluecolumn if the value has been set but not yet committed. - The
is_dynamiccolumn specifies whether the configuration setting is dynamic. A dynamic setting has a value of1. - The
is_advancedcolumn indicates whether the option is an advanced option. An advanced option has a value of1. Thesp_configurestored procedure can access advanced options only if theshowadvancedoptionssetting has been enabled.
You’ll get a better sense of the implications of these columns as you work through this article. However, first, run the following EXECUTE statement, which calls the sp_configure stored procedure without any parameters:
|
1 |
EXEC sp_configure; |
When you call the procedure without parameters, it returns a list of server-wide configuration options. Figure 6 shows part of the results returned on my system. The statement returned 23 rows in all.
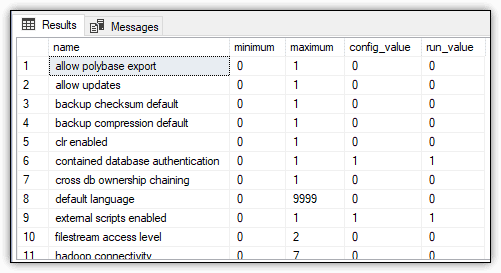
Figure 6. Viewing non-advanced server-wide configuration options
The procedure’s config_value column maps to the value column returned by the sys.configurations view, and the procedure’s run_value column maps to the view’s value_in_use column.
The reason that sp_configure returns only 23 rows on my system is because the show advanced options setting was not enabled. To enable the setting and then view the results, run the following set of T-SQL statements:
|
1 2 3 4 5 |
EXEC sp_configure 'show advanced options', '1'; GO RECONFIGURE; GO EXEC sp_configure; |
The first EXECUTE statement runs the sp_configure stored procedure and sets the value of the show advanced options setting to 1. When you use the stored procedure to update an option value, you must first specify the option name and then the new value, both in single quotes and separated by a comma.
After you reset the value, you can run a RECONFIGURE statement to apply the value immediately. This is possible because the show advanced options setting is a dynamic option, that is, the is_dynamic value is set to 1.
The last step is to again call the sp_configure stored procedure without parameters to return a list of available configuration settings. This time, the EXECUTE statement returns all 77 settings, just like the sys.configurations view.
In some cases, SQL Server doesn’t allow you to use the RECONFIGURE statement to apply a value to a configuration setting, even if that value falls within the permitted minimum and maximum values. To see how this works, start by retrieving information about the recovery interval (min) setting, which determines the maximum recovery interval in minutes:
|
1 |
EXEC sp_configure 'recovery interval (min)'; |
When you call sp_configure and specify only the setting name, it returns information about the setting without making any changes. In this case, the stored procedure returns 0 as both the configured and run values, 0 as the minimum allowed value, and 32767 as the maximum allowed value.
Based on this information, it would seem that you should be able to set the option’s value to 120 minutes, as in the following example:
|
1 2 3 4 |
EXEC sp_configure 'recovery interval (min)', '120'; GO RECONFIGURE; GO |
However, when you run the statement, SQL Server returns the following message:
|
1 2 |
Recovery intervals above 60 minutes not recommended. Use the RECONFIGURE WITH OVERRIDE statement to force this configuration. |
For certain configuration settings, SQL Server determines what might be an acceptable range, even if the setting supports a greater range. In some cases, you can override this behaviour by using a RECONFIGURE WITH OVERRIDE statement, rather than just RECONFIGURE:
|
1 2 3 4 |
EXEC sp_configure 'recovery interval (min)', '120'; GO RECONFIGURE WITH OVERRIDE; GO |
This time around, SQL Server returns a more favorable message:
|
1 2 |
Configuration option 'recovery interval (min)' changed from 120 to 120. Run the RECONFIGURE statement to install. |
The RECONFIGURE WITH OVERRIDE statement can be useful in cases when you need to bypass the usual safeguards, but be careful when using this option. Setting a value incorrectly can seriously impact SQL Server’s configuration, so proceed with caution.
In the meantime, if you want to reset the recovery interval (min) setting back to its original value, run the following statements:
|
1 2 3 4 |
EXEC sp_configure 'recovery interval (min)', '0'; GO RECONFIGURE; GO |
The configuration setting should now have the same value it had when you first verified the setting’s values.
SQL Vulnerability Assessment
SQL Vulnerability Assessment is a tool available in SSMS that lets you scan a database for potential vulnerabilities. The scan runs a number of security checks and then presents them in a report that shows which checks failed and which ones passed. For the failed checks, the tool also provides actionable steps for resolving the issue.
The security checks are derived from a set of rules based on Microsoft best practices that are specific to permissions, configurations, and data protections. The rules focus on security issues that present the biggest data risks and that reflect many of the requirements necessary to meet compliance standards.
To launch a SQL Vulnerability Assessment scan, right-click the database in Object Explorer, point to Tasks, point Vulnerability Assessment, and click Scan for Vulnerabilities. The assessment results appear in their own tab in the main SSMS window, categorised by those that passed and those that failed.
Figure 7 shows the assessment results I received when I scanned the WideWorldImporters sample database on my system. The security checks shown in the figure are the ones that failed. The tool categorises failed checks as High Risk, Medium Risk, and Low Risk.
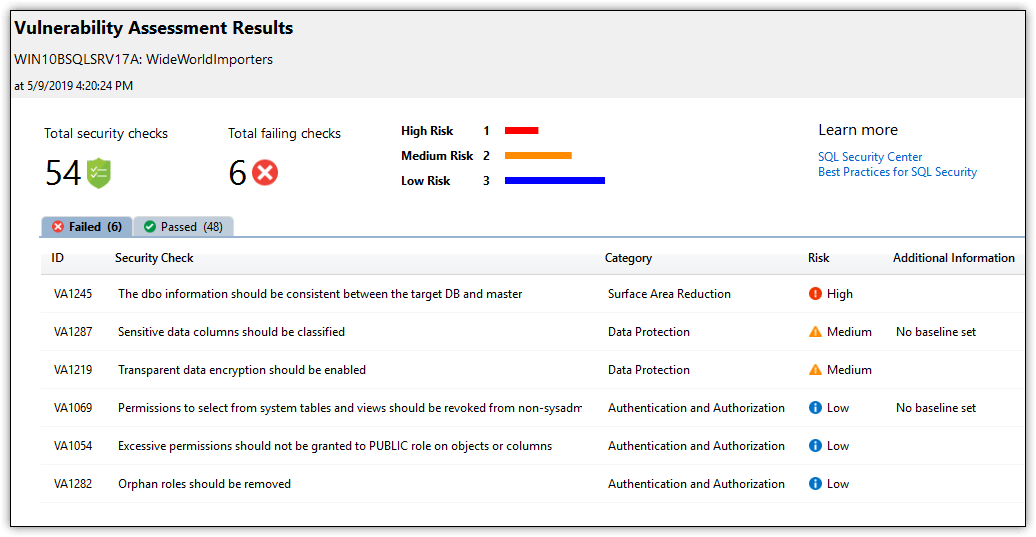
Figure 7. Viewing failed assessments in a vulnerability report
The figure also indicates that the tool performed 54 security checks in all and that six of them failed. To view the security checks that passed, select the Passed tab, which is shown in Figure 8.
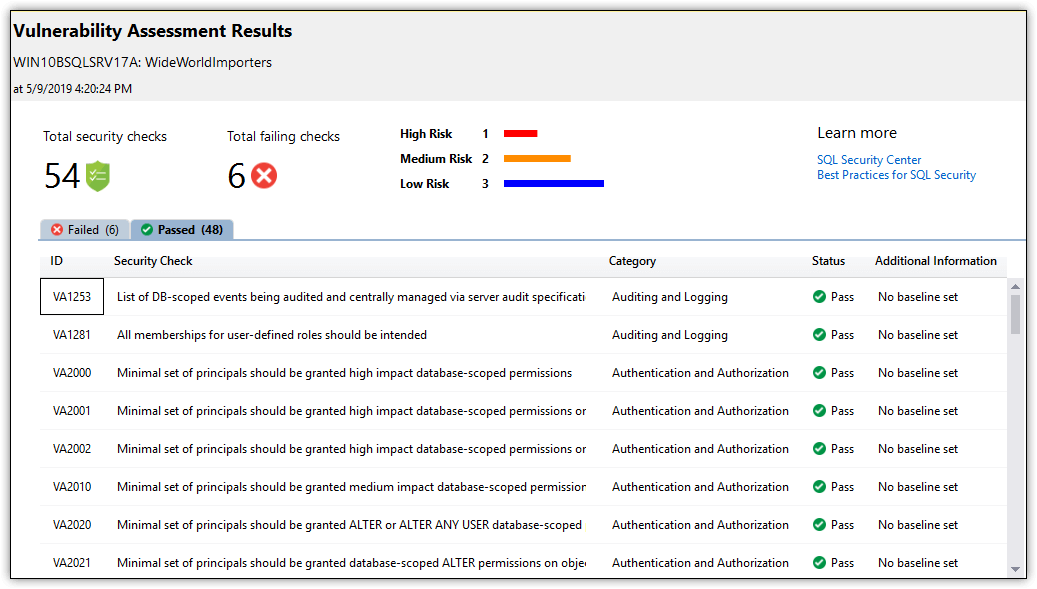
Figure 8. Viewing passed assessments in a vulnerability report
You can drill into any of the security checks for more details. For example, the last failed security check shown in Figure 7 is VA1282, which is titled Orphan roles should be removed. If you expand the security check and scroll to the bottom, you’ll find the recommended remediation and remediation script, as shown in Figure 9.
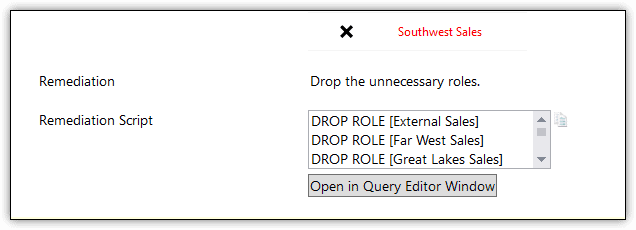
Figure 9. Viewing the recommended remediation for a failed assessment
The SQL Vulnerability Assessment tool also lets you adjust a security check’s baselines. For example, you might decide that you do not want to drop the orphan roles shown in Figure 9 because you plan to use them in the near future. In this case, you can approve the security check as a baseline so it won’t show as failed in subsequent scans.
To approve a baseline, expand the security check as you did above but do not scroll down. At the top of the description, click the Approve as Baseline option, which is shown in Figure 10.
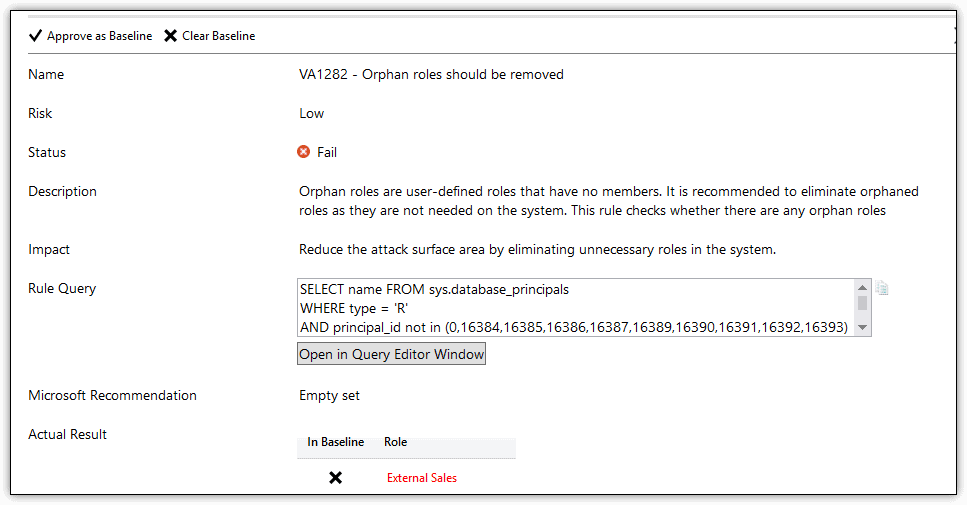
Figure 10. Approving baselines for a failed assessment
After you set the baseline, rerun the scan. The results should now indicate that only five checks failed. In addition, the VA1282 security check should be listed on the Passed tab, as shown in Figure 11.
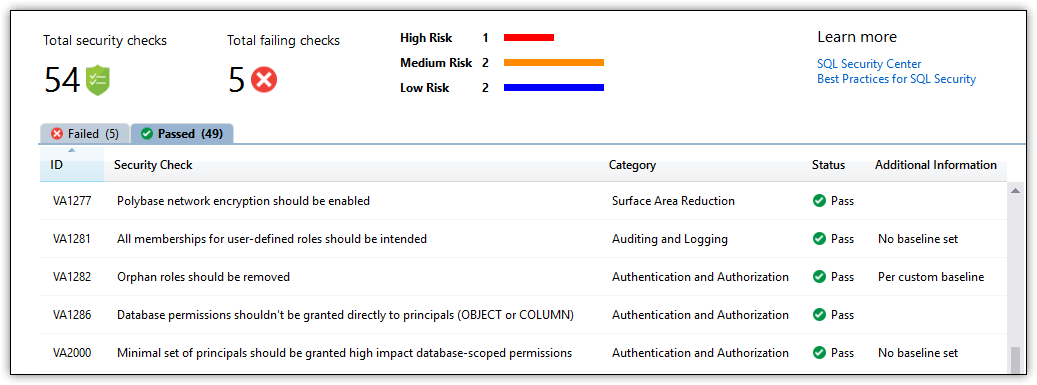
Figure 11. Rerunning a vulnerability assessment report
The SQL Vulnerability Assessment tool provides you with a quick and easy way to track and remediate potential database vulnerabilities, helping you meet compliance and privacy standards while reducing potential security risks.
SQL Data Discovery & Classification
Microsoft has also recently added the Data Discovery & Classification tool to SSMS. The tool provides a mechanism for discovering and classifying potentially sensitive information in a database. From these classifications, you can run a report that can be used for compliance and auditing purposes.
The process of classifying sensitive data starts by using the Data Discovery & Classification feature to run a scan against the target database. To run a scan, right-click the database in Object Explorer, point to Tasks, and then click Classify Data. A tab will open in the main SSMS window, showing that the scan is in progress.
When the scan is complete, the tab will display the number of columns with recommended classifications. Figure 12 shows the tab after I ran the scan against the WideWorldImporters database. In this case, the Data Discovery & Classification tool has provided classification recommendations for 92 columns.
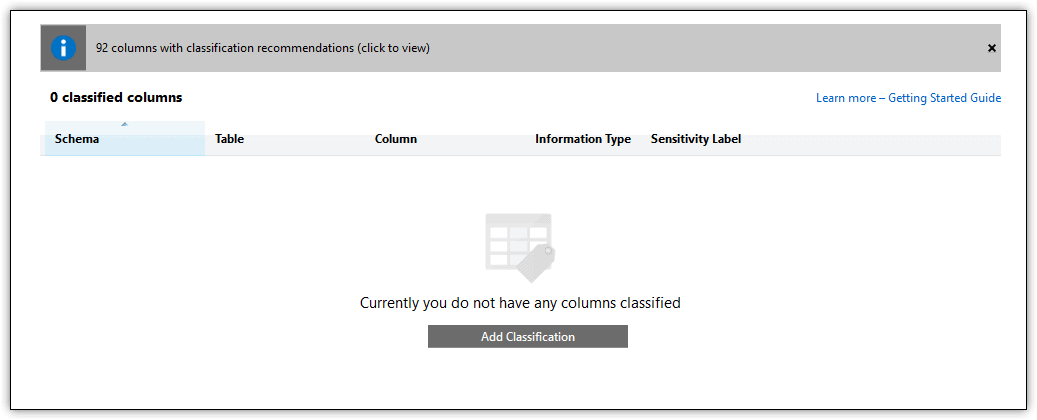
Figure 12. Running a SQL Data Discovery & Classification report
If you click the information message that shows the number of recommendations, the tab will display the list of columns, with recommendations for the information type and sensitivity label. Figure 13 shows a partial list of the column recommendations.
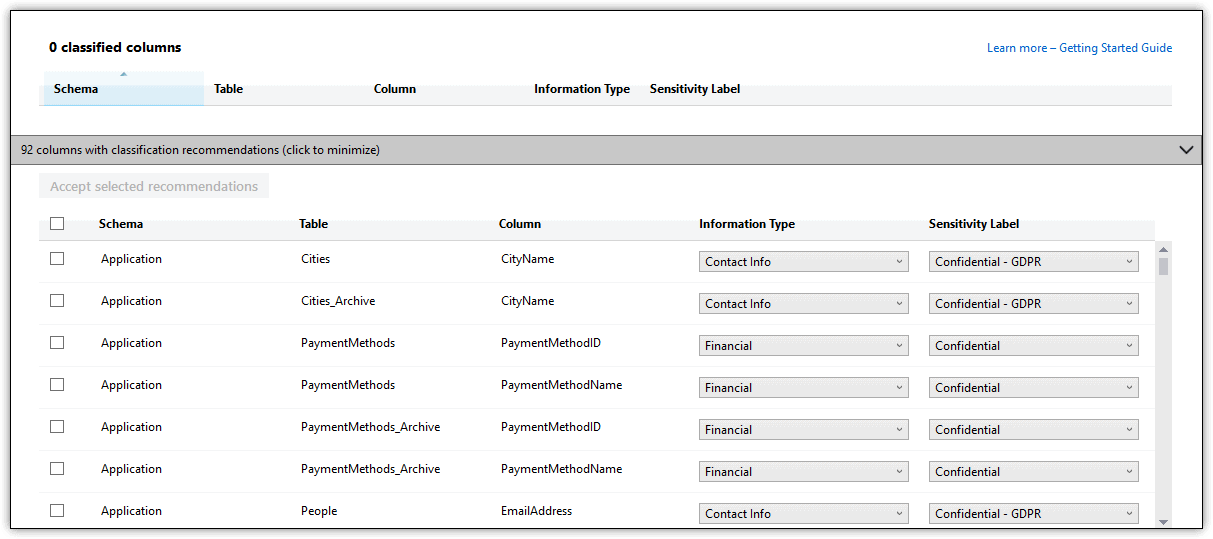
Figure 13. Viewing the recommended classifications in a report
For each recommended column, you can accept the Information Type value and Sensitivity Label value or choose from the list of available values. In addition, you must select the check box associated with each column that you want to classify and then click Apply selected recommendations.
On my system, I selected the checkbox associated with the first six columns shown in Figure 13 and kept the recommended values for the first two. For the other four, I changed the Sensitivity Label value to Highly Confidential – GDPR and then clicked Accept selected recommendations. This left me with six classified columns.
The Data Discovery & Classification tool also lets you manually classify columns. To add a manual classification, click Add Classification at the top of the tab. When the Add Classification form appears (to the right of the tab), set up your classification. For example, I added the classification shown in Figure 14.
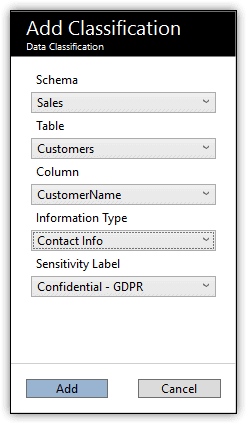
Figure 14. Adding a classification
All classifications that you accept or add manually are listed in the tab, as shown in Figure 15. Here you can further modify them or delete them. Whether or not you make any changes, you must specifically save the classifications to retain them with the database. To do so, click Save at the top of the tab.
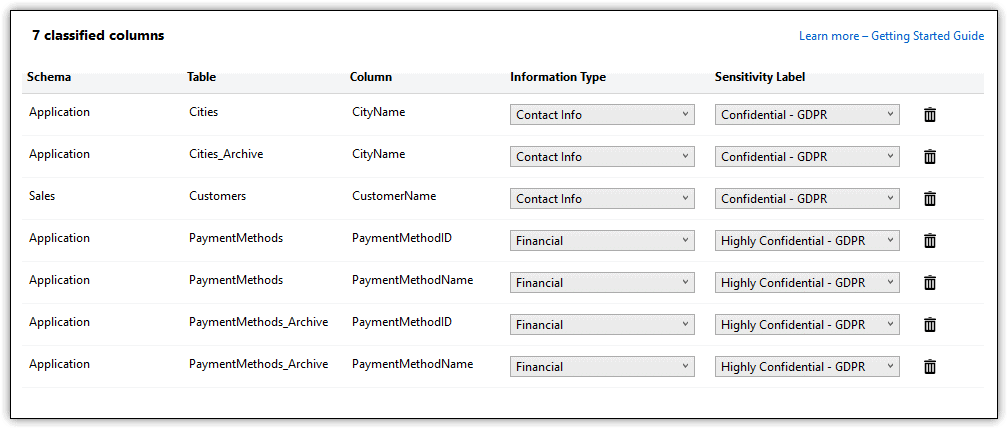
Figure 15. Viewing the approved classifications
The Data Discovery & Classification tool also lets you generate reports that show how the columns have been classified. To generate a report, click View Report at the top of the tab. Figure 16 shows the report I generated on my system after setting up the seven classifications.
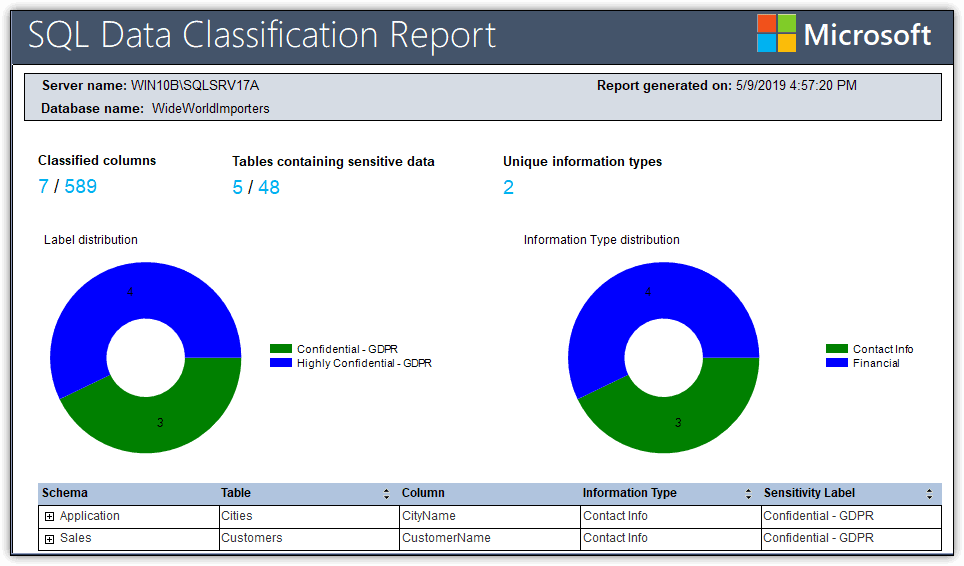
Figure 16. Generating a data classification report
You can drill into details about the classifications in the grid at the bottom of the report. For example, the Application schema includes six classifications. If you expand the schema, you can view the individual columns and their classifications.
More SQL Server Security Tools
SQL Server provides plenty of other tools beyond what I’ve discussed here or in the other articles in this series. For example, SQL Server offers SQL Server Audit, row-level security, and policy-based management, features that have been well-covered by Feodor Georgiev, Louis Davidson, and Dennes Torres, respectively.
Encryption also plays an important role in SQL Server security, taking a variety of forms, including column-level encryption and transparent data encryption. I wrote a series about several encryption-related topics a while back:
- Encrypting SQL Server: Using an Encryption Hierarchy to Protect Column Data
- Encrypting SQL Server: Transparent Data Encryption (TDE)
- SQL Server Encryption: Always Encrypted
- Encrypting SQL Server: Dynamic Data Masking
The better you understand the tools available to you for securing your database environment, the more effectively you can protect privacy, meet compliance requirements, and safeguard your data at all levels. It might take a bit of time to get comfortable with some of these tools, but the investment you make now could well be worth the effort in the future.