The series so far:
- Introduction to DAX for paginated reports
- How to filter DAX for paginated reports
- DAX table functions for paginated reports: Part 1
- DAX table functions for paginated reports: Part 2
- Tips and tricks with DAX table functions in paginated reports
In the previous article of this short series, you learned the fundamentals of creating datasets using DAX to populate paginated reports delivered using the Power BI Premium service. The next step is to appreciate the practicalities – and subtleties – of how data can be filtered using DAX for paginated report output.
As most, if not all, report developers come from an SQL background, it may seem overkill to devote an entire article to filtering data. However, DAX is very unlike SQL as far as filtering output data is concerned. Something as simple as classic OR logic needs to be handled differently from the techniques you may be used to – either as a SQL or as a Power BI developer. To ensure that you can deliver the report data that you need to populate paginated reports, take a detailed look at how to filter data in DAX datasets using the core SUMMARIZECOLUMNS() function.
Like all the articles in this series, this article uses a sample dataset named CarsDataWarehouse.Pbix that you can download and use as the basis for practicing and testing DAX data output techniques. If you wish to understand the dataset structure, please refer to the first article in the series.
Basic Data Output to SSRS Using SUMMARIZECOLUMNS()
One positive thing that I can say about the Power BI Report Builder Query Designer is that it introduces you to the core DAX function that you are likely to use when developing DAX queries for paginated reports: SUMMARIZECOLUMNS().
SUMMARIZECOLUMNS() is probably the DAX function that most people generally use to produce tables of data – which makes it an ideal function to query Power BI dataset data for SSRS reports. By a happy coincidence, Report Builder also uses the function to generate DAX. Consequently, it is the default option for report developers who need to use DAX data sources.
SUMMARIZECOLUMNS() is so powerful because it allows you to assemble, filter, and aggregate data from a Power BI dataset into a single tabular output for paginated reports. Indeed, it requires that you apply these elements in a specific order inside the SUMMARIZECOLUMNS() function:
- A list of fields from the data model
- Any required Filters
- Any required Aggregations
It is worth noting that parts (2) & (3) in this list are optional. You do not have to filter data or add aggregations and can simply use SUMMARIZECOLUMNS() to output the list of data you need. This means that any of the following approaches will work.
Column List Only
Suppose all you want to do is return a list of columns to a paginated report. In that case, you can manually write code like the following DAX snippet developed in DAX Studio that you then test and subsequently copy and paste into Power BI Report Builder. Of course, when I say “manually” write code, I mean search for the fields, drag and drop them into the query pane, and use autocomplete to enter any DAX keywords.
|
1 2 3 4 5 6 |
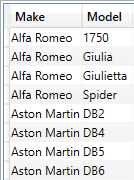
EVALUATE SUMMARIZECOLUMNS ( DimVehicle[Make] ,DimVehicle[Model] ) |
The output from this short piece of DAX is (in a shortened form):
While looking at core DAX for report output, it is perhaps worth a quick detour to explain the EVALUATE function. This function is the DAX statement needed to execute a query and return data. In simple DAX queries, all that you need to do is to start the query with the keyword EVALUATE. As queries become more intricate (and as you will discover in the course of these four articles), this initial approach can be extended to handle more complex requirements.
There are a couple of points that it is worth noting at this juncture:
SUMMARIZECOLUMNS()can return data from all the tables in the underlying dataset.- A well thought out data model is a fundamental prerequisite.
- All field references must be fully qualified (table and column name).
Column list and Expressions
If you need to output not only a set of columnar data but also add some DAX calculations (which includes any measures in the underlying dataset), you will need to write code like this:
|
1 2 3 4 5 6 7 8 9 10 11 |
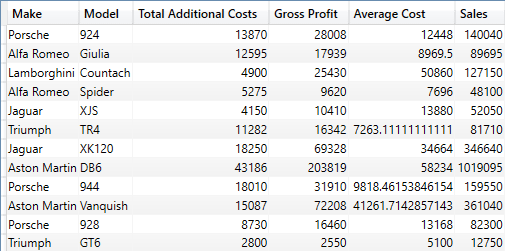
EVALUATE SUMMARIZECOLUMNS ( DimVehicle[Make] ,DimVehicle[Model] ,"Total Additional Costs" , SUM(FactSales[Total Additional Costs]) ,"Gross Profit", [Gross Profit] ,"Average Cost", AVERAGE(FactSales[CostPrice]) ,"Sales", SUM(FactSales[SalePrice]) ) |
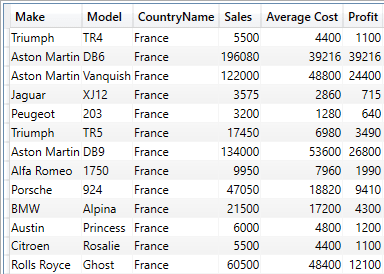
The shortened output from this piece of DAX is ideally suited to a paginated report table:
It is important in this case to respect the following constraints:
- Always place DAX calculations (which includes measures already in the dataset) after “plain” data columns.
- Calculated columns in the source data (such as the field “Total Additional Costs” in this example) are considered to be data columns. As such, they do not need a specific column name added (as is the case for measures). However, they do need an aggregation function applied.
- Expressions can be measures in the underlying dataset (like the measure “Gross Profit” in this example) or specific DAX calculations – such as the measure “Average Cost” in this example.
- You have to add a name for each calculation or measure before the measure or calculation itself. This name will become the basis for the name used in the output for the respective column.
- Measure/calculation names must be entered in double quotes and separated from the actual measure or calculation by a comma.
- Measures (such as [Gross Profit] in the previous code snippet) do not need to be fully qualified. Nor – as they are measures – do they need an aggregation function applied.
- You can mix measures from the dataset with calculations in any order provided that they follow the definition of standard data columns. That is, they must appear after the columns that are extracted.
The calculations can, of course, get much more complex than these simple examples.
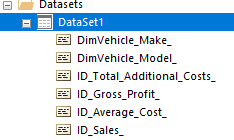
Note:
The output shown is from DAX Studio. If you use Power BI Report Builder to test the DAX you will notice that the column names are changed in the output and any calculations are preceded by ID_ – as shown in the following figure:
Column list and Filter
SUMMARIZECOLUMNS() also lets you add filters to reduce the number of records output to SSRS. You can see a simple example in the following code snippet:
|
1 2 3 4 5 6 7 8 9 10 11 |
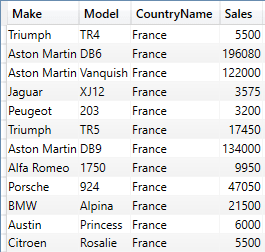
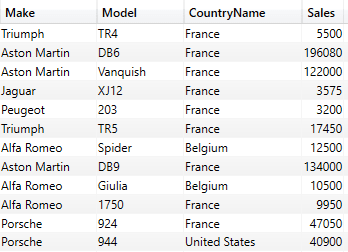
EVALUATE SUMMARIZECOLUMNS ( DimVehicle[Make] ,DimVehicle[Model] ,DimGeography[CountryName] ,FILTER( VALUES(DimGeography[CountryName]) ,DimGeography[CountryName] = "France") ,"Sales", SUM(FactSales[SalePrice]) ) |
The shortened output from this piece of DAX is:
The points of note in this simple example are:
- Any filters have to be added after columns of data and before the measures or calculations.
- Simple filters use the
FILTER()function and specify: - A table to filter (
VALUES()is used to return a unique list of elements) - The expression to be evaluated for each row of the table must equate to True or False for each row.
You do not need to output any columns used to filter data. I added the CountryName column in this code snippet only to show that the filter was working.
Column List, Filter and Aggregation
Finally, columns, filters and expressions can be combined in a SUMMARIZECOLUMNS() expression like this:
|
1 2 3 4 5 6 7 8 9 10 11 12 13 |
EVALUATE SUMMARIZECOLUMNS ( DimVehicle[Make] // Data (Column) ,DimVehicle[Model] // Data (Column) ,DimGeography[CountryName] ,FILTER( VALUES(DimGeography[CountryName]) ,DimGeography[CountryName] = "France") // Filter ,"Sales", SUM(FactSales[SalePrice]) // Calculation ,"Average Cost", AVERAGE(FactSales[CostPrice]) // Calculation ,"Profit", [Gross Profit] // Measure ) |
The shortened output from this piece of DAX is:
The key takeaway here is to respect the order of the three parts of the full SUMMARIZECOLUMNS() expression:
- Firstly – the columns of data you wish to return to SSRS.
- Secondly – Any filters
- Thirdly – Any expressions (measures from the dataset or calculations)
Filtering Approaches
Assembling output – directly from columns, existing metrics, or DAX calculations – is nearly always the easy part. Filtering the source data so that you only see exactly what you want and need is frequently where the challenges lie. This is often the case if you are new to DAX.
Consequently, the next thing to look at in greater depth is how to filter data in more complex ways inside the SUMMARIZECOLUMNS() function.
Elementary AND logic
It is worth noting that, inside the SUMMARIZECOLUMNS() function, all filters are logical AND filters – so the following DAX query returns cars sold in France that are black:
|
1 2 3 4 5 6 7 8 9 10 11 12 13 14 15 |
EVALUATE SUMMARIZECOLUMNS ( DimVehicle[Make] ,DimVehicle[Model] ,DimVehicle[Color] ,DimGeography[CountryName] ,FILTER( VALUES(DimGeography[CountryName]) ,DimGeography[CountryName] = "France") ,FILTER( VALUES(DimVehicle[Color]) ,DimVehicle[Color] = "Black") ,"Sales", SUM(FactSales[SalePrice]) ) |
The shortened output from this piece of DAX is:
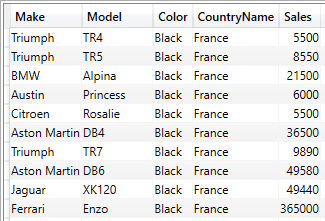
You do not need to add an AND keyword anywhere inside the DAX. Merely having two filters creates a “logical AND” clause. It is also worth remembering that you can add any number of filters in this way. It is also worth noting that you do not have to add the fields used in the FILTER() function to the output – I am doing this here simply to show that the filter works.
Note:
I am including the filter columns in the output so that it is clear that the filters work. Obviously, this affects the aggregated output. So I want to make it clear that this is not necessary (rather like you do not have to place any fields used in a SQL WHERE clause in the SELECT clause) and is only done here to show that the filter works.
Elementary OR logic
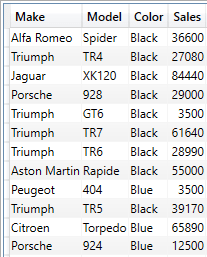
OR logic can be slightly more challenging in DAX, depending on the complexity of the query requirement. If all you want to do is to filter between only two alternatives for the same field, then there is a simple solution – the DAX OR() clause, applied like this:
|
1 2 3 4 5 6 7 8 9 10 11 12 13 |
EVALUATE SUMMARIZECOLUMNS ( DimVehicle[Make] ,DimVehicle[Model] ,DimVehicle[Color] ,FILTER( VALUES(DimVehicle[Color]) ,OR(DimVehicle[Color] = "Black" ,DimVehicle[Color] = "Blue")) ,"Sales", SUM(FactSales[SalePrice]) ) |
The shortened output from this piece of DAX is:
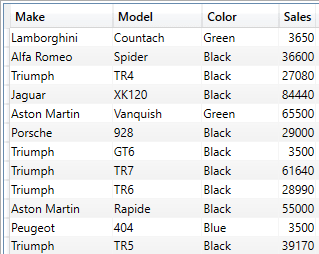
If you want to apply multiple alternatives, you can nest OR() clauses (although this can get a little clunky). A cleaner option is to use the || operator in this way:
|
1 2 3 4 5 6 7 8 9 10 11 12 13 |
EVALUATE SUMMARIZECOLUMNS ( DimVehicle[Make] ,DimVehicle[Model] ,DimVehicle[Color] ,FILTER( VALUES(DimVehicle[Color]) ,DimVehicle[Color] = "Black" || DimVehicle[Color] = "Blue" || DimVehicle[Color] = "Green") ,"Sales", SUM(FactSales[SalePrice]) ) |
The shortened output from this piece of DAX is:
A more elegant solution to multiple alternatives (still for the same field) is to use the DAX row constructor (IN) using IN {“”, “”, “”} rather than the OR operator, as you can see from the following code snippet.
|
1 2 3 4 5 6 7 8 9 10 11 12 |
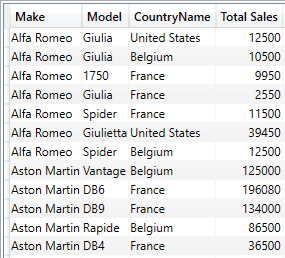
EVALUATE SUMMARIZECOLUMNS ( DimVehicle[Make] ,DimVehicle[Model] ,DimGeography[CountryName] ,FILTER( VALUES(DimGeography[CountryName]) ,DimGeography[CountryName] IN {"France", "United States", "Belgium"}) ,"Sales", SUM(FactSales[SalePrice]) ) |
The shortened output from this piece of DAX is:
All you have to do here is add the comma-separated list of elements to filter on inside curly braces after the IN keyword.
Date Filters
Dates can be used simply and easily in filters. The main points to remember are that:
- Dates must be entered in a recognised date format.
- As dates are entered as text, they have to be wrapped in the
VALUE()function to convert them into a date datatype that can be understood by DAX.
The following code snippet shows a simple date filter:
|
1 2 3 4 5 6 7 8 9 10 11 |
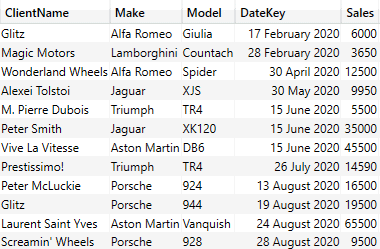
EVALUATE SUMMARIZECOLUMNS( DimCLient[ClientName] ,DimVehicle[Make] ,DimVehicle[Model] ,DimDate[DateKey] ,FILTER( VALUES(DimDate[DateKey]) ,DimDate[DateKey] >= VALUE("01/01/2020")) ,"Sales", SUM(FactSales[SalePrice]) ) |
The shortened output from this piece of DAX is:
Date ranges merely extend the approach that you just saw, using the AND function:
|
1 2 3 4 5 6 7 8 9 10 11 12 13 |
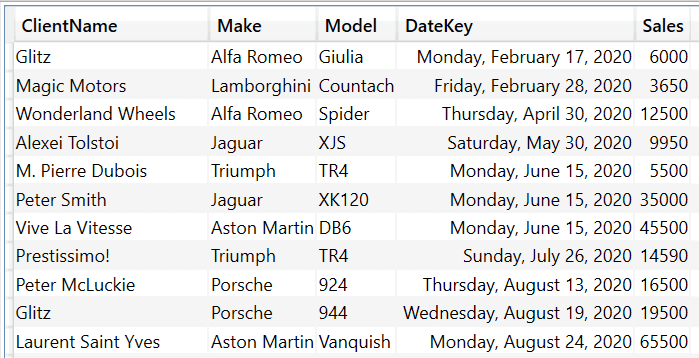
EVALUATE SUMMARIZECOLUMNS( DimCLient[ClientName] ,DimVehicle[Make] ,DimVehicle[Model] ,DimDate[DateKey] ,FILTER( VALUES(DimDate[DateKey]) ,AND(DimDate[DateKey] >= VALUE("01/01/2020") ,DimDate[DateKey]<= VALUE("12/30/2022")) ) ,"Sales", SUM(FactSales[SalePrice]) ) |
In this case the output is like this:
Or, if you prefer, the AND operator (&&) (which gives the same result so I will not repeat the display of the output):
|
1 2 3 4 5 6 7 8 9 10 11 12 13 14 |
EVALUATE SUMMARIZECOLUMNS( DimCLient[ClientName] ,DimVehicle[Make] ,DimVehicle[Model] ,DimDate[DateKey] ,FILTER( VALUES(DimDate[DateKey]) ,DimDate[DateKey] >= VALUE("01/01/2020") && DimDate[DateKey]<= VALUE("12/30/2022") ) ,"Sales", SUM(FactSales[SalePrice]) ) |
SQL “LIKE” in DAX
If you are an SSRS developer looking for the SQL LIKE operator in DAX queries, then it is worth noting that DAX has two functions that you will undoubtedly find useful. They are:
CONTAINSSTRING
CONTAINSSTRINGEXACT
The former can be applied to filter data where a string is found inside a field (regardless of the capitalisation). The latter is a case-sensitive text filter.
You can filter data to return records containing a given string using code like that shown below:
|
1 2 3 4 5 6 7 8 9 |
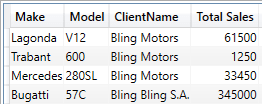
EVALUATE SUMMARIZECOLUMNS ( DimVehicle[Make] ,DimVehicle[Model] ,DimCLient[ClientName] ,FILTER(DimCLient, CONTAINSSTRING(DimCLient[ClientName], "Bling")) ,"Total Sales", SUM(FactSales[SalePrice]) ) |
The output from this short piece of DAX is:
It is worth noting that you simply replace CONTAINSSTRING with CONTAINSSTRINGEXACT to apply case-sensitivity in the filter.
NULL handling
Power BI datasets, like most data sources, can contain NULL (or empty) elements. You need to be able to filter out records where certain fields contain NULLS. This is done using the DAX ISBLANK() function, like this:
|
1 2 3 4 5 6 7 8 9 |
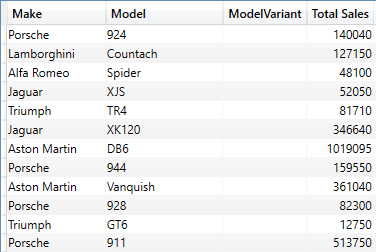
EVALUATE SUMMARIZECOLUMNS ( DimVehicle[Make] ,DimVehicle[Model] , DimVehicle[ModelVariant] ,FILTER(DimVehicle, ISBLANK(DimVehicle[ModelVariant])) ,"Total Sales", SUM(FactSales[SalePrice]) ) |
The shortened output from this short piece of DAX is:
Boolean Filters
If your Power BI dataset contains Boolean fields, you can apply a Boolean filter to exclude records like this:
|
1 2 3 4 5 6 7 8 |
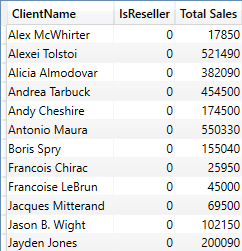
EVALUATE SUMMARIZECOLUMNS ( DimCLient[ClientName] ,DimCLient[IsReseller] ,FILTER(VALUES(DimCLient[IsReseller]), NOT DimCLient[IsReseller]) ,"Total Sales", SUM(FactSales[SalePrice]) ) |
The shortened output from this short piece of DAX is:
To display clients where the IsReseller field is True, you would use DAX like this:
|
1 |
FILTER(VALUES(DimCLient[IsReseller]), DimCLient[IsReseller]) |
Sorting Data
To conclude the whirlwind tour of basic data retrieval (developed further in the next article), you need to know how to sort the output data. This is as simple as adding ORDER BY at the end of the DAX, like this.
|
1 2 3 4 5 6 7 8 9 10 11 12 13 |
EVALUATE SUMMARIZECOLUMNS ( DimVehicle[Make] ,DimVehicle[Model] ,DimGeography[CountryName] ,FILTER( VALUES(DimGeography[CountryName]) ,DimGeography[CountryName] IN {"France", "United States", "Belgium"}) ,"Total Sales", SUM(FactSales[SalePrice]) ) ORDER BY DimVehicle[Make] |
The partial output from this short piece of DAX is:
It is worth noting that:
You can define the sort order using the ASC and DESC keywords. So, to sort the previous output in descending order, the ORDER BY clause would read: ORDER BY DimVehicle[Make] DESC
You cannot sort on a column that is not returned by the SUMMARIZECOLUMNS()function. In other words, you have to include the column to sort on in the output. However, in SSRS reports, the column used for sorting lists is virtually always displayed, in my experience. In any case, you do not have to display a column that you return to an SSRS dataset, so this is not usually a problem. It merely increases the size of the dataset returned to the report.
Conclusion
In this article, you have seen many of the core techniques that you can apply when filtering source datasets that feed into paginated reports. This ranged from simple AND filters through OR filters to NULL handling – and, of course, sorting data. The third article in this series will look in-depth at using the various DAX table functions to help you create paginated reports from a Power BI dataset.

Load comments