
When I ask that question, here are some of the things I think about:
- How many times am I going to run it? Is it a one-off task, or is it going to run thousands of times per second on the front page of a popular web site?
- What time of the day/week will it run? Are we under peak loads then, or is it an after-hours thing?
- Does this server usually do small transactional work, or is it a reporting server?
- Is my query going to hold locks while it runs?
Then, armed with those things, I measure my query in terms of:
- Duration – not just time, but also parallelism: how many cores am I tying up, and for how long?
- Reads – how much data it’s reading
- Memory grant – which can dramatically affect other running queries
To show you what I mean, I’m going to write a query in the Stack Overflow database, measure it, and decide whether it’s good enough – or whether I need to tune it to go faster.
Here’s my query.
I want to show the top 250 questions tagged SQL Server:
|
1 2 3 4 5 6 7 |
SELECT TOP 250 p.Score, p.Title, p.Id AS QuestionId, u.DisplayName FROM dbo.Posts p INNER JOIN dbo.PostTypes pt ON p.PostTypeId = pt.Id INNER JOIN dbo.Users u ON p.OwnerUserId = u.Id WHERE p.Tags LIKE '%<sql-server>%' AND pt.Type = 'Question' ORDER BY p.Score DESC; |
In order to find out if it’s good enough for production, I start by running this:
|
1 |
SET STATISTICS IO, TIME ON; |
When I run that, it enables a new set of messages in my query’s output. This is totally safe to run, even in production, and it doesn’t affect anybody else’s queries – just my own.
Then I click Query, Include Actual Execution Plan. That enables a visual representation of what SQL Server’s doing to execute the query. If you’re coming from other database platforms, you might have referred to that as a showplan or a query plan. Then, run the query.
First, look at the query’s time statistics.
When it finishes, look at the Messages tab:
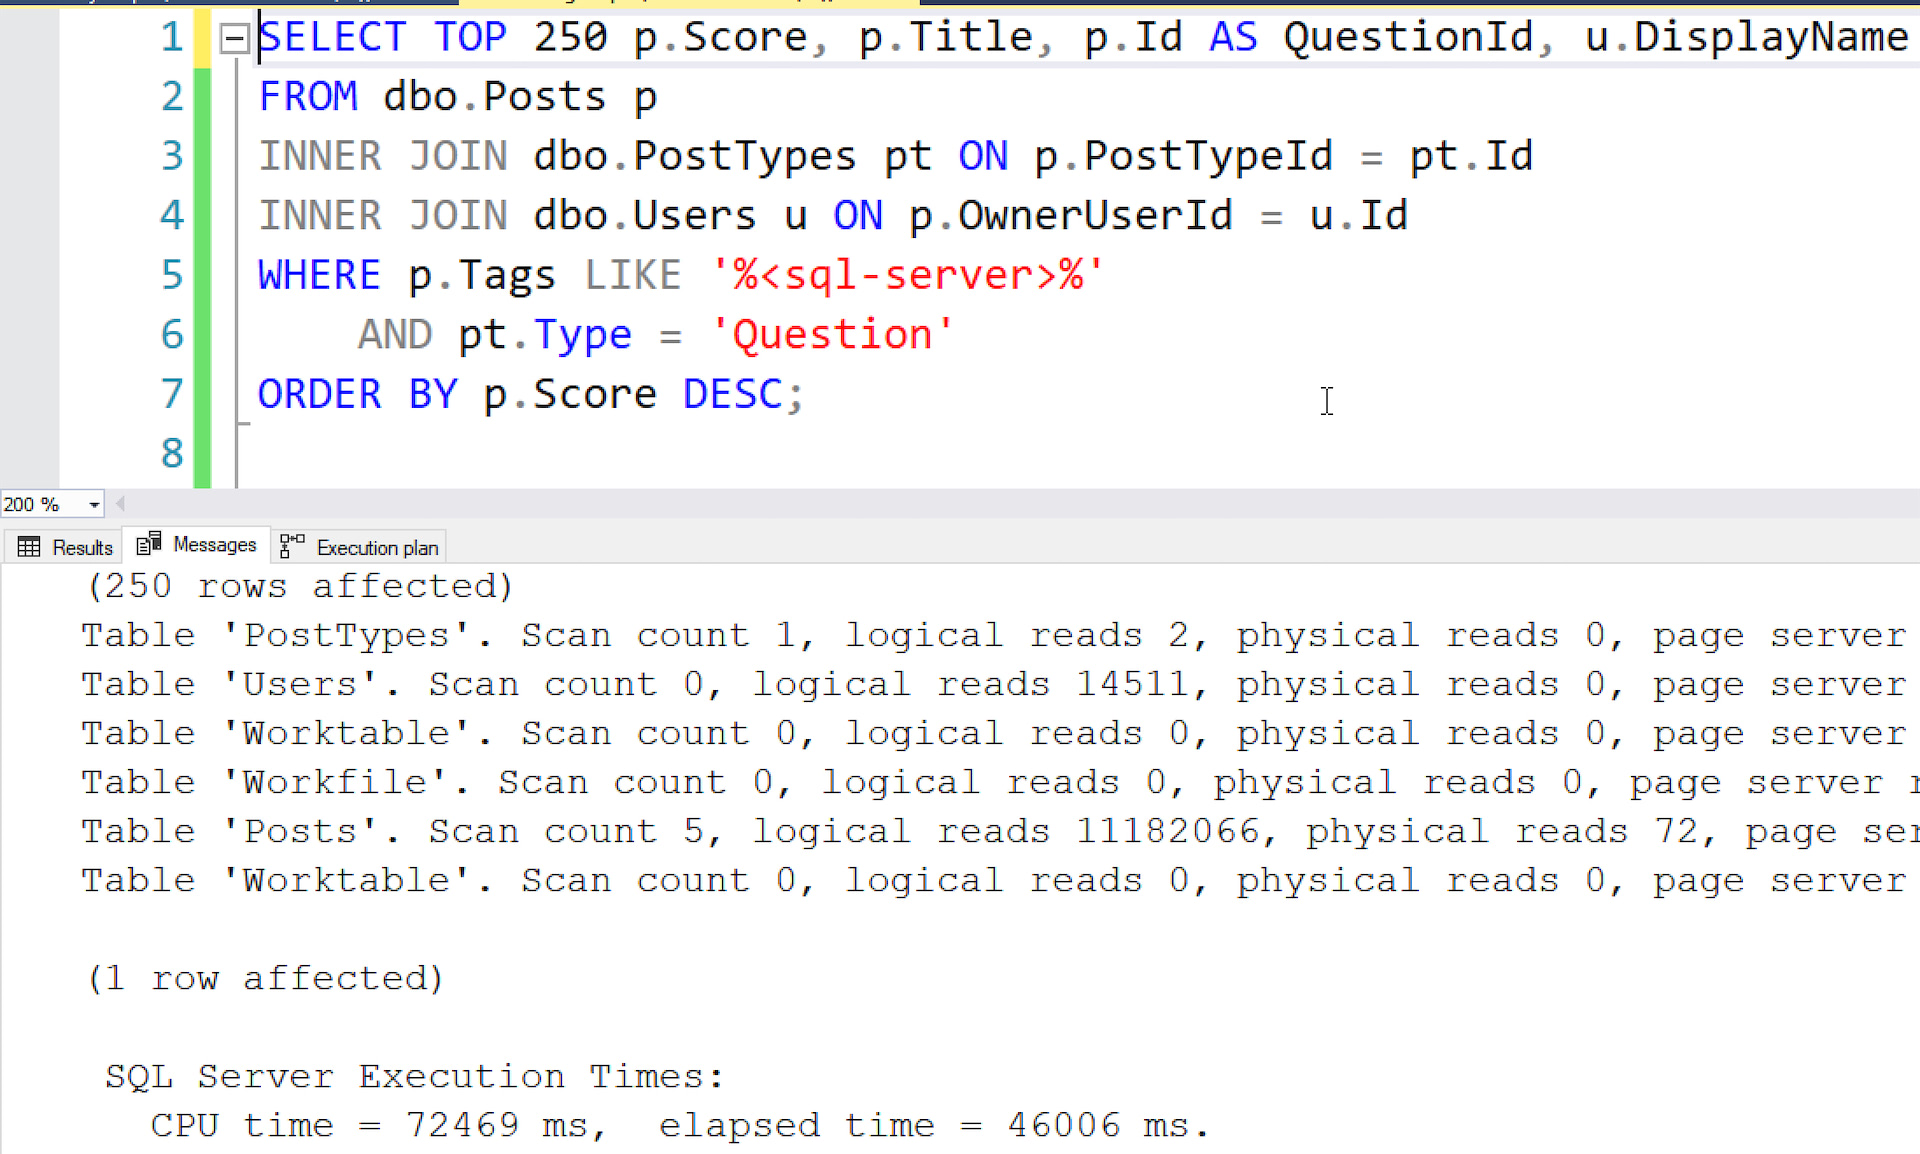
See the execution times down at the bottom of that screenshot:
|
1 2 |
SQL Server Execution Times: CPU time = 72469 ms, elapsed time = 46006 ms. |
If you’re tuning a stored proc or batch with multiple queries in it, the last set of execution times will be the total across the entire batch.
I don’t usually tune using time because it’s so unpredictable. It can vary based on:
- What else the SQL Server is doing at the time
- How much is in cache versus fetched from disk
- What else the storage is doing at the time
Plus, time numbers can vary a lot from server to server. Things to think about:
- Is your server the same size as production?
- Is your database the same size as production?
- Does your server have other differences from production, like different settings, version number, or patch level?
Because these can vary so much, I don’t care too much about exact query runtimes. When I’m looking at times, I just ask myself:
- Am I in the right ballpark? For example, if I’m writing a transactional query that accesses a small amount of data, it probably needs to finish within a second or two. If I’m writing a report, it might need to finish in 10-30 seconds.
- Is CPU time higher than elapsed time? If so, that indicates that my query went parallel across multiple CPU cores. A 5-second query that hardly does any CPU time may not be a big deal, but if it’s 5 seconds, and CPU time is 40 seconds, that indicates that my query maxed out 8 CPU cores across all 5 seconds. I’m not going to be able to run a lot of those queries, so I’m probably going to need to tune that.
Next, look at the query’s logical reads.
Closer to the top of that screenshot, SQL Server returned a row of messages for each table that we touched:
|
1 2 3 4 5 6 |
Table 'PostTypes'. Scan count 1, logical reads 2, physical reads 0, page server reads 0, read-ahead reads 0, page server read-ahead reads 0, lob logical reads 0, lob physical reads 0, lob page server reads 0, lob read-ahead reads 0, lob page server read-ahead reads 0. Table 'Users'. Scan count 0, logical reads 14511, physical reads 0, page server reads 0, read-ahead reads 2495, page server read-ahead reads 0, lob logical reads 0, lob physical reads 0, lob page server reads 0, lob read-ahead reads 0, lob page server read-ahead reads 0. Table 'Worktable'. Scan count 0, logical reads 0, physical reads 0, page server reads 0, read-ahead reads 2122, page server read-ahead reads 0, lob logical reads 0, lob physical reads 0, lob page server reads 0, lob read-ahead reads 0, lob page server read-ahead reads 0. Table 'Workfile'. Scan count 0, logical reads 0, physical reads 0, page server reads 0, read-ahead reads 0, page server read-ahead reads 0, lob logical reads 0, lob physical reads 0, lob page server reads 0, lob read-ahead reads 0, lob page server read-ahead reads 0. Table 'Posts'. Scan count 5, logical reads 11182066, physical reads 72, page server reads 0, read-ahead reads 11173658, page server read-ahead reads 0, lob logical reads 0, lob physical reads 0, lob page server reads 0, lob read-ahead reads 0, lob page server read-ahead reads 0. Table 'Worktable'. Scan count 0, logical reads 0, physical reads 0, page server reads 0, read-ahead reads 0, page server read-ahead reads 0, lob logical reads 0, lob physical reads 0, lob page server reads 0, lob read-ahead reads 0, lob page server read-ahead reads 0. |
Highlight that stuff, copy it, go over to StatisticsParser.com, and paste it. You’ll get a nice grid with totals across the entire query:
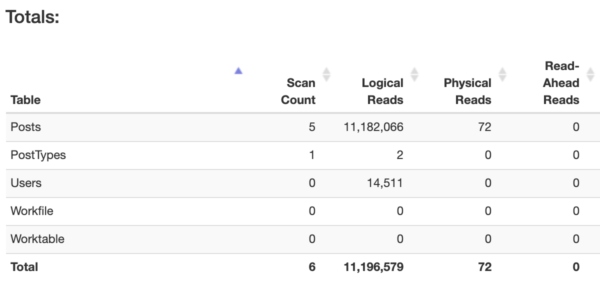
Focus on the “Logical Reads” column: that’s the number of 8KB pages that your query read – regardless of whether those pages were in memory or fetched from storage. (If you’re using columnstore indexes, you’ll also want to look at LOB Logical Reads, because columnstore indexes store their data a little differently.)
Generally speaking, the more pages your query reads, the slower it’ll go.
The more you know your own server’s workload, you’ll get a feel for the kinds of reads your server can sustain without users screaming in agony. When you’re just getting started, you might say that transactional queries doing 100,000 reads or more are probably going to be a problem. Even at way lower, they can be a problem – but if you see six-digit reads, it’s probably time to hit the brakes and do some query or index tuning. 128,000 pages is 1GB of data, and if you find yourself reading 1GB of data just to accomplish a short transaction, then it’s likely to be a problem.
For bonus points, look at the plan itself.
The more comfortable you become with query tuning, the more you can spot behaviors that you may not be comfortable with:
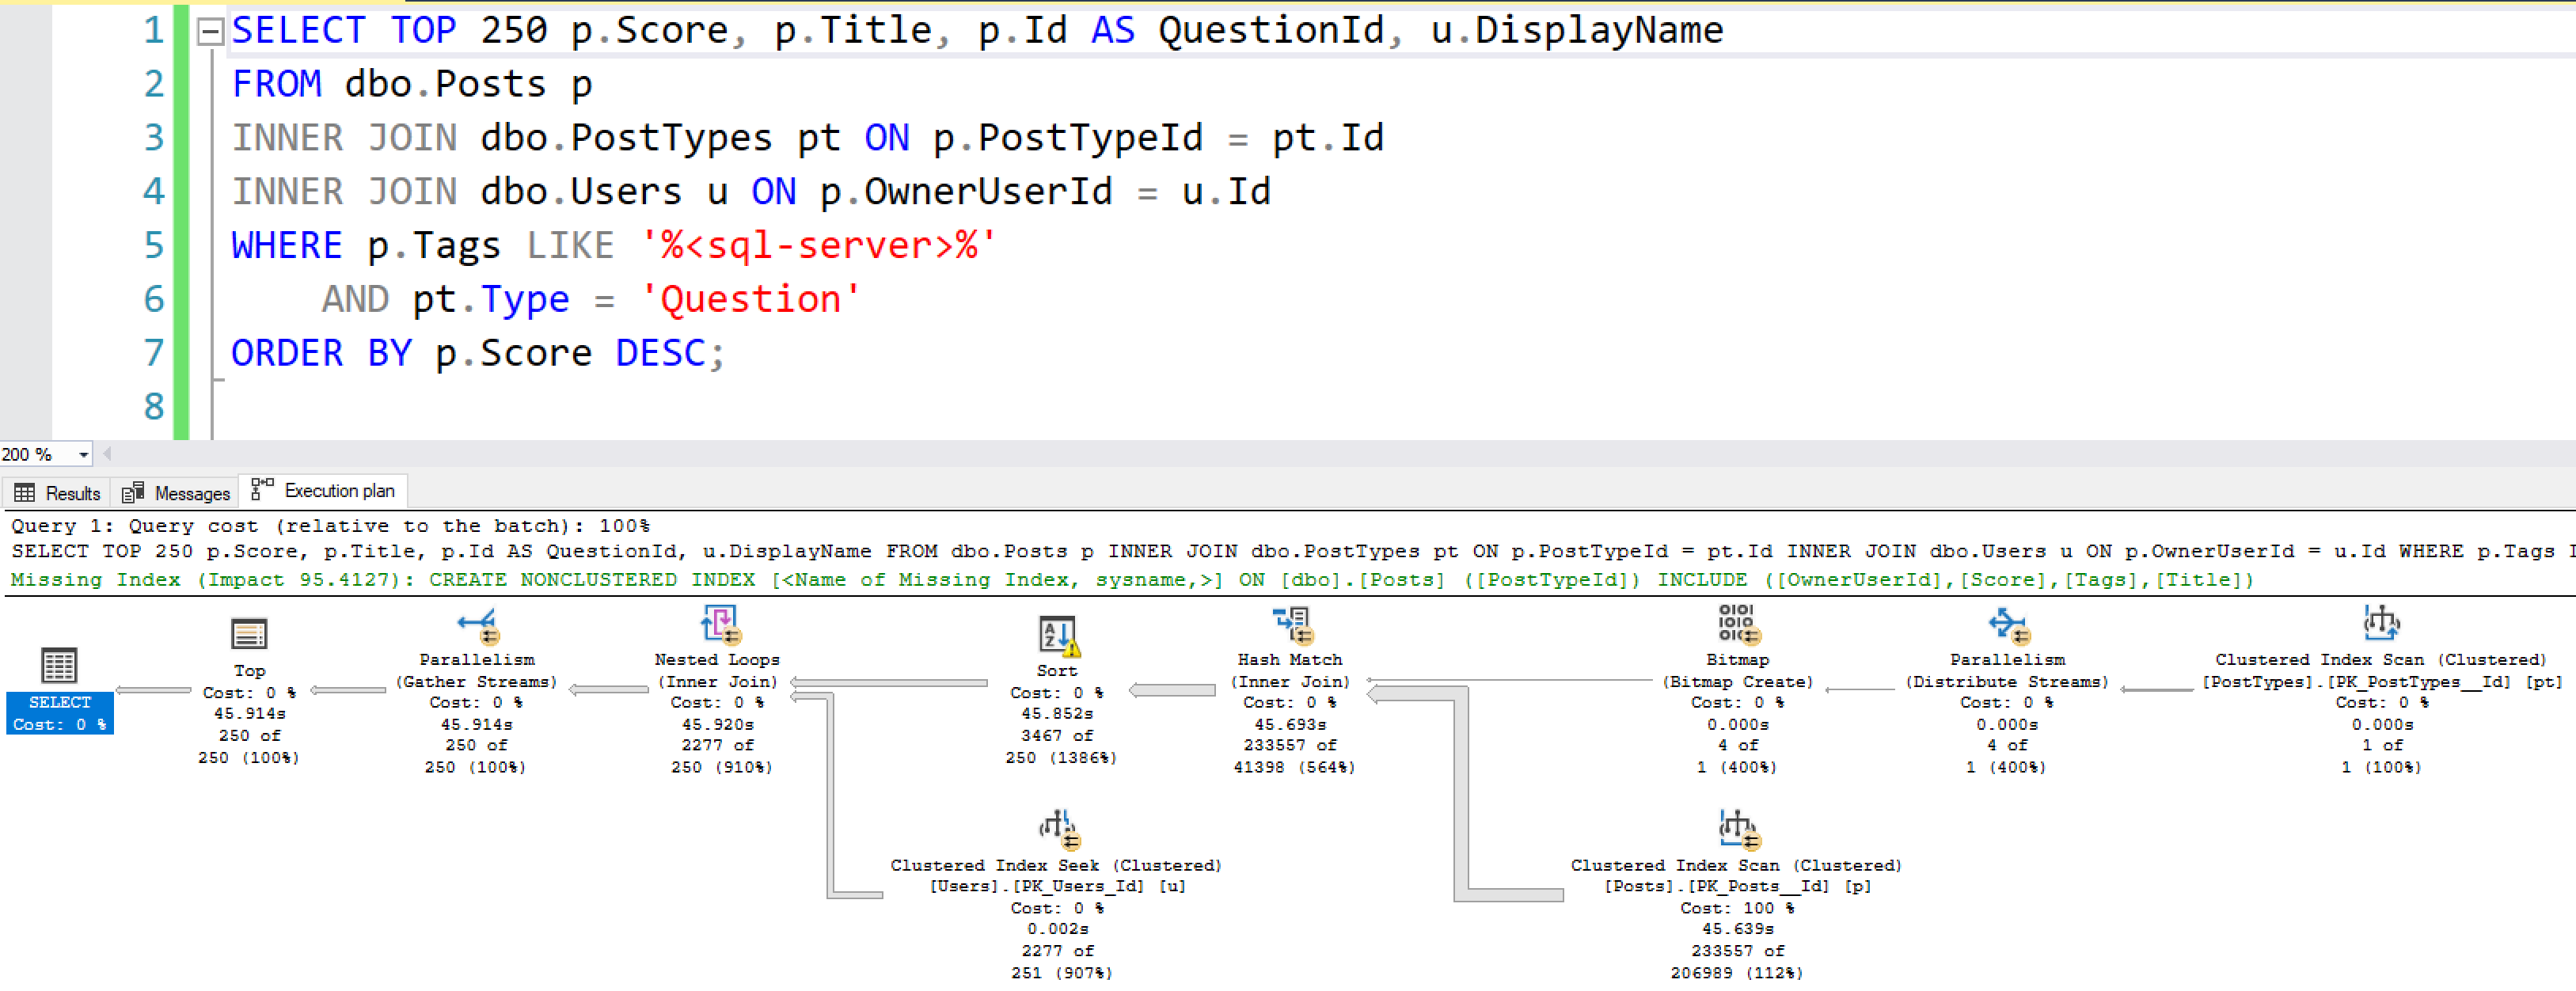
For example, in my query’s plan:
- There’s a yellow bang on the Sort operator, which indicates that my query ran out of memory and had to sort stuff in TempDB.
- There are parallelism icons on a lot of the operators, indicating that SQL Server believed it was going to be doing a lot of work, so it allocated multiple CPU cores to the task. That’s not necessarily a problem in and of itself – that might be fine on a big reporting query – but if I’m working in a transactional system where queries are expected to finish in 1-2 seconds, then I may need to tune the query or the indexes to reduce the work required.
- There are timestamps on each operator, helping to indicate which operators took the longest time. The metrics don’t mean what you think, though: Erik Darling explains that row mode and batch mode operators track time differently.
But whatever you do, don’t look at the times in the query plan.
If you right-click on the SELECT icon in the plan, then click Properties, then you’ll notice a section called QueryTimeStats, circled here:

Whatever you do, DO NOT ZOOM IN AND LOOK AT THAT:
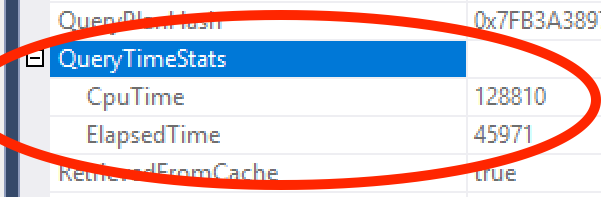
Because if you do, you’re going to start asking questions like, “Why don’t these CPU & elapsed time statistics match what I saw over on the Messages tab?”
And then you’re going to realize that all this data is built on a throne of lies, and none of us are really sure that any of these numbers are right. Just keep it simple, focus on logical reads. (They’re not technically accurate either: those don’t show reads done by most user-defined functions, for example, but there’s just only so much I can teach you in a single blog post.)

17 Comments. Leave new
I actually cant wait to show this Article to an intern/newbie. I was going to go over some basics about query tuning and this Sums up everything i was going to go over. Plus, i always make a point to show newbies your site – kills 2 birds with one stone.
Agreed! Just sent this out to my team. Thanks Brent!
SELECT TOP 250 p.Score, p.Title, p.Id AS QuestionId, u.DisplayName
FROM dbo.Posts p
INNER JOIN dbo.PostTypes pt ON p.PostTypeId = pt.Id
INNER JOIN dbo.Users u ON p.OwnerUserId = u.Id
WHERE p.Tags LIKE ‘%%’
AND pt.Type = ‘Question’
ORDER BY p.Score DESC;
I think you probably need to rethink your entire design. The Data model is wrong.
1) Sometimes the magic Kabbalah universal “id” refers to list of types or to a user. Have you ever heard of the law of identity? It’s a basic principle of logic says a thing is itself and that to be nothing in particular or everything in general , is to be nothing at all. So you’re ever morphing “id” is a serious problem in fundamental logic..
2) Postfixes like “_type”, or “_id” are what ISO calls attribute properties. This is another result of the law of identity. That means that things like “type_id” is absurd; it can be a type or can be an identifier, but it can’t be the identifier of the type. Would you keep going with this and maybe add another property, so you can have things like “type_id_value”? If you want to see examples how absurd this can be, read Lewis Carroll’s “Through the Looking Glass” and pay attention to the white knight’s speech when he talks about a song.
3) Any kind of “_type” is an attribute measured on a nominal scale, and shouldn’t have its own table in a join. In a properly designed database. This would be a REFERENCES to a lookup table or a CHECK() constraint.
4) Since we have no DDL or sample data, I am going to make a guess that your vague “Tags” column is a comma separated list. So don’t even have a table in first normal form. I hope I’m wrong.
Here’s an attempt at a normalized schema skeleton:
CREATE TABLE Posts
(post_id ?? NOT NULL PRIMARY KEY,
post_type VARCHAR(??) NOT NULL
CHECK (post_type IN (??),
user_id VARCHAR(??) NOT NULL
REFERENCES Users(user_id),
post_score INTEGER NOT NULL
CHECK(post_score >= 0),
..);
CREATE TABLE Tags
(post_tag CHAR(??) NOT NULL PRIMARY KEY,
post_txt VARCHAR(??) NOT NULL);
CREATE TABLE
(post_tag CHAR(??) NOT NULL
REFERENCES Tags(post_tag),
post_id ?? NOT NULL
REFERENCES Posts (post_id),
PRIMARY KEY (post_tag, post_id));
Your query can easily be done with a ROW_NUMBER() and you can avoid the highly proprietary old SQL Server “TOP(n)..ORDER BY …” Syntax
Joe – I hear ya, but this post wasn’t about, “How can you tell if your data model is good enough for production?” 😉
Sometimes you’re just the developer, not the architect, and you gotta ship a feature, not rewrite the whole database.
Also, if you wanna see the database, it’s linked to from the post. Buckle up though. You’re going to be a little horrified. 😉
No, the query is not ready for prod.
At least you should join the User table AFTER the TOP, so that it needs to do only 250 Nested Lookups (and of course an filtered index would help too, if this query runs often).
SELECT sub.Score , sub.Title , sub.Id AS QuestionId , u.DisplayName
FROM
(SELECT TOP 250 p.Score , p.Title , p.Id AS QuestionId , p.OwnerUserId
FROM dbo.Posts AS p
INNER JOIN dbo.PostTypes AS pt
ON p.PostTypeId = pt.Id
WHERE p.Tags LIKE ‘%%’
AND pt.Type = ‘Question’
ORDER BY p.Score DESC) AS sub
INNER JOIN dbo.Users AS u
ON p.OwnerUserId = u.Id;
Thomas – your query doesn’t even COMPILE, so I would say the example in the post above – as bad as it may be – is still more ready for production than yours is.
Better luck in your day job. 😉
if I would be able to edit my post, I had fixed the wrong join in the outer query just a minute after posting it (it is hard to test a query, if you haven’t the base database “installed” on your work PC).
BWAAAAA-HAAAAA-HAAAA!!!! I love the irony in this short but great article (nicely done, Brent)….
Step one would be to find developers that actually do ask the question “How Do I Know If My Query Is Good Enough for Production?” instead of “What’s the fastest way for me to get this off my plate”?
It’s not always their fault, though. Many times, they have task masters for managers. Managers need to remember that “If you want it real bad, that’s usually the way you’ll get it”. 😀
Hahaha, thanks, Jeff! And you’re right about the “fastest way for me to get this off my plate.”
Reminds me of the saying: You can have it Fast, Cheap, or Good. Pick any two!
When someone tells me that, I tell them to forget worrying about the other two and pick “Good”. It’s pretty amazing how the ROI of doing something right will pay off and how frequently “Fast” and “Cheap” follow “Good”.
Two thumbs up on the live stream, that was entertaining as hell. Quite cool to see how you distilled it down into a blog post, while keeping the core message.
Thanks for adding another LMGTFY article to my list of oddly educational comebacks.
Thanks! I think it’s neat to see how the delivery methods are so different between the stream and the blog post, too.
Brent, you’ve done a nice job addressing performance. But of course a “good enough” query also has to be correct. And the developer should not try to determine that for his/her own code.
(Says this software test and QA manager, retired.)
I think Developers should sweat things a bit more especially in the areas of correctly operating code and performance. Too many are only worried about just getting something off their plate,
Michael – yes, and secure, and written to best practices, yadda yadda yadda. But this is a performance blog. Thanks for stopping by, though!