Python’s rich web connectivity capabilities offer a convenient way to collect data from the Internet, and its ability to write csv files provide a medium for sharing collected data. This article focuses on enabling you to output end-of-day ticker price and volume data from Yahoo Finance to a csv file. A succession of three Python scripts progressively adds functionality to grow your capabilities for transferring Yahoo Finance historical price and volume data to a csv file.
Python’s ability to access so much high-value data from the Internet, such as stock prices and volumes, makes it worthwhile to understand how to transfer Internet content gathered by Python for storage and analysis with the aid of applications, such as SQL Server. This article addresses this topic by holding your hand through three Python scripts that grow your understanding of Python scripting and end-of-day data provided by the Yahoo Finance site. The destination for each of the scripts is a csv file, which is a commonly used medium for exchanging data between applications.
A set of previous articles covered different aspects of transferring historical price and volume data from both Yahoo Finance and Google Finance (here, here, and here) to SQL Server. These prior articles all integrate Python and SQL Server tightly via the xp_cmdshell extended stored procedure. However, some organizations may not support the use of the xp_cmdshell because of the obscurity of rules for managing its secure usage. Practically all organizations support transferring csv files to SQL Server and other applications. This article illustrates one way to transfer a csv file to SQL Server.
While Python offers built-in tools for analyzing historical price and volume data, SQL Server offers a great storage place after data are retrieved from the web. Consequently, some organizations or individuals may prefer analyzing historical data with custom T-SQL code developed for a watch list of stocks after the data are retrieved from the Internet. In fact, the final Python script from this article accumulates five years of data for fifty different ticker symbols in a watch list. A follow-up article to this one will demonstrate T-SQL code for common exploratory data analysis techniques for deriving potentially good buy and sell points for the stocks based on historical price data.
System Set Up
To run the examples in this article, you must have a Python shell installed. You can follow the instructions found here beginning with the Installing Python on a Server for All Users section to install the shell that I recommend.
The scripts in this article requires the pandas-datareader library. Once Python is installed, follow these instructions to install the library:
- Open a cmd window using ‘Run as administrator’
- Navigate to the python directory in Program Files
- Run python -m pip install pandas_datareader (It may take several minutes to install)
Create two folders, C:\python_programs and C:\python_programs_output.
Unless otherwise specified, save each script as a .py file in the C:\Python_programs folder. You can run one of the files created in the examples by double-clicking it.
Transferring Yahoo Finance Price and Volume History to a CSV File
The Python script for this section, Listing 1, illustrates a very basic approach to retrieving historical prices and volumes for the nvda ticker. This ticker represents the Nvidia Corporation, which is a manufacturer of computer processors for such application areas as gaming, professional visualization, datacenters, and artificial intelligence.
Listing 1: Yahoo Finance Price and History to CSV
|
1 2 3 4 5 6 7 8 9 10 11 12 13 14 15 16 17 18 19 20 21 |
#import external pandas_datareader library with alias of web import pandas_datareader as web #import datetime internal datetime module #datetime is a Python module import datetime #datetime.datetime is a data type within the datetime module start = datetime.datetime(2017, 9, 1) end = datetime.datetime(2017, 12, 31) #DataReader method name is case sensitive df = web.DataReader("nvda", 'yahoo', start, end) #invoke to_csv for df dataframe object from #DataReader method in the pandas_datareader library #..\first_yahoo_prices_to_csv_demo.csv must not #be open in another app, such as Excel df.to_csv('first_yahoo_prices_volumes_to_csv_demo.csv') |
Reading the comments in Python scripts throughout this article will help you understand the function of code or other special issues about the code. The hash sign (#) in a Python script denotes a comment similarly to the way that T-SQL denotes a comment with a double-dash (–).
Listing 1 introduces the DataReader method from the pandas_datareader library for Python. This method is used to import data from a handful of Internet sources, so it is very useful for extracting stock market data. Commentary on the other aspects of the script are reserved for the next section so that this section can highlight primarily the DataReader method for collecting historical price and volume data. This method from the pandas_datareader library deposits output from Yahoo Finance in a pandas dataframe object named df. A dataframe object is a construction that is generally like a SQL Server table for storing data in a tabular format. The Python script for this section outputs the contents of the df dataframe via the to_csv method to a csv file.
The DataReader method requires four arguments:
- The first argument is for the ticker that represents the stock for a company.
- The second argument designates the online data repository from which historical prices and volumes are collected. The DataReader method in the pandas_datareader library documentation asserts the method can use either of two online repositories for collecting historical ticker prices and volumes.
- The script in this article demonstrates how to use Yahoo Finance.
- The other repository (Google Finance) does not interact successfully as of the time that I am writing this article. That may change as the Python development community resolves blocking issues with the Google Finance site administrator team.
- The third and fourth arguments denote, respectively, the start date and end date through which to collect historical data. The start date is the earliest possible date and the end date is the most recent possible date.
In this script, constants are used to specify start and end dates (September 1, 2017 and December 31, 2017, respectively). Data are returned for stock market exchange trading days only. Therefore, weekends and a select set of holidays on which the markets are closed do not have historical prices associated with their dates. By using constants for specifying start and end dates, the code sets fixed limits for the date range for collecting data.
The script gets data for trading days from the start date through the end date. If the end date is more recent than the current date, then the last row of data will be for the current date. If the script is run on multiple days in December 2017, before the end of the month, then its output can reflect fresh data for each successive distinct day on which the script runs. However, once December 2017 concludes, the script always returns the same data for September through December 2017 (unless, of course, there is a data revision, such as for a stock split). You can think of the output from the script as a snapshot of the historical data in Yahoo Finance.
The to_csv method used in the program’s last line writes the snapshot of historical data to a file in a csv format. When the to_csv method is invoked as in this script, it writes a new file in the same folder as the source script file. The argument inside the method specifies the name for the new file. I often save my Python script files in the C:\python_programs folder. Therefore, when I run the script below, its output ends up in the first_yahoo_prices_volumes_to_csv_demo.csv file within the C:\python_programs folder. (NOTE: You can run the script by double-clicking it.)
Figure 1 shows Yahoo Finance historical data for the nvda ticker for the first three trading days of September 2017 from the Yahoo Finance user interface that was set to display data from September 1 through 6 in 2017.
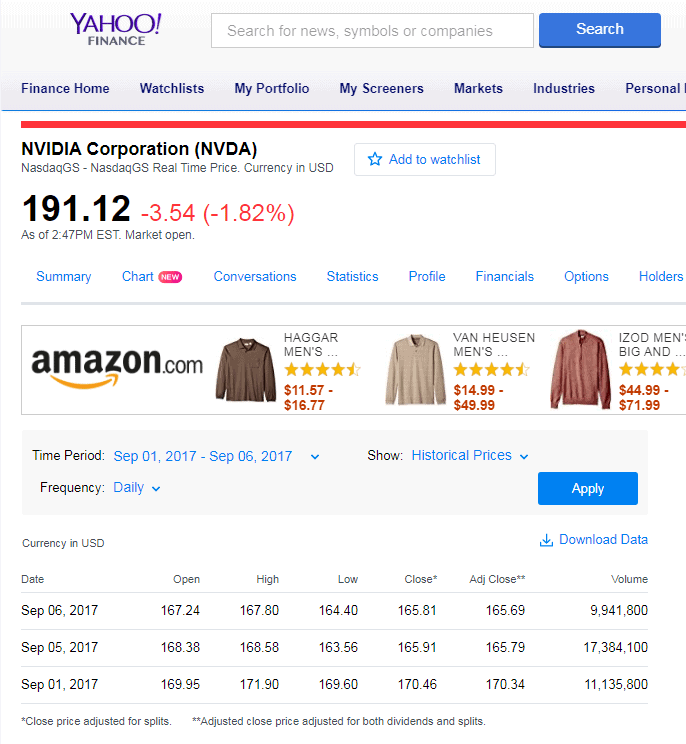
Figure 1: The Yahoo Finance interface
Figure 2 displays the same data from the preceding Python script in a NotePad++ session; NotePad++ is a popular text editor with enhanced features beyond those available from the default Notepad text editor that ships with Windows. The Python script accesses a programmatic interface instead of the user interface shown in Figure 1.
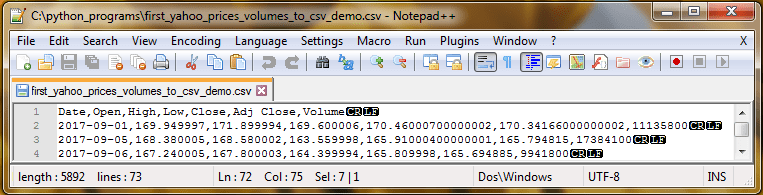
Figure 2: The extracted data
By comparing the two images, you can confirm that the Python script can generate the same results as the Yahoo Finance user interface.
- A date starts each row followed by six columns of data. The column names after Date are Open, High, Low, Close, Adj Close and Volume. The difference between Close and Adj Close is an adjustment for dividends.
- Notice that there are three trading days spread over six calendar days from the earliest date through the most recent date. September 2 and 3 are weekend days and September 4 is for the Labor Day holiday; the U.S. stock markets close on these days.
- For the three trading days, the results from the Python script are identical to within rounding error from the Yahoo Finance user interface display.
Dynamic Date Ranges and Custom File Locations
The Python script in this section, Listing 2, adds a couple of enhancements to the original script. Instead of using a fixed date range from the beginning of September through the end of December in 2017, this script allows the collection of historical prices and volumes over a dynamic date range. Additionally, this new script also includes code for designating a specific folder for saving the csv file instead of accepting the default option which saves it in the same folder as the script file. This section will also drill down into selected features of Python scripting features not covered in the preceding section.
Listing 2: Dynamic date range and custom file locations
|
1 2 3 4 5 6 7 8 9 10 11 12 13 14 15 16 17 18 19 20 21 22 23 24 25 26 27 28 29 30 31 32 33 34 35 36 |
#import external pandas_datareader library with alias of web import pandas_datareader as web #import datetime internal datetime module #datetime is a Python module import datetime #datetime.datetime is a data type within the datetime module #which allows access to Gregorian dates and today function #datetime.date is another data type within the datetime module #which permits arithmetic with Gregorian date components #definition of end with datetime.datetime type must precede #definition of start with datetime.date type end = datetime.datetime.today() start = datetime.date(end.year-2,1,1) #DataReader method name is case sensitive df = web.DataReader("nvda", 'yahoo', start, end) #invoke to_csv for df dataframe object from #DataReader method in the pandas_datareader library #..\second_yahoo_prices_to_csv_demo.csv must not #be open in another app, such as Excel #https://pandas.pydata.org/pandas-docs/stable/generated/pandas.DataFrame.to_csv.html #specification does not work as documented, #but these workarounds are ok to use #notice use of forward slashes, instead of backward slashes, for path_out path_out = 'c:/python_programs_output/' df.to_csv(path_out+'second_yahoo_prices_volumes_to_csv_demo.csv') |
The script starts with two import statements. An import statement allows a Python script to reference code from an external or built-in library.
The pandas_datareader library is an example of an external library for remote access to an Application Programming Interface (API). The import statement for the pandas_datareader library assigns an alias of web. The remaining code within the script to refers to methods in the library by web.method_name. The DataReader method is part of pandas_datareader library so the code invokes the method with web.DataReader.
The second import statement in the script references the built-in datetime library. Python has multiple code containers with some overlap between types of containers. For example, a library and a module are sometimes used interchangeably as code containers. Therefore, you can find documentation referring to the built-in datetime library as well as the datetime module. The datetime library and datetime module refer to the same body of internal Python code.
The datetime internal library enables dynamic date values for the start and end date arguments for the DataReader method. The today() constructor for the datetime.datetime name in the script returns a value for today’s date; the script assigns this value to the end argument for the DataReader method. Whenever the script is run on two different days, the end date will change from one run to the next run. The datetime.datetime name refers to the datetime type or class in the datetime library or module. Since Python version 2.x (as of this writing we are on version 3.x of Python), class and type refer to a body of code that can be used to create a user-defined object instance.
The date class or type in the datetime library represents a date as (year, month, day); this is the Gregorian date representation used by Python for dates. The date class supports operations on each of the components of a Gregorian date. A representation like mycurrent.year – 2, 1, 1 designates January 1 for a year that is two years prior to the value of mycurrent.year. The assignment statement for the start variable in the script references end.year – 2, which is two years prior to the year for the end date value in the script. Because the start value depends on the end value, you must assign a value to the end variable before you can assign a value to the start variable.
The combination of the assignments for the start and end variables also contributes to making the date range dynamic. The end date for the historical values returned by the DataReader method in this script will always be today if there is trading on today’s date; otherwise, the end date for historical values will be the first trading day before the end date. Also, the start date is dynamic as well. If you initially run the script on December 28, 2017 and then a second time on January 3, 2018, each run will have a different start date. The start date will be January 1, 2015 for the first run, and the start date for the second run will be January 1, 2016.
There are a couple of different approaches to dynamically setting the destination folder which the dataframe’s to_csv method references; recall that by default this method saves its csv file in the same folder as the folder for the Python script file from which it runs. I prefer to use a string expression for designating a non-default path/filename for the file. Another approach relies on the Python os library.
The technique demonstrated in the script is to use a string variable, path_out, the path for the referenced csv file. Note that the assignment uses a forward slash instead of a backward slash to delimit path and filename components. After assigning a value to the variable, the code shows how to use the plus sign (+) as a concatenator for the combined string value for the path and the filename as an argument for the to_csv method. The referenced path/filename is dynamic because you can change the file’s destination folder as simply as assigning a new value to the path_out variable.
I unit tested the script from Listing 2 on December 13, 2017 after the end-of-day historical values were updated for the nvda ticker at Yahoo Finance. Figure 3 shows historical prices and volumes for the most recent three days.
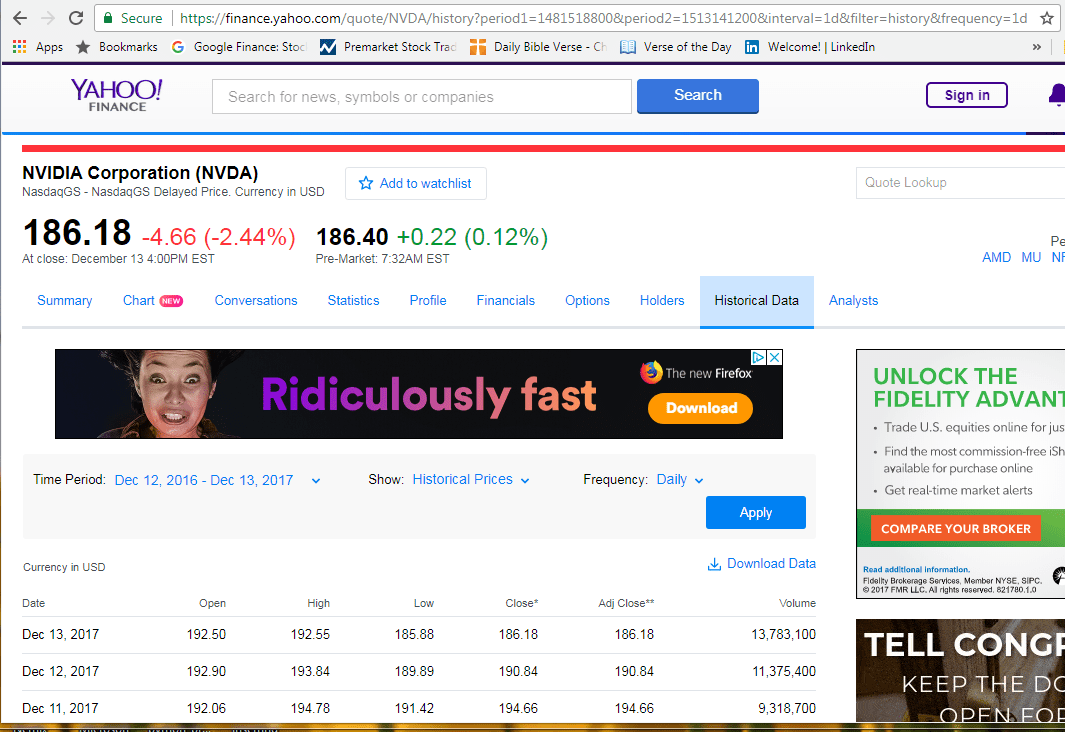
Figure 3: The prices for the unit test’s most recent three days
Figure 4 presents a view of the same data from inside the Results pane of a SQL Server Management Studio session after importing the values exported to a csv file by the preceding script. After accounting for fact that the order of the rows is sorted differently by date, you can easily confirm that the values match perfectly.
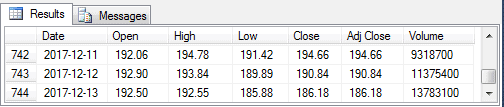
Figure 4: The unit test data imported into SQL Server
Populating a CSV File for a Watch List of Stocks
The previous examples allowed for the extraction of historical data of only one ticker symbol at a time. In this section, I’ll show you how to extract the data for a watch list of symbols.
Before running the code from Listing 3, download the ST_50.txt file linked to at the bottom of this article and save it in the c:\Python_programs folder.
Listing 3: Extract data for a watch list
|
1 2 3 4 5 6 7 8 9 10 11 12 13 14 15 16 17 18 19 20 21 22 23 24 25 26 27 28 29 30 31 32 33 34 35 36 37 38 39 40 41 42 43 44 45 46 47 48 49 50 51 52 53 54 55 56 57 58 59 60 61 |
#settings for importing built-in datetime and date libraries #and external pandas_datareader libraries import pandas_datareader.data as web import datetime #read ticker symbols from a file to python symbol list symbol = [] with open('C:\python_programs\ST_50.txt') as f: for line in f: symbol.append(line.strip()) f.close #datetime is a Python module #datetime.datetime is a data type within the datetime module #which allows access to Gregorian dates and today function #datetime.date is another data type within the datetime module #which permits arithmetic with Gregorian date components #definition of end with datetime.datetime type must precede #definition of start with datetime.date type #the start expression collects data that are up to five years old end = datetime.datetime.today() start = datetime.date(end.year-5,1,1) #set path for csv file path_out = 'c:/python_programs_output/' #loop through 50 tickers in symbol list with i values of 0 through 49 #if no historical data returned on any pass, try to get the ticker data again #for first ticker symbol write a fresh copy of csv file for historical data #on remaining ticker symbols append historical data to the file written for #the first ticker symbol and do not include a header row i=0 while i<len(symbol): try: df = web.DataReader(symbol[i], 'yahoo', start, end) df.insert(0,'Symbol',symbol[i]) df = df.drop(['Adj Close'], axis=1) if i == 0: df.to_csv(path_out+'yahoo_prices_volumes_for_ST_50_to_csv_demo.csv') print (i, symbol[i],'has data stored to csv file') else: df.to_csv(path_out+'yahoo_prices_volumes_for_ST_50_to_csv_demo.csv',mode = 'a',header=False) print (i, symbol[i],'has data stored to csv file') except: print("No information for ticker # and symbol:") print (i,symbol[i]) continue i=i+1 |
The Python script in this section, Listing 3, contains a while loop to facilitate referencing multiple ticker symbols instead of just one. The ticker symbols are specified in a txt file which is used to populate a Python list object, symbol.
The code inside the loop references successive values from the list object. It also handles any remote access errors that can occur when a request is made for a ticker symbol for which Yahoo Finance is not ready to reply with the requested data. The set of ticker symbols from the file can be thought of as a stock watch list because the Python script output will allow you to watch the price and volume behavior of the stock over a date range.
When you install Python as described in a prior article, you will also get an integrated development and learning environment called IDLE. This environment facilitates running scripts and viewing printed output. The Python script in Listing 3 populates a log with print statements that summarize the outcome of requests to Yahoo Finance for ticker symbol historical price and volume data. When the script is run from the IDLE application, the log appears in an IDLE shell window. This section reviews an instance of a log associated with a run of the script. The prior article referenced for installing Python also includes demonstrations of how to run Python programs from IDLE and view output in an IDLE shell window or a Windows cmd window.
Here’s a walk through the lines of code in the script.
- The two import statements at the top of the script access the external pandas_datareader library as well as the Python internal datetime library.
- The next code block shows how to open a txt file and read lines from the file into a list object named symbol. The txt file has the name ST_50.txt. The line.strip function removes whitespace, such as newline codes, from the beginning and end of a line.
- The end variable is assigned today’s date, which points to the date when the script runs, and the start variable is assigned January 1 in a year that is five years before the year for today. The range between the start and end variables provides a period that is long enough for testing some technical indicators providing guidelines about when to buy and sell stocks in the follow-up article to this one.
- The path_out assignment designates the folder for storing the csv file generated by the script.
- The code block for the while loop starts after the path_out variable assignment and continues through the end of the script.
- Just before the while statement, an assignment statement initializes the variable i to zero. This variable serves as the index for ticker values in the symbol list. These values start at zero and continue through forty-nine based on the values used to populate the symbol list object in this demonstration.
- The while statement starts the loop with a condition that allows the loop to continue so long as the value of i is less than number of ticker values in the symbol list, which is computed by len(symbol). When the value of i reaches the number of objects in the symbol list, the while loop concludes, which also serves to conclude the script.
- There are three code blocks within the while loop.
- The first code block within the while loop commences with a try statement.
- The second code block starts with an except statement. Control transfers to this code block when the try code does not conclude successfully.
- The third code block consists of a single line, which increments the value of i by one when the try code blocks ends successfully.
- The try code block has three purposes.
- It begins by invoking the DataReader method.
- The first parameter (symbol[i]) references the ticker symbol value for the current pass through the while loop.
- The second parameter points to Yahoo Finance as the repository from which to collect historical data.
- The third and fourth parameters contain the start and end dates for which to collect historical data.
- When the DataReader method succeeds, it returns historical data in a dataframe object named df. Recall that this object contains seven values on each row – namely: Date, Open, High, Low, Close, Adj Close, and Volume.
- The second and third statements in the try block re-configure the df object.
- The second statement uses the insert method to add a new column named Symbol and populates the column with the ticker value for the historical values on the row. The Symbol column is inserted immediately after the Date column, which is an index column within each block of historical data for a ticker value within the df object.
- The third statement drops the Adj Close column from the df object. Recall that the Adj Close column is the same as the Close column, except for an adjustment for dividends.
- An If…else statement block concludes the try block. The If…else statement block performs two types of actions.
- When the ticker symbol is the first ticker value in the symbol list object, it performs these actions.
- The code block creates a fresh copy of the yahoo_prices_volumes_for_ST_50_to_csv_demo.csv file with the contents of the dataframe returned by the invocation of the DataReader for the current pass through the loop.
- Also, the code prints a log message to indicate that the current symbol has its historical data in the csv file.
- When the ticker symbol is not the first ticker value in the symbol list object, it performs these actions.
- The code block appends the contents of the dataframe for the current pass through the loop to the csv file without a header row.
- In addition, the code prints a log message to indicate that the current symbol has its historical data in the csv file.
- When the ticker symbol is the first ticker value in the symbol list object, it performs these actions.
- It begins by invoking the DataReader method.
- The except block performs two functions.
- First, it prints a pair of lines to the log indicating no historical data was retrieved for the current ticker index value (i) and symbol (symbol[i]) on this try of the DataReader method within the current loop.
- Second, the except block executes a continue statement, which triggers a re-run of the try block code.
- After a successful execution of the try block, control passes to the first statement after the continue statement in the except block.
- This statement increments the value of i by one before control passes to the while statement.
- The statement also serves as an end anchor for the while statement.
One limitation of the preceding script is that Yahoo Finance must recognize all ticker values in the ST_50.txt file. If you specify a ticker value that is not recognized by Yahoo Finance, the script will fall into an infinite loop. This can happen when you are working with a very large list of ticker values so that it is not convenient to check if Yahoo Finance recognizes all values in the ticker list file. One workaround for this issue is to update the code in the loop to stop re-trying to retrieve historical data after a reasonable number of failures; for example, the code can be updated to quit further re-tries after the tenth failure to retrieve history for a ticker value.
Figure 4 shows the log of tries to retrieve historical price and volume data for the first five tickers in the ST_50.txt file. The CYD, HIIQ, and NVMI tickers each returned historical data in response to the initial request. On the other hand, two or more requests were required for the COHR and OLED tickers.
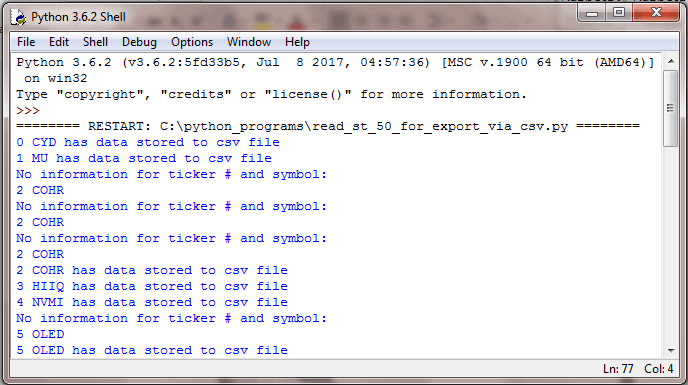
Figure 4: The log from running the example
Figure 5 shows an excerpt from the yahoo_prices_volumes_for_ST_50_to_csv_demo.csv file which is populated with historical data by the Python script in this section.
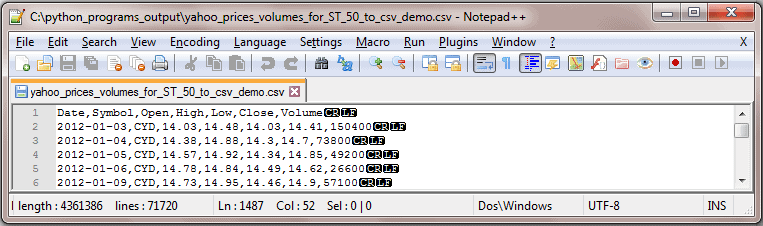
Figure 5: Partial results from running Listing 5
Conclusion
You can use Python scripts to capture historical ticker prices and volumes and save the results in a csv file. Whether or not you are collecting historical price and volume data for ticker symbols, you can export tabular data collected via Python from the Internet to csv files. These csv files can then be imported into any application, such as SQL Server, that is able to import csv files.
This article presents an introduction to the topic of writing csv files from Python that especially targets historical price and volume data. The code samples in this article and the numerous references pointing to documentation and prior demonstrations will help you start downloading data for any set of stock ticker symbols for which you wish to examine historical end-of-day data.
A follow-up article to this one will take the csv file exported by the third script in this article and demonstrate how to compute and use a couple of technical indicators for the time series data. Data scientists often use terms such as exploratory data analysis or data mining to describe the techniques covered in the follow-up article.
Load comments