Introduction
There are different techniques to optimize the performance of SQL Server queries, such as keeping required and updated statistics, creating required indexes, partitioning table, etc., but wouldn’t it be great if had some recommendations before we started planning or optimizing queries so that we didn’t have to start from scratch every time? This is where you can use the Database Engine Tuning Advisor utility to get recommendations based on your workload.
In my earlier article, I talked about Database Engine Tuning Advisor and how you can use its graphical user interface to tune queries. In this article, I am going to demonstrate how you can use the command line interface to tune the queries and how you can use SQL Server Profiler to capture the workload for tuning with Database Engine Tuning Advisor.
Getting started with Database Engine Tuning Advisor – Command Line Interface
As discussed earlier, SQL Server includes a command line interface for Database Engine Tuning Advisor (DTA.exe), which you can use to automate the tuning process and get recommendations in the form of SQL scripts or/and an XML file.
You can save your queries that you want to tune in a file and then use it as input for the DTA utility. For example, I have saved these queries in a file (QueryForTuning.sql):
USE DETA
GO
SELECT *
FROM   SalesOrderHeader SH
INNER JOIN SalesOrderDetail SD ON   SH.SalesOrderID =   SD.SalesOrderID
WHERE   OrderDate = '2008-06-01   00:00:00.000'
GO
SELECT   OrderDate, ProductID,   SUM(OrderQty) AS OrderQty, SUM(UnitPriceDiscount)   AS UnitPriceDiscount,   SUM(LineTotal)
FROM   SalesOrderHeader SH
INNER JOIN SalesOrderDetail SD ON   SH.SalesOrderID =   SD.SalesOrderID
GROUP BY OrderDate,   ProductID
HAVING SUM(OrderQty) >= 100
GO
SELECT   SalesOrderNumber, PurchaseOrderNumber, DueDate, ShipDate
FROM   SalesOrderHeader SH
INNER JOIN SalesOrderDetail SD ON   SH.SalesOrderID =   SD.SalesOrderID
WHERE   OrderDate IN ('2008-06-01','2008-06-02', '2008-06-03', '2008-06-04', '2008-06-05')
GO
SELECT   SH.SalesOrderID,   SalesOrderNumber, PurchaseOrderNumber, DueDate, ShipDate
FROM   SalesOrderHeader SH
INNER JOIN SalesOrderDetail SD ON   SH.SalesOrderID =   SD.SalesOrderID
WHERE CarrierTrackingNumber   IN ('EF67-4713-BD', '6C08-4C4C-B8')
ORDER BY SH.SalesOrderID
GO
Now let’s run this command on the Command Prompt as seen in Figure 1:
dta -S ARALI-LP\SQL2012 -E -D DETA -F -s myCLIDETASession01 -if QueryForTuning.sql -of myCLIDETASession01.sql -fa IDX_IV
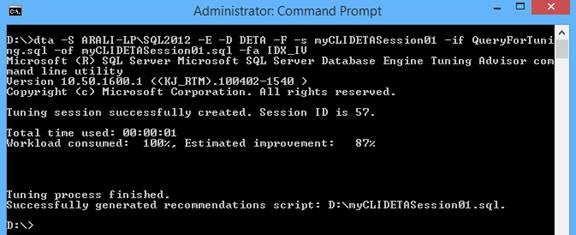
Figure 1 – Database Engine Tuning Advisor – CLI
These are some of the frequently used switches or parameters to be used with DTA utility; for an exhaustive list you can use dta -? Command or refer to this documentation. Please note these switches are case sensitive:
- -S -> with this switch, you can specify the SQL Server instance to connect to.
- -E -> with this switch, you specify to use a trusted connection or else you need to specify -U and -P to specify user name and password to connect to the SQL Server instance.
- -D -> with this switch, you can specify the name of the database that is to be tuned.
- -F -> with this switch, you specify to overwrite an existing output file.
- -s -> with this switch, you can specify the name of the tuning session.
- -if -> with this switch, you specify workload files, which either contain SQL queries or trace or log generated from SQL Server Profiler. In case you have your trace collected in table, you can use -it to specify trace table name.
- -of -> with this switch, you specify the location and name of the file in which the recommendation as a Transact-SQL script will be written.
- -ox -> with this switch, you specify the location and name of the XML file in which the recommendation will be written.
- -fa -> with this switch, you specify what types of physical design structures (indexes) should be include in the recommendation. You can use -fi if you want to include filtered indexes as part of the recommendations.
- -fp -> with this switch, you specify if physical design structures recommended should be partitioned, and how they should be partitioned.
- -fk -> with this switch, you specify what existing physical design structures must be retained when generating its recommendation.
Each time you create a session with Database Engine Tuning Advisor, it saves your session information along with the recommendation. This helps to compare tuning results over a period of time between multiple tuning sessions.
Collecting Workload by Running SQL Server Profiler Trace
As a database administrator, you might not have immediate access to all of those queries that you want to tune; for example, some of these queries might be run by end users, some of them might be coming from middle or application tiers, etc. In these cases, you can use SQL Server Profiler to trace and collect all those queries being executed against the SQL Server instance.
SQL Server Profile include several templates (a template specifies what to collect) and one of them is Tuning. It has been especially created for collecting enough information that will be helpful in performance optimization. Launch SQL Server Profiler and create a new trace based on this template. Next you need to specify whether you want to store traced information in a file or in a SQL table. In my case I chose to save these information in a file as shown below in Figure 2.
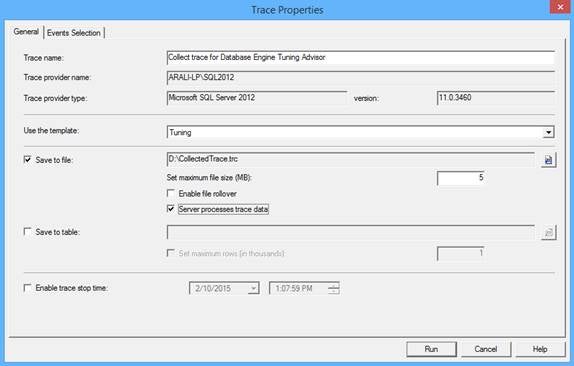
Figure 2 – Trace Properties
If you go to the Events Selection tab, you can specify all events to be traced; we will keep the default selection though we will specify a filter on the database. This means all those queries run against this specific database will be traced. Once you are done, click on the Run button in the toolbar to start profiling.
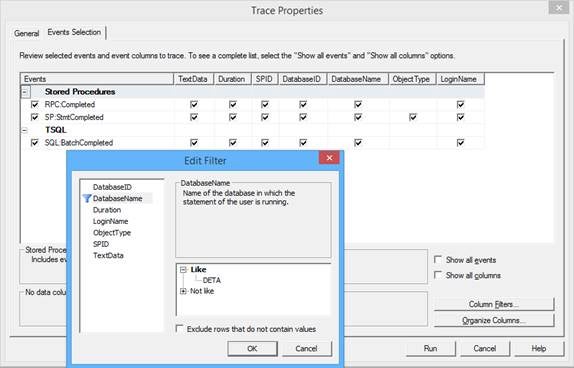
Figure 3 – Events to capture, filter to apply
Once you are done with collecting data, you can stop the running trace and close the trace file so that you can use it in Database Engine Tuning Advisor. In this example, I started the trace and executed the same queries as above and then stopped the trace, which you can see in Figure 4.
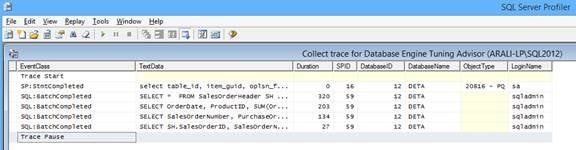
Figure 4 – Collected queries as part of the trace
Please note, using SQL Server Profiler to collect and trace queries has an overhead and hence it’s recommended to do it only when you really need it or try using it in a test environment instead of in a production environment or if you still have to use it in a production environment, use it in a lean period and run the trace for a shorter period of time.
Using SQL Server Profiler Trace with Database Engine Tuning Advisor
Once you have a trace file created with the expected workload to optimize, you can choose either the graphical user interface or command line interface of Database Engine Tuning Advisor. For example, as shown in Figure 5, I am using the trace file we created earlier in this article as the workload for tuning. Click on the Start Analysis icon on the toolbar to let Database Engine Advisor start analyzing the workload in order to provide recommendations for optimization.
Starting with SQL Server 2012, you can also use Plan Cache as input for Database Engine Tuning Advisor; this means you don’t need to collect your workload first but rather queries from Plan Cache will be used as input for tuning.

Figure 5 – Using Graphical User Interface of Database Engine Tuning Advisor to work on workload trace file
As shown in Figure 6, you can see recommendations provided by Database Engine Tuning Advisor for the workload we captured and provided to this tool.
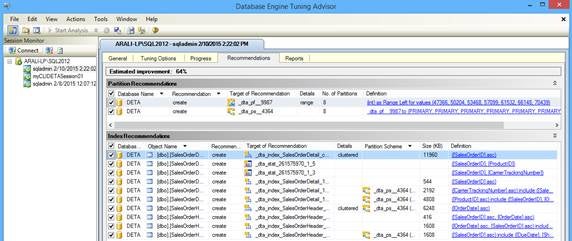
Figure 6 – Recommendation by Database Engine Tuning Advisor based on workload trace file
We can also use the command line interface of Database Engine Tuning Advisor to use a trace file as the workload input and get automated recommendations as shown below and Figure 7. We are using a couple of more switches here, which we discussed earlier in this article.
dta -S ARALI-LP\SQL2012 -E -D DETA -s myCLIDETASession02 -if "D:\CollectedTrace.trc" -of D:\myCLIDETASession02.sql -ox D:\myCLIDETASession02.xml -fa IDX_IV -fp ALIGNED -fk NONE
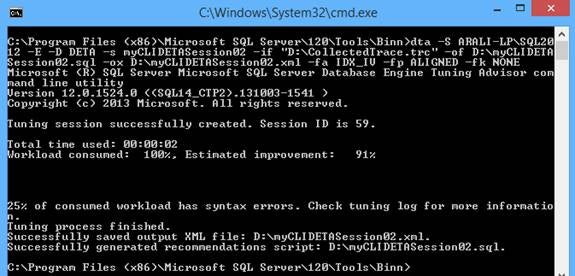
Figure 7 – Using Command Line Interface of Database Engine Tuning Advisor to work on workload trace file
Conclusion
In this article of the series, I demonstrated how you can use the command line interface of the Database Engine Tuning Advisor to tune the queries and how you can use SQL Server Profiler to capture the workload for tuning with Database Engine Tuning Advisor.
Resources
Database Engine Tuning Advisor Features