The Dynamic Management View (DMV) sys.dm_db_index_usage_stats reports on the usage of indexes, so we can use this DMV to find which indexes could have problems. This DMV can give totals of some kinds of index usages, such as scans, seeks and lookups, so we can use this DMV to find not only indexes but databases which require some attention.
Let’s see some important information that we can find in this DMV:
- Scans: Scans are usually terrible for performance, because the entire index is searched to find the information. It is likely that you’ll need to optimize any queries that use an index that is subject to lot of scan, this could involve changing the queries or on the index.
- Seeks : Seek is the opposite of scan, and is a very good use of the index, so we can compare the proportion of seeks to scans and look for those indexes that have more scan’s than seeks as being a potential source of problems.
- Lookups: Lookups happen when an operation over a nonclustered index needs to retrieve additional fields for the query, usually using the clustered index. This is an expensive operation, so the query optimizer can decide, sometimes, to do a clustered index scan instead of a lookup. In this last case, of course, it will count as a scan rather than lookup, so the number of lookups includes only those that aren’t too expensive to become scans, but still aren’t good for performance.
I’m simplifying the optimization techniques, but in this article the focus is on how to find opportunities for optimization.
The sys.dm_db_index_usage_stats DMV has information for user actions and system actions, so we have user_scans and system_scans, but we can ignore the system information.
The first step is to identify the database that is most affected by these problems. We need a query for each type of problem, whether scan or lookup (a seek is not a problem, but the ratio of seeks to scans is information that will help us to identify scan problems).
Identifying Scan Problems
Let’s see the query to find the database with most scan problems :
|
1 2 3 4 5 |
select db_name(database_id),max(user_scans) bigger, avg(user_scans) average from sys.dm_db_index_usage_stats group by db_name(database_id) order by average desc |
It doesn’t make much sense to sum the user_scans of different indexes, so we get the maximum and the average of user scans to find which database deserves our attention.
Here the result for my SQL Server:
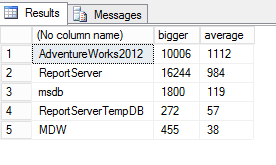
We can see that there are a lot of scans in the ‘adventureworks2012’ database
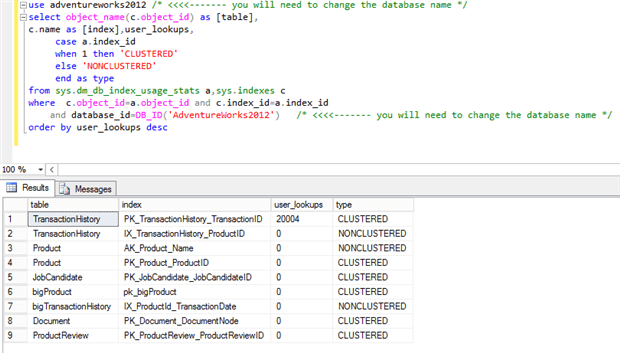
Only after we’ve selected one particular database can we go on to get the name of the indexes that might have problems. To do this, we now need to join this DMV information with sys.indexes information to get the name of the index.
This query needs to run in the chosen database (of course, you will change the database name on the query):
|
1 2 3 4 5 6 7 8 9 10 11 12 13 |
Use adventureworks2012 /* <<<<------- you will need to change the database name */ select object_name(c.object_id) as [table], c.name as [index],user_scans,user_seeks, case a.index_id when 1 then 'CLUSTERED' else 'NONCLUSTERED' end as type from sys.dm_db_index_usage_stats a inner join sys.indexes c on c.object_id=a.object_id and c.index_id=a.index_id and database_id=DB_ID('AdventureWorks2012') /* <<<<------- you will need to change the database name */ order by user_scans desc |
Side note: These examples were created using Adventureworks2012 database, that you can download from https://msftdbprodsamples.codeplex.com/releases/view/55330, but the tables ‘bigproduct’ and ‘bigtransactionhistory’ were created by Adam Machanic and you can find the script at http://sqlblog.com/blogs/adam_machanic/archive/2011/10/17/thinking-big-adventure.aspx. The scan activity was generated using SQL Query Stress tool, also from Adam Machanic and you can find it at http://dataeducation.com/sqlquerystress-the-source-code/.
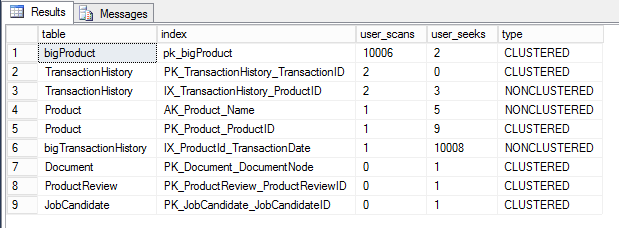
Notice that I also used the index_id to identify the index as clustered or nonclustered. I also included seek information so we can compare scans and seeks to decide which index deserves our attention.
As a result we can clearly notice that the table ‘bigproduct‘ and its clustered index have a lot of scans that we need to focus on.
Both queries that I’ve used so far were done to investigate the scan problem, but you can use the same queries for the lookup problem: You just need to change the user_scans field to user_lookups field.
Finding the query plans causing scans
By using these queries, we found which database and indexes deserve our attention, but how can we find those query plans that will identify the queries that are responsible for causing these problems?
As a second step we can use SQL to identify the query plans in cache that have these problems, so we will then be able to work out which queries we need to optimize.
Using the DMV sys.dm_exec_query_stats we can retrieve all the queries in cache and identify those query plans with problems.
This DMV has a handle that we can use to retrieve the query plan and a handle that we can use to retrieve the text of the query. For these we will use sys.dm_exec_query_plan and sys.dm_exec_sql_text Dynamic Management Function (DMF), respectively. We need to do a CROSS APPLY with these.
The query:
|
1 2 3 |
select qp.query_plan,qt.text from sys.dm_exec_query_stats CROSS APPLY sys.dm_exec_sql_text(sql_handle) qt CROSS APPLY sys.dm_exec_query_plan(plan_handle) qp |
The query_plan field is in XML, but if you view the query results as ‘result to grid’, the query window in SSMS recognizes the schema and shows the plan graphically for us if you click on the link. That’s good for ad-hoc exploration by inspecting single plans, but not for systematically searching through the plans for those with a particular criterion. Unless we can filter the results based on the XML, we would need to look one by one. So, the best option is to use Xquery.
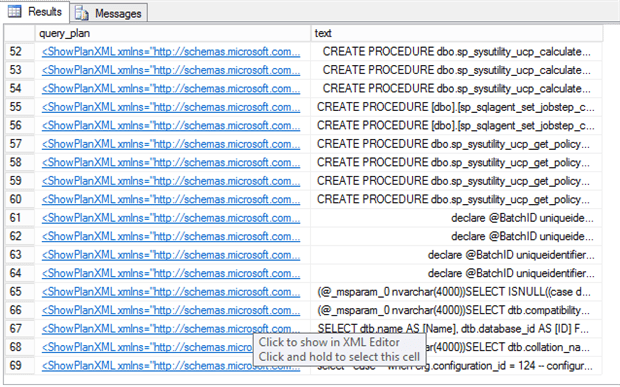
If we click the query_plan field we will see the graphical query plan
In order to sensibly use XQuery to search through XML, we need information about the schema that the XML uses.
The schema of this XML is published at http://schemas.microsoft.com/sqlserver/2004/07/showplan
There are plenty of possibilities for finding execution problems using this method, but I can only show a few, and to do different searches, you will need to study the schema.
By looking through the schema, we find that we have a RelOp element with a LogicalOp attribute that we can use to find all plans that have index scans or table scans. Let’s see the query :
|
1 2 3 4 5 6 7 8 |
select qp.query_plan,qt.text from sys.dm_exec_query_stats CROSS APPLY sys.dm_exec_sql_text(sql_handle) qt CROSS APPLY sys.dm_exec_query_plan(plan_handle) qp where qp.query_plan.exist('declare namespace qplan="http://schemas.microsoft.com/sqlserver/2004/07/showplan"; //qplan:RelOp[@LogicalOp="Index Scan" or @LogicalOp="Clustered Index Scan" or @LogicalOp="Table Scan"]')=1 |
The XML of the query plan is typed, so we need to declare the namespace in order to use xquery. The schema is a bit complicated and you need to be careful when you create your own queries. For example, it would be a mistake to query for the elementIndexScan, because the element IndexScanis used for all index operations, including seeks and lookups.
The next step is to filter the result by a specific index. We already found the indexes with most scans, so now we can find out which plans are causing this. Following the schema, the name of the index is an attribute in the Object element, inside the IndexScan element that is inside the RelOpelement.
So this will be the query:
|
1 2 3 4 5 6 |
select qp.query_plan,qt.text from sys.dm_exec_query_stats CROSS APPLY sys.dm_exec_sql_text(sql_handle) qt CROSS APPLY sys.dm_exec_query_plan(plan_handle) qp where qp.query_plan.exist('declare namespace qplan="http://schemas.microsoft.com/sqlserver/2004/07/showplan"; //qplan:RelOp/qplan:IndexScan/qplan:Object[@Index="[pk_bigProduct]"]')=1 |
If this query results in too much plans, we can use other fields in sys.dm_exec_query_Stats to find the plans that we need to optimize. For example, we can use total_worker_time field to order the result by CPU time, like this:
|
1 2 3 4 5 6 7 8 9 |
select qp.query_plan,qt.text,total_worker_time from sys.dm_exec_query_stats CROSS APPLY sys.dm_exec_sql_text(sql_handle) qt CROSS APPLY sys.dm_exec_query_plan(plan_handle) qp where qp.query_plan.exist('declare namespace qplan="http://schemas.microsoft.com/sqlserver/2004/07/showplan"; //qplan:RelOp[@LogicalOp="Index Scan" or @LogicalOp="Clustered Index Scan" or @LogicalOp="Table Scan"]/qplan:IndexScan/qplan:Object[@Index="[pk_bigProduct]"]')=1 order by total_worker_time desc |
In my simulation, the result is only one query plan. We have the text of the offending query and we can see the plan graphically if the query results as ‘result to grid’ and we click on the link. SSMS shows even the ‘missing index’ information, making it even easier to solve the problem.
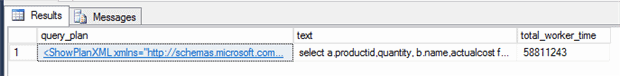
We found exactly the query causing the problem and…
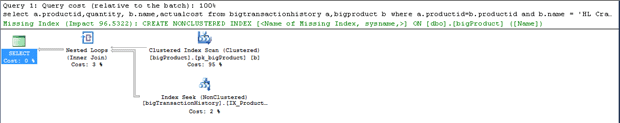
… we can see the graphical query plan and the missing index suggestion
Identifying Lookup Problems
Another example of the use of DMVs is to find the plans with index lookups. If we change the first query to calculate the amount of lookups we will notice a lot of lookups in ‘adventureworks2012’:
|
1 2 3 4 5 |
select db_name(database_id),max(user_lookups) bigger, avg(user_lookups) average from sys.dm_db_index_usage_stats group by db_name(database_id) order by average desc |
Trying to find the index that is causing this will reveal to us where to focus:
|
1 2 3 4 5 6 7 8 9 10 11 12 13 |
use adventureworks2012 /* <<<<<------- you will need to change the database name */ select object_name(c.object_id) as [table], c.name as [index],user_lookups, case a.index_id when 1 then 'CLUSTERED' else 'NONCLUSTERED' end as type from sys.dm_db_index_usage_stats a inner join sys.indexes c on c.object_id=a.object_id and c.index_id=a.index_id and database_id=DB_ID('AdventureWorks2012') /* <<<<<------- you will need to change the database name */ order by user_lookups desc |
Adventureworks2012 also has lookup problems
Finally, to find query plans with lookups we need to filter by the lookup attribute in the IndexScan element. The new query:
|
1 2 3 4 5 6 7 8 |
select qp.query_plan,qt.text, plan_handle,query_plan_hash from sys.dm_exec_query_stats CROSS APPLY sys.dm_exec_sql_text(sql_handle) qt CROSS APPLY sys.dm_exec_query_plan(plan_handle) qp where qp.query_plan.exist('declare namespace AWMI="http://schemas.microsoft.com/sqlserver/2004/07/showplan"; //AWMI:IndexScan[@Lookup]/AWMI:Object[@Index="[PK_TransactionHistory_TransactionID]"]')=1 |
In this example we will find out that, if we remove two of the fields , the ‘quantity‘ and ‘actualcost‘ fields, from the query, then the lookup will disappear. Of course, this might not be possible, in which case we’d need to look for other solution, but this is not the focus of this article.
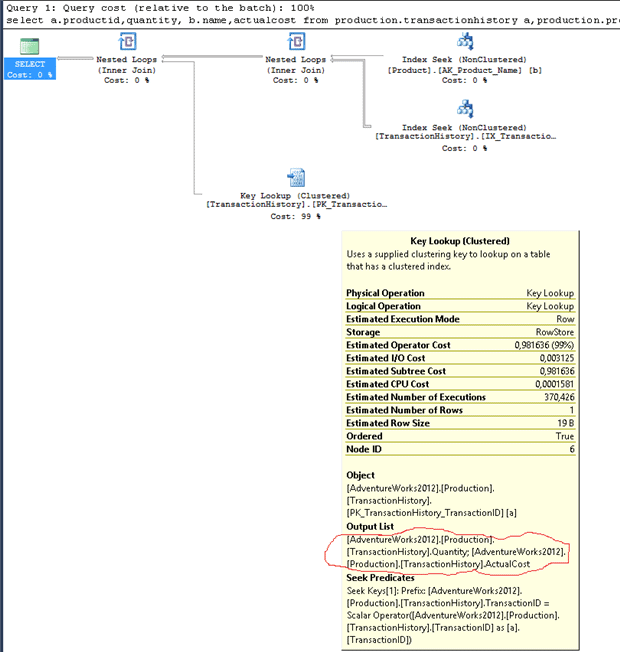
We can see the cause of the lookup
Turning exploratory queries into a practical solution
It’s nice to see that we can search the query plans in cache to find problems, but it isn’t practical to use queries like this in daily optimizations. So, how can we make this more practical? Simple: We can create a reusable function so that we would then no longer need to worry about the complexity of the query syntax any more. So, we can create queries for each of the main problems in query plans and then create one function for each query.
The XQuery ‘exist()‘ method only accepts constants as parameters. So, the only solution to turn the name of the index into a variable is to use sql:variable expression to access a variable from inside the xquery expression.
Here is the resulting function:
|
1 2 3 4 5 6 7 8 9 10 11 12 13 14 15 16 17 18 19 20 |
Create FUNCTION [dbo].[FindScans] ( -- Add the parameters for the function here @Index varchar(50) ) RETURNS TABLE AS RETURN ( select qp.query_plan,qt.text,total_worker_time from sys.dm_exec_query_stats CROSS APPLY sys.dm_exec_sql_text(sql_handle) qt CROSS APPLY sys.dm_exec_query_plan(plan_handle) qp where qp.query_plan.exist('declare namespace qplan="http://schemas.microsoft.com/sqlserver/2004/07/showplan"; //qplan:RelOp[@LogicalOp="Index Scan" or @LogicalOp="Clustered Index Scan" or @LogicalOp="Table Scan"]/qplan:IndexScan/qplan:Object[fn:lower-case(@Index)=fn:lower- case(sql:variable("@Index"))]')=1 ) GO |
Notice that I included the function ‘fn:lower-case‘, otherwise the function would be case-sensitive like xml.
Now the query to find the plans in the cache that do index scan over a specific index becomes as simple as a single select:
|
1 |
select * from dbo.FindScans('[pk_bigProduct]') |
The same applies to lookup problems :
|
1 2 3 4 5 6 7 8 9 10 11 12 13 14 15 16 17 18 19 20 21 |
CREATE FUNCTION FindLookups ( -- Add the parameters for the function here @Index varchar(50) ) RETURNS TABLE AS RETURN ( select qp.query_plan,qt.text from sys.dm_exec_query_stats CROSS APPLY sys.dm_exec_sql_text(sql_handle) qt CROSS APPLY sys.dm_exec_query_plan(plan_handle) qp where qp.query_plan.exist('declare namespace AWMI="http://schemas.microsoft.com/sqlserver/2004/07/showplan"; //AWMI:IndexScan[@Lookup]/AWMI:Object[fn:lower-case(@Index)=fn:lower- case(sql:variable("@Index"))]')=1 ) GO select * from dbo.FindLookups('[PK_TransactionHistory_TransactionID]') |
Now, the final touch: As we are creating re-usable functions, the best approach is to return more fields from sys.dm_exec_query_stats so the functions became more flexible.
The final functions will be like these:
|
1 2 3 4 5 6 7 8 9 10 11 12 13 14 15 16 17 18 19 20 21 22 23 24 25 26 27 28 29 30 31 32 33 34 35 36 37 38 39 40 41 42 43 44 45 46 47 48 49 50 51 52 53 54 55 56 57 58 59 60 61 62 63 64 65 66 67 68 69 70 71 |
Create FUNCTION [dbo].[FindScans] ( -- Add the parameters for the function here @Index varchar(50) ) RETURNS TABLE AS RETURN ( select qp.query_plan,qt.text, statement_start_offset, statement_end_offset, creation_time, last_execution_time, execution_count, total_worker_time, last_worker_time, min_worker_time, max_worker_time, total_physical_reads, last_physical_reads, min_physical_reads, max_physical_reads, total_logical_writes, last_logical_writes, min_logical_writes, max_logical_writes, total_logical_reads, last_logical_reads, min_logical_reads, max_logical_reads, total_elapsed_time, last_elapsed_time, min_elapsed_time, max_elapsed_time, total_rows, last_rows, min_rows, max_rows from sys.dm_exec_query_stats CROSS APPLY sys.dm_exec_sql_text(sql_handle) qt CROSS APPLY sys.dm_exec_query_plan(plan_handle) qp where qp.query_plan.exist('declare namespace qplan="http://schemas.microsoft.com/sqlserver/2004/07/showplan"; //qplan:RelOp[@LogicalOp="Index Scan" or @LogicalOp="Clustered Index Scan" or @LogicalOp="Table Scan"]/qplan:IndexScan/qplan:Object[fn:lower- case(@Index)=fn:lower-case(sql:variable("@Index"))]')=1 ) GO Create FUNCTION FindLookups ( -- Add the parameters for the function here @Index varchar(50) ) RETURNS TABLE AS RETURN ( select qp.query_plan,qt.text, statement_start_offset, statement_end_offset, creation_time, last_execution_time, execution_count, total_worker_time, last_worker_time, min_worker_time, max_worker_time, total_physical_reads, last_physical_reads, min_physical_reads, max_physical_reads, total_logical_writes, last_logical_writes, min_logical_writes, max_logical_writes, total_logical_reads, last_logical_reads, min_logical_reads, max_logical_reads, total_elapsed_time, last_elapsed_time, min_elapsed_time, max_elapsed_time, total_rows, last_rows, min_rows, max_rows from sys.dm_exec_query_stats CROSS APPLY sys.dm_exec_sql_text(sql_handle) qt CROSS APPLY sys.dm_exec_query_plan(plan_handle) qp where qp.query_plan.exist('declare namespace AWMI="http://schemas.microsoft.com/sqlserver/2004/07/showplan"; //AWMI:IndexScan[@Lookup]/AWMI:Object[fn:lower-case(@Index)=fn:lower- case(sql:variable("@Index"))]')=1 ) GO |
Summary
We can start by building a lot of queries that exploit the power of XQuery to search the execution plans stored in in cache to find opportunities to optimize queries and avoid potential problems. We can then turn these queries into functions to make them reusable. When creating new functions, it is well worth studying the schema of the execution plan and exercising due caution about the performance of the queries when using them on a production server. Though they are very handy in tracking performance problems, these queries aren’t fast.
Do you have any suggestions for queries over the cached execution plans? Please, share the queries you create using this technique or your suggestions for new queries over the cache.