
The series so far:
- Introduction to DAX for paginated reports
- How to filter DAX for paginated reports
- DAX table functions for paginated reports: Part 1
- DAX table functions for paginated reports: Part 2
- Tips and tricks with DAX table functions in paginated reports
Paginated reports in Power BI make heavy use of the DAX table functions. In the previous article you revised some of the core DAX table functions-such as SUMMARIZE(), ADDCOLUMNS() and GROUPBY(). This article will refresh your knowledge of some of the remaining table functions such as:
- UNION
- EXCEPT
- INTERSECT
- CALCULATETABLE
As well as these core table functions, it also helps to understand the DEFINE, EVALUATE and MEASURE functions as well as the use of variables in DAX queries when returning data to paginated reports, so the article reviews these also.
Once again, it is worth remembering that many of the DAX table functions have quirks and limitations that can trip up the unwary user in certain circumstances. However, the aim in this article is not to provide an exhaustive discussion of every available function and the hidden depths and rarer aspects of each one. Rather, the intention is to provide paginated report developers with an initial overview of the core tools that you will inevitably need to extract data for paginated reports from a Power BI dataset. This article will use the same sample file (CarsDataWarehouse.Pbix) that you saw in the previous articles in this short collection.
DAX Variables
Delivering more complex (or refined, if you prefer) output with DAX will inevitably involve the use of DAX variables. So now is a good time to introduce you to, or remind you about, DAX Variables. The first thing to remember is that DAX variables can contain:
- Scalar values
- Measures
- Tables (even single row tables)
- Variable measures (sometimes called Query Measures)
What is more, any of these elements can be “hard-coded” values. This can be extremely useful for testing & debugging when your DAX starts getting more complex.
Variables can be introduced at any point in the course of a DAX EVALUATE statement. However, for clarity, reusability and sheer elegance I often find it easier to specify variables at the top of the script using the DEFINE keyword, then use them as required inside the DAX query.
Scalar DAX variables
To get a better idea of how scalar DAX variables can be used, take a look at the following code snippet (where the parameter @Make is input as Ferrari):
|
1 2 3 4 5 6 7 8 9 10 11 12 13 14 15 |
DEFINE VAR CountryFilter = "France" VAR MakeFilter = @Make EVALUATE SUMMARIZECOLUMNS ( DimVehicle[Make] ,DimVehicle[Model] ,DimGeography[CountryName] ,FILTER(VALUES(DimGeography[CountryName]) ,DimGeography[CountryName] = CountryFilter) ,FILTER(VALUES(DimVehicle[Make]) ,DimVehicle[Make] = MakeFilter) ) ORDER BY DimVehicle[Make] |
The complete output from this query is as shown in the following image when typing in Ferrari at the prompt:
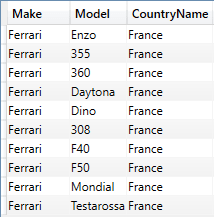
All that this piece of DAX does is to define two variables. The first one is given a value directly, the second is passed a value from the SSRS parameter @Make. So, overall, it is worth noting that:
- You can also pass a paginated report parameter to a DAX variable
- The order in which the DAX variables are introduced in the
DEFINEsection can be important – as they must be defined in the order in which they are later used in the DAX query. While most of the time this is not an issue, it can be a factor in large and complex DAX statements.
You can, of course, add the column(s) that you are filtering on to the output if you want to verify that the filter is working as you expect.
Measures
A DAX variable can also be a measure (a calculation if you prefer) – as you can see in the following short piece of DAX:
|
1 2 3 4 5 6 7 8 9 10 11 12 13 14 |
DEFINE VAR CountryFilter = "France" VAR TotalCost = SUM(FactSales[CostPrice]) EVALUATE SUMMARIZECOLUMNS ( DimVehicle[Make] ,DimVehicle[Model] ,DimGeography[CountryName] ,FILTER(VALUES(DimGeography[CountryName]) ,DimGeography[CountryName] = CountryFilter) ,"Cost per Model", SUM(FactSales[CostPrice]) ,"Percentage of Total Cost", SUM(FactSales[CostPrice]) / TotalCost ) |
The output (shortened) is as shown in the following image:
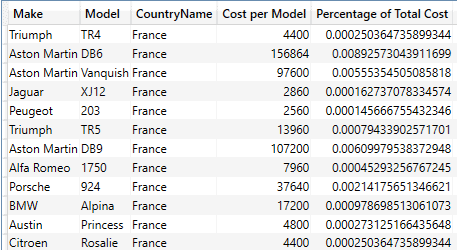
If you are verifying the output, remember that the DAX variable TotalCost is returning the cost for all makes for all countries – and the output table is showing only cars sold in France – and so the total of the Percentage of Total Cost is not 100%.
DAX Variables for Tables –
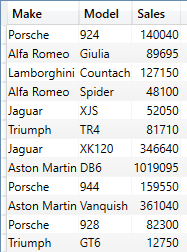
In the context of Paginated reports, you are more than likely to come to rely on DAX table variables as a pillar of your data extraction code. A simple example of how DAX table variables can be used is shown in the following short DAX snippet:
|
1 2 3 4 5 6 7 8 9 |
DEFINE VAR SalesTable = SUMMARIZECOLUMNS ( DimVehicle[Make] ,DimVehicle[Model] ,"Sales", SUM(FactSales[SalePrice]) ) EVALUATE SalesTable |
The output (shortened) is as shown in the following image:
Variable Measures
Variable measures – as distinct from merely attributing a measure to a variable can be useful in a couple of ways:
- They can simplify code structures as this approach allows you to isolate calculations from data retrieval.
- They are a clear aid to reusability.
- They can be very useful for the “dummy” measure that may be required to accelerate querying in the case of wide datasets.
As a simple example, the DAX shown below uses the MEASURE keyword to introduce a variable measure:
|
1 2 3 4 5 6 7 8 9 10 11 12 13 |
DEFINE VAR CountryFilter = "France" MEASURE FactSales[TotalCost] = SUM(FactSales[CostPrice]) EVALUATE SUMMARIZECOLUMNS ( DimVehicle[Make] ,DimVehicle[Model] ,DimGeography[CountryName] ,FILTER(VALUES(DimGeography[CountryName]) ,DimGeography[CountryName] = CountryFilter) ,"Total Cost", FactSales[TotalCost] ) |
The output (shortened) is as shown in the following image:
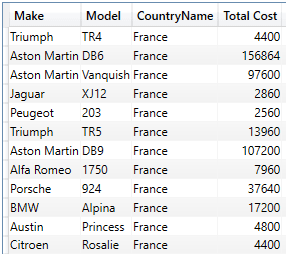
Be aware, however, that a variable measure:
- Has to be associated with a table
- Must be referred to using a fully qualified reference to the table and the measure.
EXCEPT, UNION and INTERSECT
As befits a data manipulation language, DAX includes three core table functions that you can use for set-based data manipulation. These are:
- EXCEPT()
- UNION()
- INTERSECT()
I assume that the concepts behind these functions are self-evident, so prefer to show one way that a couple of them can be useful to resolve certain common reporting challenges. For instance, you can apply EXCEPT() and UNION() to isolate certain records (which you analyse in detail) from all the remaining records (which you aggregate into a single row in the output table).
The principle behind the query that you are about to see is:
- Firstly, define an initial table by applying the core filters to return only the required data.
- Secondly, from this initial dataset (which is passed to a DAX table variable) extract two separate table variables:
- One containing the main data, aggregated by selected colours (the “detail” dataset).
- One that aggregates all the remaining records into a single record.
- Finally, output the two subsidiary datasets (selected group and other records aggregated into a single record) as a single table.
Here, then, is the actual code:
|
1 2 3 4 5 6 7 8 9 10 11 12 13 14 15 16 17 18 19 20 21 22 23 24 25 26 27 28 |
DEFINE VAR SrcTable = // The core data table containing all records SUMMARIZECOLUMNS( DimVehicle[Color] ,"Total", COUNTX(FactSales, FactSales[SalePrice]) ) VAR FullList = // The selected group of records to isolate SUMMARIZE ( FILTER ( SrcTable ,DimVehicle[Color] IN {"Black", "Blue", "British Racing Green", "Green"} ) ,DimVehicle[Color] ,"Total", COUNTX(FactSales, FactSales[SalePrice]) ) VAR RemainderList = // All other non-selected records EXCEPT(SrcTable, FullList) VAR GroupedRemainder = // All other records aggregated SUMMARIZE( RemainderList ,"ColumnTitle", "Other" ,"Total", COUNTX(FactSales, FactSales[SalePrice]) ) EVALUATE UNION(FullList, GroupedRemainder) // The final output |
The output (shortened) is as shown in the following image:
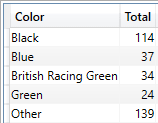
Of course, the set of records that is categorised (ie., not “other”) can be calculated using a more complex DAX query rather than simply being hard-coded as is the case here.
There is one main point to note here: SUMMARIZE() can be used not only to aggregate – but also to rename the element that is output. This is a useful trick when aggregating a table into a single record.
GROUPBY and SUMMARIZE
A variation on the theme above is to isolate all records that match a simple filter category, and then aggregate the others into a single record. This time, however, GROUPBY() and SUMMARIZE() are used in slightly different ways to achieve the same result. This is an example of how DAX table functions can be combined to solve certain paginated report challenges:
|
1 2 3 4 5 6 7 8 9 10 11 12 13 14 15 16 17 18 19 20 21 22 23 24 25 26 27 28 29 30 31 32 33 34 35 36 37 |
DEFINE VAR SrcTable = SUMMARIZECOLUMNS( DimCLient[ClientName] ,DimCLient[IsCreditRisk] ,"Total", COUNTX(FactSales, FactSales[SalePrice]) ) VAR FullList = SUMMARIZE ( FILTER ( SrcTable ,DimCLient[IsCreditRisk] = 0 ) ,DimCLient[ClientName] ,"Total", COUNTX(FactSales, FactSales[SalePrice]) ) VAR GroupedRemainder = GROUPBY ( FILTER ( SrcTable ,DimCLient[IsCreditRisk] = 1 ) ,DimCLient[IsCreditRisk] ,"Total", SUMX(CURRENTGROUP(), [Total]) ) VAR GroupedRemainderOutput = SUMMARIZE( GroupedRemainder ,"ColumnTitle", "Other" ,"Total", COUNTX(FactSales, FactSales[SalePrice]) ) EVALUATE UNION(FullList, GroupedRemainderOutput) |
The output (shortened) is as shown in the following image:
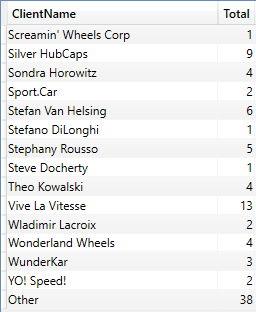
The points of note here are:
- The
GROUP BYactually aggregates into a single row of data – however it outputs “True” (the actual contents of the filter). SUMMARIZE()can be used simply to rename output.
CALCULATETABLE
As mentioned in the previous article, nesting filter criteria rapidly becomes wearing once you start nesting multiple criteria applied using multiple FILTER() functions. A more practical approach can be to wrap a function that returns a data table inside the CALCULATETABLE() function – and apply all the required filters as filter expressions. So, in essence you are applying CALCULATE() filters – to a table.
This approach will work not only with SUMMARIZECOLUMNS() – as you saw in the previous article – but also with SELECTCOLUMNS() and GROUPBY(). The following piece of DAX uses a SELECTCOLUMNS() function to define the table that you wish to use as the source table in the CALCULATETABLE() function, and then applies any required filters as part of the CALCULATETABLE() function:
|
1 2 3 4 5 6 7 8 9 10 11 12 13 14 15 16 17 |
EVALUATE CALCULATETABLE ( SELECTCOLUMNS ( FactSales ,"Client", RELATED(DimCLient[ClientName]) ,"City", RELATED(DimGeography[Town]) ,"Credit Risk", RELATED(DimCLient[IsCreditRisk]) ,"Country", RELATED(DimGeography[CountryName]) ,"Make", RELATED(DimVehicle[Make]) ) ,DimGeography[CountryName] = "France" ,DimVehicle[Make] = "Ferrari" ,DimCLient[IsCreditRisk] = 0 ) |
The output is as shown in the following image:
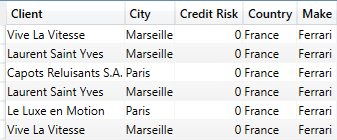
You need to note a few key complexities if you ever adopt this approach:
- You will need a clear understanding of the underlying data model in order to use
RELATED()if you are usingSELECTCOLUMNS() - There are many subtleties and variations on the theme of filtering data – some ideas and suggestions are given above (and in the previous article).
ANDlogic for filtering is easy when filtering this way. OR logic can be harder (and is explained in greater detail in the third and final article in this series).
Overall, this technique is best suited to simple list output. Also, it can get complex when using measures (given the intricacies of DAX context), so for this reason too is probably best used for relatively simple list output.
Filter tables in CALCULATETABLE()
CALCULATETABLE() can also be used with filter tables as well as (or instead of) simple filter elements of the kind that you just saw.
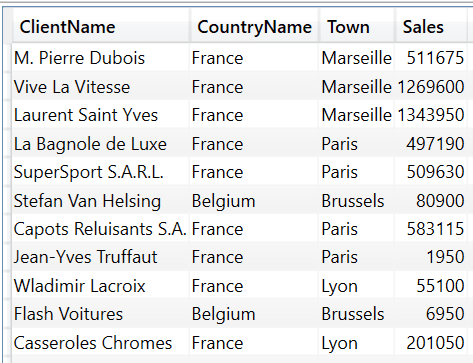
The following DAX extract creates a table variable of a list of country names and then uses the table variable as a filter element that is applied by CALCULATETABLE():
|
1 2 3 4 5 6 7 8 9 10 11 12 13 14 15 16 17 18 19 20 |
DEFINE VAR FilterTable = SUMMARIZE ( FILTER ( DimGeography, DimGeography[CountryName] in {"France", "Belgium"} ) ,DimGeography[CountryName] ) EVALUATE CALCULATETABLE( SUMMARIZECOLUMNS( DimCLient[ClientName] ,DimGeography[CountryName] ,DimGeography[Town] ,"Sales" , SUM(FactSales[SalePrice]) ) ,FilterTable ) |
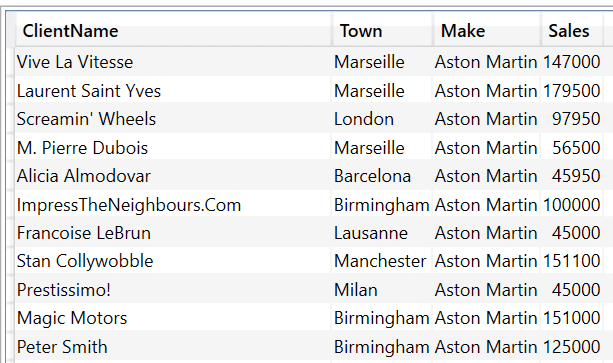
The output (shortened once again) is as shown in the following image:
In practice, this kind of approach can be more useful if the filter table is based on, say, a calculation. As an example, the following DAX sample creates a filter table that dynamically calculates the top two selling makes of car (by sales) and filters on the result:
|
1 2 3 4 5 6 7 8 9 10 11 12 13 14 15 16 17 18 19 20 21 22 |
DEFINE VAR TopSellersTable = TOPN( 2, SUMMARIZECOLUMNS ( DimVehicle[Make] ,"Total Sales", SUM(FactSales[SalePrice]) ), [Total Sales] ,DESC ) EVALUATE CALCULATETABLE( SUMMARIZECOLUMNS( DimCLient[ClientName] ,DimGeography[Town] ,DimVehicle[Make] ,"Sales" , SUM(FactSales[SalePrice]) ) ,TopSellersTable ) |
Part of the output from this code snippet is as shown in the following image:
Here too, you do not have to display the make in the output, but I have chosen to do so to prove that the filter table actually works.
ADDMISSINGITEMS
While we may have looked at the core, everyday use of SUMMARIZECOLUMNS() in the previous article, there are a couple of ways that this function can be extended that are worth knowing about. You may, one day need to use the ADDMISSINGITEMS() function to force rows to be returned that SUMMARIZECOLUMNS() would otherwise exclude.
This option of SUMMARIZECOLUMNS() forces the output of records (rows of data) that would not otherwise be returned by SUMMARIZECOLUMNS() when output rows otherwise equate to empty or Null. This is probably best appreciated using a simple example. The following code wraps a SUMMARIZECOLUMNS() function inside an ADDMISSINGITEMS() function – and specifies that the date and make should nonetheless be returned if the row is otherwise empty:
|
1 2 3 4 5 6 7 8 9 10 11 12 13 14 |
EVALUATE ADDMISSINGITEMS ( DimDate[FullYear] ,SUMMARIZECOLUMNS ( DimDate[FullYear] ,DimVehicle[Make] ,FILTER(VALUES(DimVehicle[Make]), DimVehicle[Make] = "Trabant") ,"Total", SUM(FactSales[SalePrice]) ) ,DimDate[FullYear] ) ORDER BY DimDate[FullYear], DimVehicle[Make] |
Running this code gives the following output:
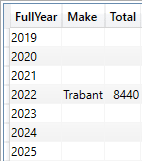
To make the comparison clearer, running the DAX without ADDMISSINGITEMS gives the following output:
![]()
Conclusion
As you have learned, there is a small suite of DAX table functions that you can use to return data to paginated reports from a Power BI dataset. A good understanding of the available functions – and how they can be used, individually or together – will help you to deliver the output that you wish to display in your paginated reports.
Remember that the aim of these two articles is not to provide an exhaustive and detailed overview of all the DAX table functions. The subject is simply too large for that. However, there are many excellent resources available if you wish to delve deeper into the myriad possibilities (and arcana) of table functions. What you have seen here is that you are not limited to SUMMARIZECOLUMNS() when returning tabular output from a Power BI dataset to a paginated report, and that there are several other functions that you may find useful – or even necessary – in certain circumstances.
However, returning basic tables of data is only one step on the path to delivering paginated reports. You may well need to know a plethora of tricks and techniques to solve real-world challenges. The next article in this series introduces some of the tips that you may well need when creating paginated reports using a Power BI dataset.