

Introduction
When there are multiple users in the Data Mining model, sometimes it is necesary to monitor their activity for two main reasons:
- Security
- Performance
Security, because you need to monitory the activity to detect if only the assigned user are using the Data Mining model and verify that nobody is doing illegal activities or accessing infomation that they are not supposed to have access to.
Performance, because when you have the information about the activities, it is possible to detect long running queries or other problems and even reproduce the real activity by recording the commands used.
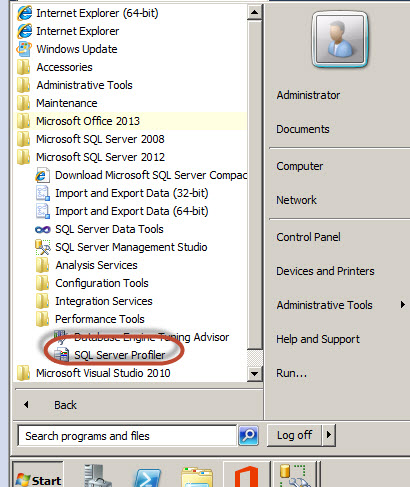
SQL Server Profiler
The SQL Server Profiler is a well-known program used for the relational databases, but not everybody knows that it can be used to monitor Data Mining activities. With SQL Server Profiler, you can monitor the users, the commands they are using, the application they are running, the time they are running the commands, the time the commands ends. The duration of the queries, the objects used, etc.
The SQL Server is part of the Performance Tools in SQL Server.
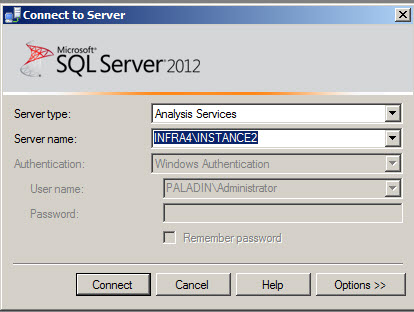
The SQL Server Profiler will ask where you want to connect. Select the Analysis Services Server Type and the instance where you have the Data Mining Model and press Connect.
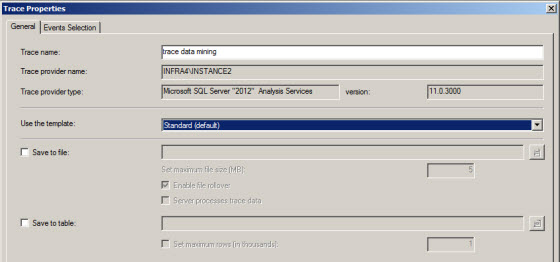
You can write any name for the trace and select a template. The Standard template is a good option. The Replay template is to reproduce the activity of your Data Mining model in another server. You can save a the trace information to a file or to a SQL Server.
For performance reasons, it is recommended you save the data to a file. If you need to write complex queries on the saved information, it is better to save to a table. This option will store the traced information in the SQL Server Database Relational Engine. It this example, check the Save to Table option.
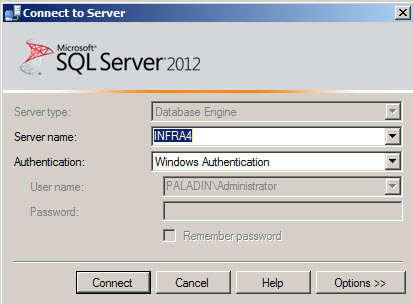
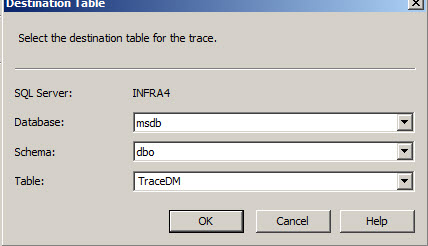
Select the Server Name of the SQL Server Database Engine where you want to store the information.
Select the database, schema and table where you will store all the information. If the table does not exist, this option will create a new one.
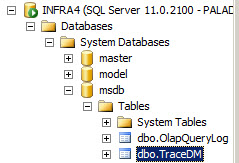
You can verify if the table was created.
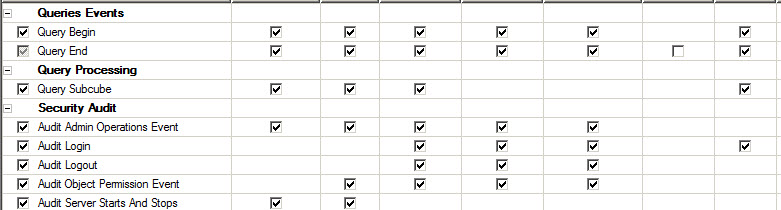
Once you have selected the table in SQL Server Profiler, press the Events Selection tab.
The Events contains are what will be monitored, the commands that we run, errors, discover commands, etc. Those items checked are captured.
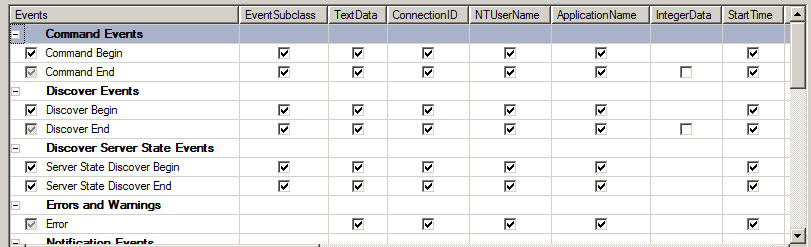
The query begin and end are very important because they will store the queries used in the Data Mining model. The Audit Login and Logout are important to detect intruders and to monitor the time that the users use the Data Mining Model.
For a detailed description about the Events, please refer to this link: SQL Server Profiler events.
You have also the ability to filter your columns and organize them. It is very important to use filters because the data collected is large in size, and you may want to reduce the data to only the necessary items for your purposes.
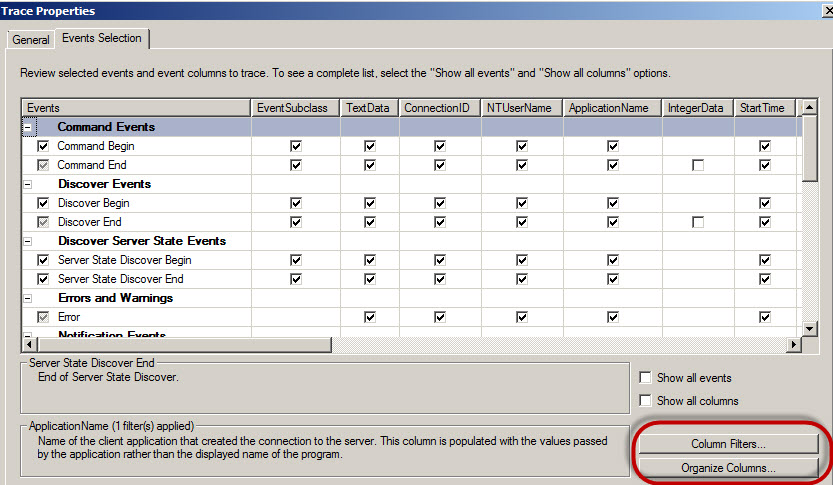
In the filter dialog, you have the columns listed on the left, and you can create the filters in the Like, Not Like section on the right.
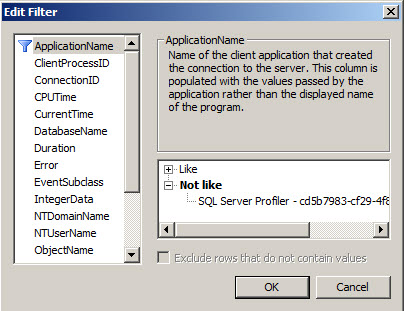
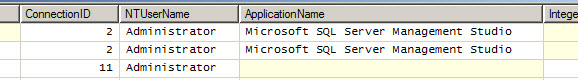
The Data collected by SQL Server Provider includes the ConnectionID, the Windows User Name, the Application used to connect to the Mining model and other columns. For a complete description about the Data Columns, refer the the following link: SQL Server Profiler Data Columns
Testing the SQL Profiler
Let's take a look to the SQL Profiler activity. In order to start generating events for the SQL Server Profiler go to the SQL Server Management Studio (SSMS) and open a Data Mining Model.
Create a query visually. If you are not familiar with Data Mining Queries, check the Part 1 of the Data Mining Series.
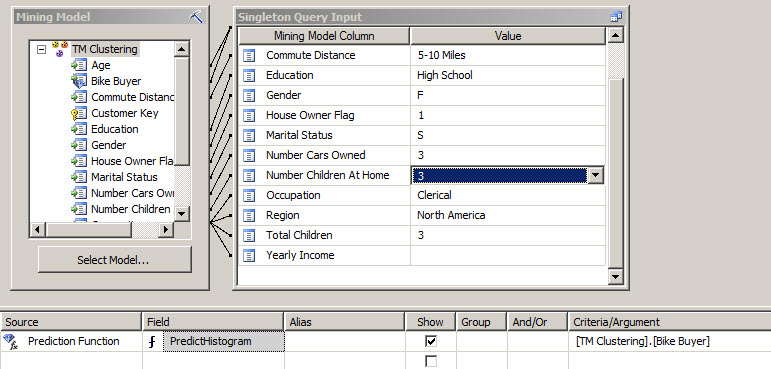
When you specify your values for the Data Mining Queries, internally some DMX queries are used.
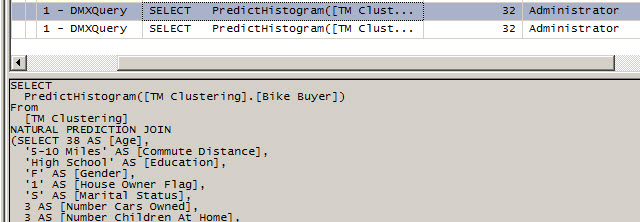
If you go to the Profiler, you will see the SELECT DISTINCT statements used.
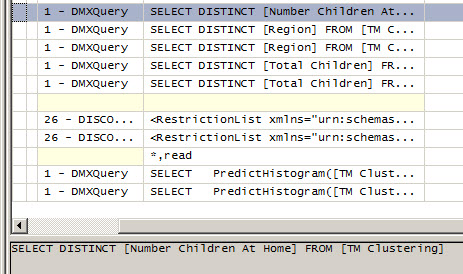
When you create a Prediction visually, you will also be able to see the internal DMX queries used.
The SQL Server profiler will show the DMX queries used.
You can also detect the Duration of the queries in miliseconds and detect the long running queries. For security pursposes, you can also detect the Windows User that runs the queries, the ApplicationName, Database name, etc.

You can also see the Profiler information when you Process a Data Mining Structure.
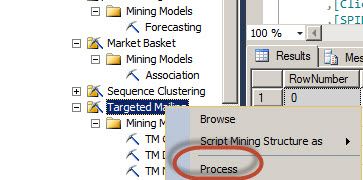
In the Profiler, you will be able to see the activity while processing. When reading Data Mining Cases, the Integer data column will show the number of cases read.

The profiler detects also the objects affected.

Conclusion
The Profiler is a complete tool to monitor the Data Mining activity. However, it stores a lot of information. That is why it is recommended to select carefully the events to monitor and to use the filters to store only the required information.
You can store all the information monitored by the SQL Server Profiler in a SQL Server table or in a file.
