
This is the tenth in a series on setting up a Data Science Laboratory server – the first is located here.
My plan is to set up a system that allows me to install and test various methods to store, process and deliver data. These systems range from simple text manipulation to Relational Databases and distributed file and compute environments. Where possible, I plan to install and configure the platforms and code locally. The outline of the series so far looks like this:
- Setting up the Data Lab
- Text Systems
- Testing the Tools
- Instrumentation
- Interactive Data Tools
- Programming and Scripting Languages
- Relational Database Management Systems
- Key/Value Pair Systems
- Document Store Databases
- Graph Databases (This article)
- Object-Oriented Databases
- Distributed File and Compute Data Handling Systems
I’ll repeat a disclaimer I’ve made in the previous articles – I do this in each one because it informs how you should read the series:
This information is not an endorsement or recommendation to use any particular vendor, software or platform; it is an explanation of the factors that influenced my choices. You can choose any other platform, cloud provider or other software that you like – the only requirement is that it fits your needs. As I always say – use what works for you. You can examine the choices I’ve made here, change the decisions to fit your needs and come up with your own system. The choices here are illustrative only, and not meant to sell you on a software package or vendor.
In this article, I’ll explain my choices for working with a Graph database. I’ll briefly explain the concepts and then move on to the methods you can use to use and manage the one I’ve chosen.
Concepts and Rationale
Data is not often modeled in computer systems by the way we see it in the real world. Data in traditional computing systems in neatly organized into chunks that work well in digital processing. But we often think more fluidly about the data we take in with our senses. Graph Databases use many of the same paradigms that we do to store and process data – but surprisingly, even though it accesses data in similar ways to our brains, it’s not necessarily easier to work with, if you’ve been trained in a Relational Database Management System (RDBMS) style. Since most readers on this site are familiar with a Relational Database Management System, I’ll use a “compare and contrast” format in the Concepts section.
Concepts
Relational Databases center around entities (think “nouns”) having multiple attributes, and the cardinality (direction and how many) of an entity’s relationship to another one. For instance, if you think of a person as an entity or table, a Relational Database would store the information about that person (name, height, weight) in a strictly-defined, strongly-typed set of columns. More attributes about that person that could be shared with another person (such as an address) are moved off into another entity (table) and then a Key is set up between them to show how many addresses a single person can have, and whether they have to have one to begin with. Most of us are familiar with this data design process.
In a Key/Value Pair (KVP) system, data is centered around a Key value. As long as there is a unique identifier (and you can always just generate one), you can include lots of data about the entity that you want to store. It can even be different for each “row”, or Key/Value Pair. It’s a very flexible system that doesn’t necessarily enforce a strict definition of the data you want to store before you store it. Of course, that means you can get bad data into the system more readily – so you have to handle things at the programming level more often than you would with a Relational Database system.
Document databases are similar to the KVP system. The data centers around a Document, which is a grouping of data with a specific shape. In both the KVP and the Document Database, your data does not have to be as “normalized”, or broken out into relationships, as they require for a well-constructed Relational Database.
Aiming for the Cloud
But we don’t often think of a person in attribute-heavy terms. When I think of my friend Brent or Paul, I don’t think about all of the data points that make up their persona. I more often think about them based on a relationship to something I’m doing or that I’ve seen. For instance, I’ll see a Scottish Heritage day advertised, complete with Haggis, and I think of my friend Paul, because he’ll actually claims to like Haggis (I think he’s just messing with me about that). I see a news program about Chicago and I think of my friend Brent.
A Graph Database centers less on a strictly defined entity than it does on the relationships – in fact, the two main concepts in a Graph system are the Nodes (or vertices, or entities) and the Relationships (or edges, or… well, relationships). In fact, if you add the fact that both of these objects have Properties (attributes), then you have the concepts down for working with a Graph Database system.
The reasons for the math terms of edges and vertices is because that the math concept of a graph is the basis for a Graph Database. And graphs (more on those in a moment) are very similar to the way I thought about Paul and Brent. One vertex (Haggis) led me to think of its edge (Paul). In fact, when I thought of Paul, I thought about SQL Server (another vertex) which was also related to Brent (another edge leading to another vertex). And so when I think about Paul, I often also think about Brent. We work like this in the “real world”. And that’s the driving concept behind a Graph Database.
The concepts around the math concept of graphs is much the same in a Graph Database, although a bit more simplified. And yet, while thinking in graphing terms is quite natural, working with a Graph Database in practices is much less intuitive, at least for those of us who are classically trained in relational database theory. You’re going to have to learn a little (or a lot) of another programming language to work with the system, and you will need to review the terms in graphing math a little more to get comfortable with querying the system.
References:
- You can read more about graphing math here: http://mathworld.wolfram.com/Graph.html and here: https://en.wikipedia.org/wiki/Graph_(mathematics)
Rationale and Examples
So when would you choose a Graph Database over an RDBMS, KVP or Document Database? The primary factor is when the data is more focused on relationships than lists. Graph Databases work very quickly across complicated related data – such as roads, social networks, paths that objects travel, monetary systems and many more. In an RDBMS, we often need to create complex relationships with join operations to get at the information involved in multiple tables. And the more complicated the join, the more we have to add tertiary and other tables to complete those relationships. In a Graph Database, you’ll more highly normalize a data model, and add lots and lots of relationships to each entity. It’s simpler to visualize, and very fast to traverse from one node to another node.
This cannon never got fired for buying a relational database
That isn’t to say you can’t add attributes to a node (edge), but that if you’re only concerned with lists, a Graph Database is less useful. But if you’re looking to find all of the people related to another group of people, or finding locations that are within a geographical range and are within your budget, open on Friday night, and accepts a certain credit card, a Graph Database can answer these questions quickly. And as new relationships and nodes (vertices and edges) are added, the system simply absorbs those changes, just as your mind does. When your brother and his wife have a new baby, you’re able to retain the relationships you had with them and add the new one to the baby – and Graph Databases work in much the same way.
You can simulate a Graph Database by using a set of Relational Database tables, in a KVP system, or even on a whiteboard – think memory map here. But of course I don’t want to simulate a Graph Database, I want to install and experiment with one on my laboratory system. So I’d like to install the software and experiment with a few data models and queries.
I should note here that there are a few kinds of graphing systems in mathematics and in computing software. I won’t go deep into detail in this article, but the type that lends itself well to ease of use and modeling is the Property Graph. There are other types of graphs, such as Hypergraphs and Triples, but for the purposes of my testing I found that the attribute-heavy and more simplistic model of the Property Graph suited my needs best. You can read more about all of these graph systems along with the things they focus on in the book called “Graph Databases” by Ian Robinson, Jim Webber, and Emil Eifrem.
There are less “pure” Graph Databases than other types of data storage systems. I say “pre” because some are implemented as code constructs, and don’t rely on a proprietary engine or data storage type. Again, like all the systems I’ve chosen so far for my laboratory computer, I wanted something that was well documented, in relatively high use, and something that installs on Microsoft Windows. In this space there are actually only a few contenders, and the one that is commercially available and in wide use that I chose is Neo4J – located here: http://www.neo4j.org/download/windows. This page also contains the installation instructions, tutorials, language structure, and even a free copy of the book I recommended a moment ago.
Installation
I started at the link above after ensuring my system was up to date on all patches – especially Java, which Neo4J uses.
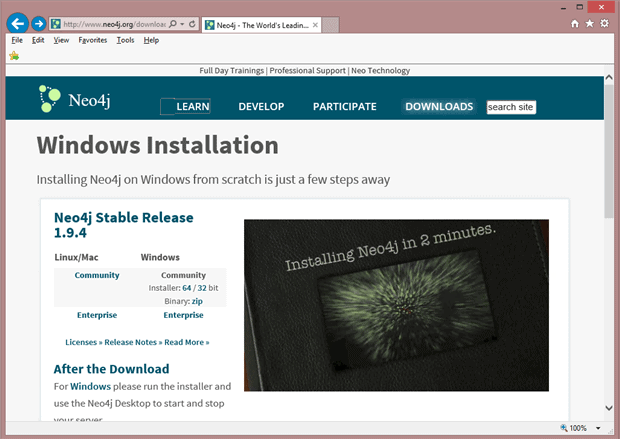
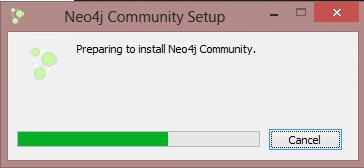
I clicked on the Installer: 64 Bit link and accepted the download, which started the installer:
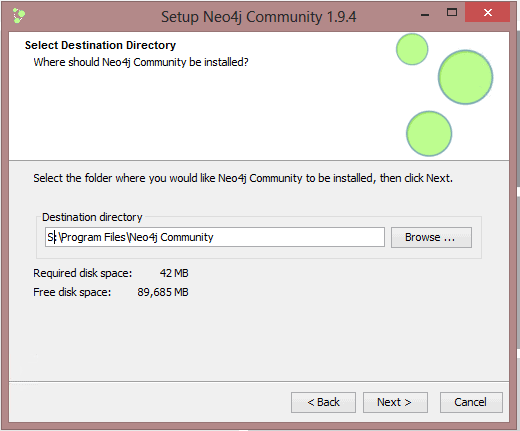
I changed the folder selections for the binary files, since I want to be able to run this on a Virtual Machine and Windows Azure. In Windows Azure, the best practice is to store data and other binaries on a secondary drive.
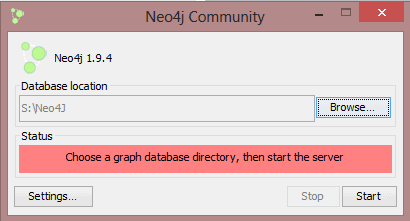
When the installation completed, I’m prompted to select a default database location. I’ve changed it to the S: drive and created a directory there called Neo4J to make the data location obvious during my testing. I’ll read up on the preferred locations and settings later – for now, I’ll use these settings on my test machine.
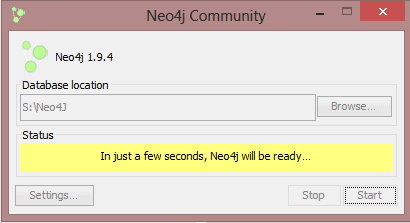
I’m told the system will start in a few moments…
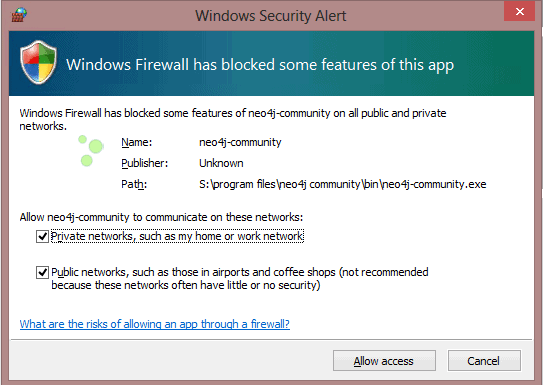
And then my system prompts me to allow the network firewall to allow ports to open. I’ll accept this for now since I’ll start and stop this service manually, but I’ll research this to see if it presents a security risk.
From there the system tells me it’s ready.
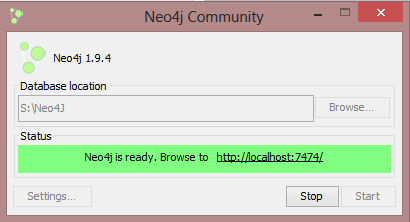
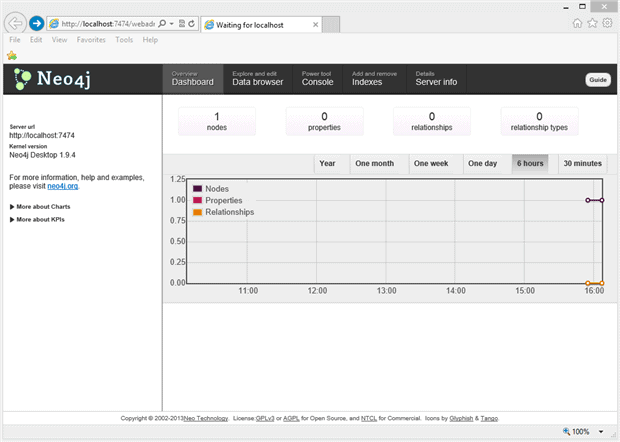
The management portal is located at the link referenced in the graphic (http://localhost:7474). After a moment, I’m shown the startup guide.
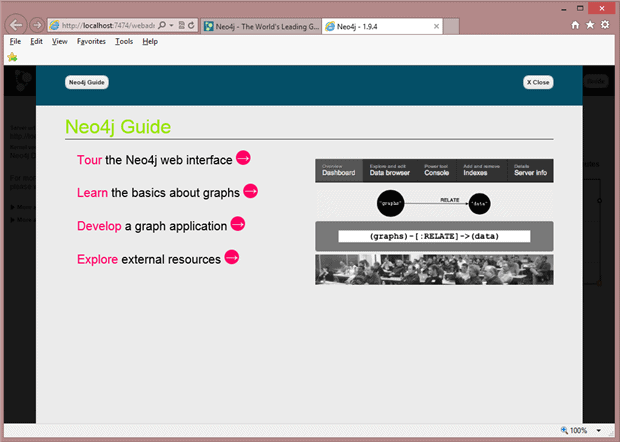
I’ll start with a tour of the interface, and then move on to developing a Graph Database and an application to hit it.
I’ll start by creating a simple Neo4J database. I can do this graphically using the main tool, but the most efficient way to work with Neo4J is through an Application Processing Interface, or API. There are several you can use with Neo4J, but the native language and processing is done in an internal language called “Cypher”. The query structure is a little different than what you might be used to – it uses ASCII art to textually create and navigate objects.
Cypher (learn more about it here: https://neo4j.com/developer/cypher-query-language/) is similar to the Sequential Query Language (SQL) you might be familiar with in at least one aspect: the primitive commands are simple to learn, and you add more and more statements, predicates and so on to “build out” the query you want. I’ll start with creating a few Nodes that act as the nouns I want to work with.
Since I’m focusing on relationships, I’ll create a “Subject Matter Experts” system so I can quickly locate people that know things that I don’t (this makes me look much smarter than I really am).
Brent Ozar knows a lot about Virtualization with SQL Server, and also about SAN technologies with databases. Another friend, Paul Randal, knows a lot about SQL Server, and specifically how the database engine works. All of these folks are members of the Professional Association of SQL Server (PASS) as well. Obviously there are a lot of smart folks out there on SQL Server, but I’ll limit this example to these two people, two technologies, and one organization. I can use that to test the Cypher Query language.
I’ll start with creating the Nodes, and then the relationships. First, Neo4J has to be running – so I start my system, and then navigate to S:\Program Files\Neo4j Community\bin and type neo4j-community.exe. That brings up the graphical panel shown below:
Yes, there is a way to start the system in automatic mode, but in my case I’m running on a test system so I’ve left it to start manually.
With that started, I’ll open up a web browser and navigate to http://localhost:7474/webadmin/. That gives me a view of the system where I can graphically create and manage objects or work with the Cypher language (there’s also a shell from the command-line, but at this writing it doesn’t ship with the Windows install – although you can add it with Java if you’re brave).
I’ll click on the “Console” option in the top bar to start a query window.
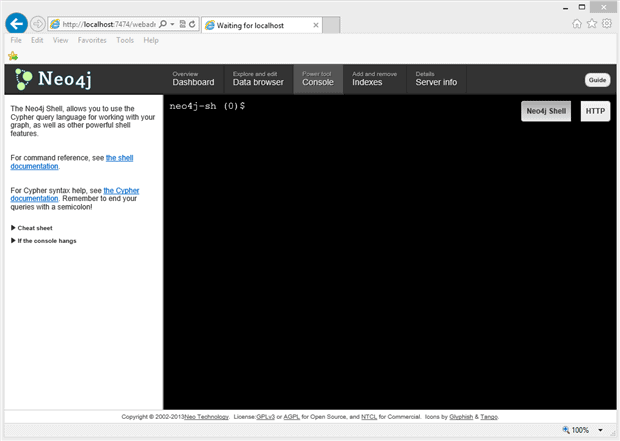
Now I can type Cypher commands. The general format for creating nodes is (as I mentioned earlier) an ASCII graphical style – it uses parentheses ( ) for Nodes , and dashes, arrows and brackets – [ ] – > for relationships. It’s most common to start with your main Nodes (although adding or changing them is fairly simple, as I’ll describe in a moment) and then add the relationships after.
We’ll start here, and I’ll explain this code later in a moment. This is a simple select to show all the nodes – hopefully, nothing returns (yet):
|
1 |
START n=node(*) RETURN n; |
The START command gives the system the command to begin transversing the graph at a certain node. I just chose the letter “n” as a variable name, which lets me work with it later on. I set that “n” to the node() function, which is a function that works with the nodes of the graph. Instead of passing the number (or name) of a node, I used the asterisk, which means the “head” node. The RETURN command then displays the results – of the “n” variable. And of course since you’re writing code you need that semi-colon.
And there you have it – one of the simplest of Cypher queries. Like SQL or other languages, you simply begin building code on code.
To create a node, you use the CREATE function, followed by a variable name, and optionally any attributes the node wants, surrounded by braces. If you add a comma, you can string operations together.
I’ll create Brent, Paul, the organization for SQL Server (PASS) and two technology nodes:
|
1 2 3 4 5 |
CREATE (bo { name: "Brent Ozar", type: "SME" }), (pr { name: "Paul Randal", type: "SME" }), (pa { name: "PASS", type: "Organization" }), (sa { name: "SAN", type: "Technology" }), (en { name: "SQL Server Engine", type: "Technology" }), |
Notice I’ve got a comma there, so I can keep going. If you’re following along at home, don’t type this paragraph in of course. With the nodes created, I’d like to relate them to each other. I’ll chain the CREATE command in the previous section with the [: RelationShip_Name] syntax to create relationships between all the nodes. Note that the relationships are one-way in this example, so I repeat some of them with the other direction as well. Can you read it? Answers below the code.
|
1 2 3 4 5 6 7 8 9 10 |
(bo)-[:KNOWS {status: "Current"}]->(pr), (bo)-[:KNOWS {rating: 5}]->(sa), (bo)-[:BELONGS_TO]->(pa), (pr)-[:KNOWS]->(bo), (pr)-[:KNOWS]->(en), (pr)-[:BELONGS_TO]->(pa), (pa)-[:HAS_MEMBER]->(pr), (pa)-[:HAS_MEMBER]->(bo), (sa)-[:KNOWN_BY]->(bo), (en)-[:KNOWN_BY]->(pr); |
Here’s the graph:
- Brent knows Paul
- Brent knows SAN technology, with a rating of 5 on that knowledge (whatever that means)
- Brent belongs to PASS
- Paul knows Brent
- Paul knows SQL Server Engine technology
- Paul belongs to PASS
- PASS has a member called Paul
- PASS has a member called Brent
- SAN Technology is known by Brent
- Engine Technology is known by Paul
Pretty easy to read, once you get used to it. And adding new relationships or nodes is just as easy – nothing to modify or update, just add with the CREATE command.
With the graph nodes and relationships in place, I can show them all with the START and RETURN commands:
|
1 |
START n=node(*) RETURN n; |
Now I want to find out a little information on Brent. I’ll start with his node, and see what I can see:
|
1 |
START sme=node(*) WHERE sme.name! = "Brent Ozar" RETURN sme; |
I can use the WHERE clause to constrain the results, check for existence and more. Now I’ll check for any friends that Brent might have:
|
1 |
START bo=node(*) MATCH (bo)-[:KNOWS]->(friends) WHERE bo.name! = "Brent Ozar" RETURN friends; |
And now I can show all relationships in the entire graph:
|
1 |
START n=node(*) MATCH (n)-[r]->(m) RETURN n,r,m; |
Or show how many Subject Matter Experts I have:
|
1 |
START n=node(*) RETURN "The SME Graph has "+count(*)+" Nodes" as description_count; |
To be sure, the language takes a little getting used to – and there are many ways to do this same things. That’s the purpose of a test system, after all. The real power in a Graph system comes when you add visual elements to it – and allow your end-users to navigate using graphical tools. I recommend you follow the tutorial there in the main interface after you install it – I found it very useful to get started.
References:
The Cypher Query Language in the examples I created is detailed here: https://neo4j.com/docs/developer-manual/current/get-started/cypher/.
References:
There are other ways to connect to Neo4J in addition to working from the console. You can read more about those here: http://www.neo4j.org/develop/drivers.
In the next installment, I’ll cover Object Oriented Databases that I’ll work with in the laboratory.