
Let’s start by defining what the statistical median is. From the Wiki page for the median it is described as follows:
“The median is the numerical value separating the higher half of a data sample, a population, or a probability distribution, from the lower half.”
The median is an important measure to be able to calculate for data, because it underlies the ways we calculate probability. It is difficult to draw valid conclusions from data without being able to calculate the median. In some statistical analyses, the median is a better predictor of the expected value for a set of observations than the mean (average). To calculate the median, in the simplest terms, if you have an odd number (n) of items in an ordered set, the median is the value where (n+1)/2 is the row containing the median value. If there is an even number of rows, the value is the average (mean) of the two values appearing in the n/2 and the 1+n/2 rows. All divisions in this description are integer divisions and standard operator precedence applies. When a set is partitioned it means that one or more columns, when aggregated together, form a group or partition.
I’m not sure exactly what got me to thinking about calculating the median in SQL, but it was long ago and I realized almost immediately that this could be quite a challenging assignment. SQL didn’t, at the time, have available any built-in functions for the purpose and I did find quite a few competing solutions out there but no clarity on the performance of the various methods.
When I eventually got back to thinking about median, it was mainly because I found that SQL 2012 now offers an analytic function called PERCENTILE_CONT that is capable of calculating the median within a partitioned set when it is passed an argument of 0.5 and the ordering within that set is specified.
I decided that I’d try to find the best solution for calculating a median and see how PERCENTILE_CONT compared with other approaches. My initial investigation led me to a page on the StackOverflow web site that listed quite a few competing solutions. Close examination of them identified several that really didn’t work worth a hoot; some even delivering incorrect results, but more importantly it led me to Aaron Bertrand’s article published in August of 2012 entitled: What is the fastest way to calculate the median? Much to my chagrin, he had pretty well covered the topic of performance.
However, as Adam Machanic pointed out in a response to Aaron Bertrand’s article, it would be nice to see which solutions proved fastest across partitioned sets, and that was my intent all along!
Setting up Some Test Data and my Testing Methodology
The SQL script below will create and populate a table for testing that each proposed solution returns the correct results set for the median within each partition (ID). We’ve added the non-unique index to include our IDs and values (N) because we expect most solutions will benefit from it. We’ll be testing our solutions with and without this index.
|
1 2 3 4 5 6 7 8 9 10 11 12 |
CREATE TABLE #MedianValues ( ID INT ,N INT ); CREATE INDEX i1 ON #MedianValues (ID, N); INSERT INTO #MedianValues VALUES (1,1),(1,2),(1,3),(1,4),(1,5) ,(2,1),(2,2),(2,3),(2,4) ,(3,10),(3,2),(3,10),(3,4) ,(4,1),(4,5),(4,1),(4,3),(4,3); |
The data contains four sets: two with an even number of rows and two with an odd number of rows, each with and without duplicates. We’ve chosen this simple data because it is pretty easy to see by inspection what the correct value for the median is within each partition. It is important to include duplicates because a few of the solutions I examined were failing for that case.
|
1 2 3 4 5 |
ID Ordered Sets Median 1 {1, 2, 3, 4, 5} 3 2 {1, 2, 3, 4} 2.5 3 {2, 4, 10, 10} 7 4 {1, 1, 3, 3, 5} 3 |
My testing methodology is to create or adapt a solution from the non-partitioned sets case, check using the test data above to make sure it generates the correct median value for each set, and then run that code through a 1,000,000 row test harness (described later) to see how it performs vs. a baseline case. To save our readers time, we’ve included only solutions here that did reasonably well in the 1M row test harness and returned correct results.
Solution #1: From Aaron Bertrand’s Article
If we take a look at Aaron Bertrand’s article linked above, we see from the performance results that there were two solutions that seemed to provide the best performance in his test cases. These were labelled as 2005_C and 2012_B. In the code below, I have adapted the 2005_C solution to the partitioned sets case and we’ll use this as the baseline for our initial performance test.
|
1 2 3 4 5 6 7 8 9 |
SELECT ID, Median = AVG(1.0 * N) FROM ( SELECT ID, o.N, rn=ROW_NUMBER() OVER (PARTITION BY ID ORDER BY o.N), c.c FROM #MedianValues AS o CROSS APPLY (SELECT c=COUNT(*) FROM #MedianValues b WHERE o.ID=b.ID) AS c ) AS x WHERE rn IN ((c + 1)/2, (c + 2)/2) GROUP BY ID; |
Note that Aaron Bertrand attributes this solution to SQL MVP Itzik Ben-Gan, but from here on out we’ll refer to it as “Aaron Bertrand’s solution” to give credit to him for reporting on its performance.
Try as I might, I was unable to adapt case 2012_B (a paging approach also suggested by Mr. Itzik Ben-Gan) to partitioned sets. Perhaps someone more familiar with using SQL 2012 paging in that way might have more success. A pity too as it was the fastest of all the solutions he tested.
Solution #2: Using the SQL 2012 PERCENTILE_CONT Analytical Function
I indicated at the beginning that I was interested to see how various solutions compared performance-wise against the new SQL 2012 analytical function PERCENTILE_CONT. In his article, Aaron Bertrand showed quite clearly that it didn’t perform nearly as well as Solution #1. But just to be sure, and for comparative purposes we coded up this solution against our test data.
|
1 2 3 4 5 6 7 8 |
SELECT ID, Median=MAX(Median) FROM ( SELECT ID, N ,Median=PERCENTILE_CONT(0.5) WITHIN GROUP (ORDER BY N) OVER (PARTITION BY ID) FROM #MedianValues ) a GROUP BY ID; |
Note that PERCENTILE_CONT is designed to include the partitions’ median value in each row of the subject set, so in order to condense that to just the partitions we need to have a GROUP BY. Clearly the solution is pretty succinct and once you get used to the new syntax, reasonably easy to understand.
Using our testing methodology, we ran this solution in our 1M row test harness against the baseline (Solution #1) and tabularized those results with and without the INDEX.
|
Solution |
With INDEX |
Without INDEX |
||
|
CPU(ms) |
Elapsed(ms) |
CPU(ms) |
Elapsed(ms) |
|
|
#1: Baseline |
2573 |
2894 |
2883 |
3172 |
|
#2: SQL 2012 |
6163 |
5540 |
13432 |
3947 |
|
#2 % O/(U) #1 |
140% |
91% |
366% |
24% |
The last row of the table (#2 % O/(U) #1) is calculated as 100*(#2 – #1)/#1, making it easy to observe the magnitude of the difference between the solutions. Positive numbers mean #2 is slower than #1. The best case (elapsed time without the INDEX) showed that PERCENTILE_CONT was 24% slower than Solution #1. This verifies the results that Aaron Bertrand published in his article.
Solution #3: Let’s Try Something New
When I write an article I try to make sure I can contribute something new. Given the plethora of solutions out there for the problem of calculating median, I knew I’d need to use something unusual otherwise anything I come up with would either have already been suggested or be derivative.
I fell back upon a relatively obscure technique that became available in SQL 2008 for doing un-pivot, using CROSS APPLY with a Table Row Constructor (also known as the CROSS APPLY VALUES approach to UNPIVOT). The idea came to me because I needed to develop the counts across each partition and then calculate the rows to retrieve from that. In some cases (odd number of rows) there was one row of interest, while in the other (even number of rows) there were two rows of interest. Since both are calculated from the count of rows, we’ll use this approach to un-pivot them. Here is my solution to this problem:
|
1 2 3 4 5 6 7 8 9 10 11 12 13 14 15 16 17 18 19 20 21 22 23 24 25 26 27 28 29 |
WITH Counts AS ( SELECT ID, c FROM ( SELECT ID, c1=(c+1)/2, c2=CASE c%2 WHEN 0 THEN 1+c/2 ELSE 0 END FROM ( SELECT ID, c=COUNT(*) FROM #MedianValues GROUP BY ID ) a ) a CROSS APPLY (VALUES(c1),(c2)) b(c) ) SELECT a.ID, Median=AVG(0.+b.N) FROM ( SELECT ID, N ,rn=ROW_NUMBER() OVER (PARTITION BY ID ORDER BY N) FROM #MedianValues a ) a CROSS APPLY ( SELECT N FROM Counts b WHERE a.ID = b.ID AND a.rn = b.c ) b GROUP BY a.ID; |
In the Counts Common Table Expression (CTE), our inner derived query calculates the counts across each partition. From that we calculate c1 (the row number needed for the odd rows case) and c2 when needed for the additional row we need for the even numbered rows case. Finally, we use CROSS APPLY VALUES on c1, c2 to un-pivot them to separate rows, thus creating a table we can CROSS APPLY back to our original table on the partition elements and the calculated row numbers.
While it looks complicated, a quick check of the results against the sample data shows that the correct results are generated, and a look at the performance against 1M rows of test data looks promising against our baseline query.
Solution #4: Another Solution From Aaron Bertrand’s Article
In the same response to Aaron Bertrand’s article where he suggested checking cases for calculating medians against partitioned sets, Adam Machanic suggested another solution. I have done my best to adapt the solution he proposed as directly as possible to the partitioned sets case. Since this was not one of the solutions Aaron Bertrand tested, I was curious how it might perform for this case.
|
1 2 3 4 5 6 7 8 9 10 11 12 13 14 15 16 17 18 |
WITH Counts AS ( SELECT ID, c=COUNT(*) FROM #MedianValues GROUP BY ID ) SELECT a.ID, Median=AVG(0.+N) FROM Counts a CROSS APPLY ( SELECT TOP(((a.c - 1) / 2) + (1 + (1 - a.c % 2))) N, r=ROW_NUMBER() OVER (ORDER BY N) FROM #MedianValues b WHERE a.ID = b.ID ORDER BY N ) p WHERE r BETWEEN ((a.c - 1) / 2) + 1 AND (((a.c - 1) / 2) + (1 + (1 - a.c % 2))) GROUP BY a.ID; |
The results from this query are correct for our four sets case and the performance results from our test with 1M rows look extremely promising.
The Performance Test Harness
In order to create a 1,000,000 row test harness, we’ll make use of our old and trusted friend the Tally table. In this case, we’ll be CROSS JOINing two sys tables with a ROW_NUMBER() to get 1M rows, but any other Tally table you prefer will do.
|
1 2 3 4 5 6 7 8 9 10 11 12 13 14 15 16 |
DECLARE @N INT = 10000; -- 10,000 = ~1,000,000 rows WITH Tally (n) AS ( SELECT TOP (@N) ROW_NUMBER() OVER (ORDER BY (SELECT NULL)) FROM sys.all_columns a CROSS JOIN sys.all_columns b ) INSERT INTO #MedianValues SELECT a.n, ABS(CHECKSUM(NEWID()))%@N -- Always create exactly 100 IDs from the Tally table FROM (SELECT TOP 100 n FROM Tally) a -- Generate either an odd or even number of rows within IDs CROSS APPLY ( SELECT TOP (@N-a.n%2) n FROM Tally )b; |
Note that our test harness only generates “approximately” one million rows. Within the CROSS APPLY, there is a TOP statement that ensures that for successive IDs, we’ll include either an odd or an even number of rows within that partition. This helps to ensure that any solution that is biased either towards even or odd numbers of rows, will be handled fairly. So for each million rows we’re actually about 50 rows short, but that’s close enough for our purposes.
Performance Test Results
Before graphing the performance results, we decided to eliminate those from PERCENTILE_CONT, because at larger row counts that solution tended to obscure the differences between the other results. In all cases, solutions #1, #3 and #4 were faster in both elapsed time and CPU time.
The first graphic compares the elapsed times from 1M to 4M rows, with and without the INDEX. Solutions are numbered as above with author’s initials included (AB=Aaron Bertrand, DC=Dwain Camps and AM=Adam Machanic). I will take this opportunity to apologize to Mr. Bertrand, Mr. Machanic and Mr. Ben-Gan if I’ve adapted their solutions in a different way than they would have preferred.
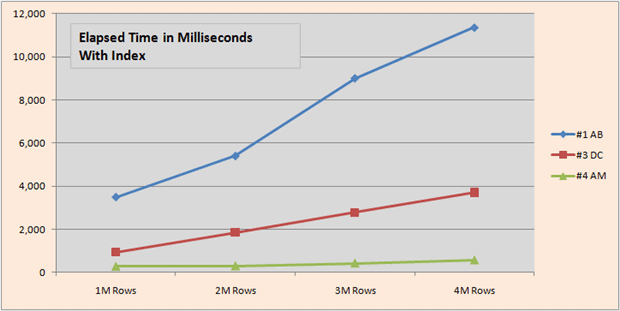
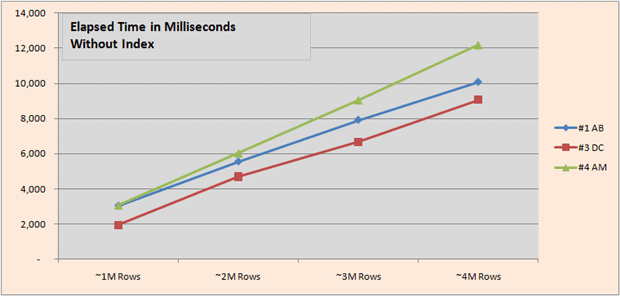
We see that with an INDEX, Adam Machanic’s solution is significantly faster than the others, while without an INDEX my solution manages a slight lead.
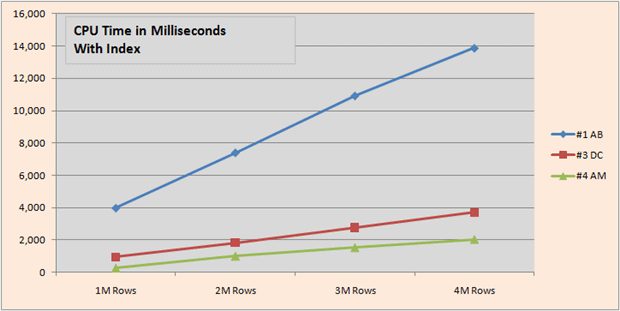
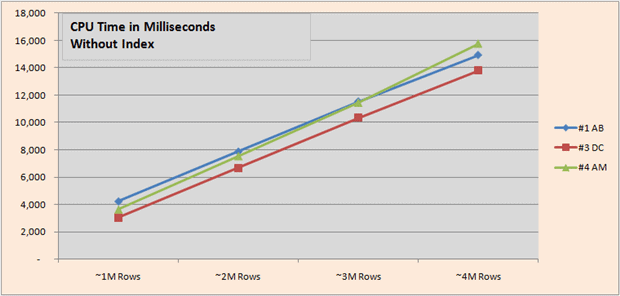
CPU times tell a similar story to elapsed times, although mine with an index doesn’t trail in CPU time quite as much as it did in elapsed time.
All of our performance tests were done in SQL 2008 R2 (64 bit) running on Windows 7 Professional (64 bit) using a Dell Inspiron laptop w-Intel Core i5-2430M @ 2.4 GHz, 8GB RAM.
SQL Profiler was used to capture the results of five runs for each row set and Excel was used to calculate from this an average for elapsed and CPU times.
Conclusion
We have explored some of the available T-SQL solutions for calculating the statistical median in this article. We included the built-in SQL 2012 function in our initial 1M row test, PERCENTILE_CONT but we eliminated it from our final graphic results because it generally does not appear to be a “high performance” solution, as Aaron Bertrand previously showed for the case of sets without partitions. Even though the syntax is new this solution does seem rather simple to understand, so in the rare cases where understandability is more important than performance, it still offers some merit.
All solutions provided focus specifically on data that contained partitioned sets.
We’ve seen that in the worst case for the solutions we explored in depth, four million data rows partitioned into 100 sets could be processed in about 12 seconds or less, which in my opinion is not too bad. We found that in the case of data that is indexed, Mr. Machanic’s solution was able to rip through that same four million rows in about 0.5 second, which was pretty remarkable.
If you have a favorite method to calculate the median that we didn’t cover, please feel free to add it to one of the test harnesses described below.
- Basic Test Harness for Median.sql – A basic test harness that allows testing against known sets of 1M rows of test data.
- Profiler Test Harness for Median.sql – Designed for use with SQL Profiler (to run each batch five times), this test harness suppresses the output results from each query.
If you find that it is a contender in either elapsed or CPU time, we’d love to hear about it in the comments section below.