Have you ever noticed that your archived redo logs can be much smaller than the online redo logs and may display a wild variation in size? This difference is most likely to happen in systems with a very large SGA (system global area), and the underlying mechanisms may result in Oracle writing data blocks to disc far more aggressively than is necessary. This article is a high-level description of how Oracle uses its online redo logs and why it can end up generating archived redo logs that are much smaller than you might expect.
Background
I’ll start with some details about default values for various instance parameters, but before I say any more, I need to present a warning. Throughout this article, I really ought to keep repeating “seems to be” when making statements about what Oracle is (seems to be) doing. Because I don’t have access to any specification documents or source code, all I have is a system to experiment on and observe and the same access to the documentation and MOS as everyone else. However, it would be a very tedious document if I had to keep reminding you that I’m just guessing (and checking). I will say this only once: remember that any comments I make in this note are probably close to correct but aren’t guaranteed to be absolutely correct. With that caveat in mind, start with the following (for 19.3.0.0):
Processes defaults to cpu_count * 80 + 40
Sessions defaults to processes * 1.5 + 24 (the manuals say + 22, but that seems to be wrong)
Transactions: defaults to sessions * 1.1
The parameter I’ll be using is transactions. Since 10g, Oracle has allowed multiple “public” and “private” redo log buffers, generally referred to as strands; the number of private strands is trunc(transactions/10). and the number of public strands is trunc(cpu_count/16) with a minimum of 2. In both cases, these are maximum values, and Oracle won’t necessarily use all the strands (and may not even allocate memory for all the private strands) unless there is contention due to the volume of concurrent transactions.
For 64-bit systems, the private strands are approximately 128KB and, corresponding to the private redo strands, there is a set of matching in-memory undo structures which are also approximately 128KB each. There are x$ objects you can query to check the maximum number of private strands but it’s easier to check v$latch_children as there’s a latch protecting each in-memory undo structure and each redo strand:
|
1 2 3 4 5 6 7 8 |
select name, count(*) from v$latch_children where name in ( 'In memory undo latch', 'redo allocation' ) group by name / |
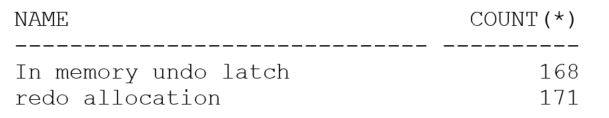
The difference between the number of redo allocation latches and in-memory undo latches tells you that I have three public redo strands on this system as well as the 168 (potential) private strands.
The next important piece of the puzzle is the general strategy for memory allocation. To allow Oracle to move chunks of memory between the shared pool and buffer cache and other large memory areas, the memory you allocate for the SGA target is handled in “granules” so, for example:
|
1 2 3 4 |
select component, current_size, granule_size from v$sga_dynamic_componentsa where current_size != 0 / |
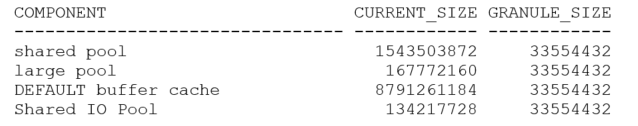
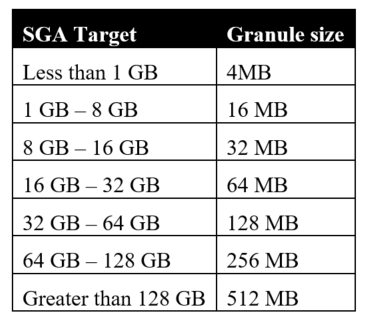
This is a basic setup with a 10GB SGA target, with everything left to default. As you can see from the final column, Oracle has decided to handle SGA memory in granules of 32MB. The granule size is dependent on the SGA target size according to the following table:
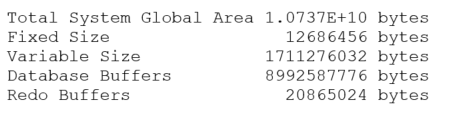
The last piece of information you need is the memory required for the “fixed SGA” which is reported as the “Fixed size” as the instance starts up or in response to the command show sga (or select * from v$sga), e.g.:
|
1 |
SQL> show sga |
Once you know the granule size, the fixed SGA size, and the number of CPUs (technically the value of the parameter cpu_count rather than the actual number of CPUs) you can work out how Oracle calculates the size of the individual public redo strands – plus or minus a few KB.
By default, Oracle allocates a single granule to hold both the fixed SGA and the public redo strands, and the number of public redo strands is trunc(cpu_count/16). With my cpu_count of 48, a fixed SGA size of 12,686,456 bytes (as above), and a granule size of 33,554,432 bytes (32MB), I should expect to see three public redo strands sized at roughly:
|
1 |
(33,554,432 – 12,686,456) / trunc((48 / 16)) = 20,867,976 / 3 = 6,955,992 |
In fact, you’ll notice if you start chasing the arithmetic, that the numbers won’t quite match my predictions. Some of the variations are due to the granule map, and other headers, pointers and other things I don’t know about in the granule that holds the fixed SGA and public redo buffers. In this case, the actual reported size of the public strands was 6,709,248 bytes – so the calculation is in the right ballpark but not extremely accurate.
Log buffer, meet log file
It is possible to set the log_buffer parameter in the startup file to dictate the space to be allocated to the public strands. It’s going to be convenient for me to do so to demonstrate why the archived redo logs can vary so much in size for “no apparent reason”. Therefore, I’m going to restart this instance with the setting log_buffer = 60M. This will (should) give me 3 public strands of 20MB. But 60MB is more than one granule, and if you add the 12MB fixed size that’s 72MB+. This result is more than two granules, so Oracle will have to allocate three granules (96MB) to hold everything. This is what I see as the startup SGA:
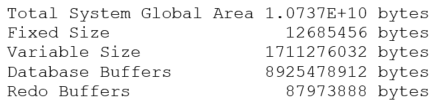
Checking the arithmetic 87973888 + 12685456 = 100659344 = 95.996 MB i.e. three granules.
The reason why I wanted a nice round 20MB for the three strands is that I created my online redo log files at 75MB (which is equivalent to 3 strands worth plus 15MB), and then I decided to drop them to 65MB (three strands plus 5MB).
My first test consisted of nothing but switching log files then getting one process to execute a pl/sql loop that did several thousand single-row updates and commits. After running the test, this is what the last few entries of my log archive history looked like:
|
1 2 |
select sequence#, blocks, blocks * block_size / 1048576 from v$archived_log; |
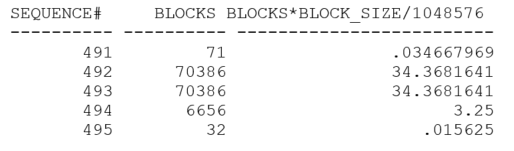
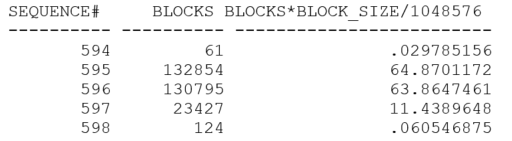
My test generated roughly 72MB of redo, but Oracle switched log files (twice) after a little less than 35MB. That’s quite interesting, because 34.36 MB is roughly 20MB (one public strand) + 15MB and that “coincidence” prompted me to reduce my online logs to 65MB and re-run the test. This is what the next set of archived logs looked like:
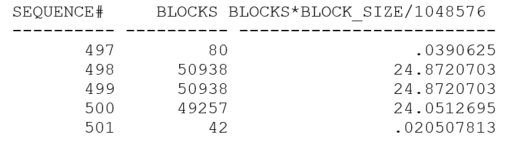
This time I have archived logs which are about 25MB – which is equivalent to one strand plus 5MB – and that’s a very big hint. Oracle is behaving as if each public strand allocates space for itself in the online redo log file in chunks equal to the size of the strand. Then, when the strand has filled that chunk, Oracle tries to allocate the next chunk – if the space is available. If there’s not enough space left for a whole strand, Oracle allocates the rest of the file. If there’s no space left at all, Oracle triggers a log file switch, and the strand allocates its space in the next online redo log file. The sequence of events in my case was that each strand allocated 20MB, but only one of my strands was busy. When it had filled its first allocation, it allocated the last 5 (or 15) MB in the file. When that was full, I saw a log file switch.
To test this hypothesis, I could predict that if I ran two copies of my update loop (addressing 2 different tables to avoid contention), I would see the archived logs coming out at something closer to 45MB (i.e. two full allocations plus 5MB). Here’s what I got when I tried the experiment:
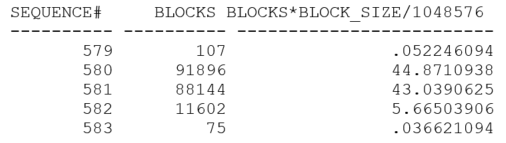
If you’re keeping an eye on the sequence# column, you may wonder why there’s been a rather large jump from the previous test. It’s because my hypothesis was right, but my initial test wasn’t quite good enough to demonstrate it. With all my single-row updates and commits and the machine I was using, Oracle needed to take advantage of the 2nd public redo strand some of the time but not for a “fair share” of the updates. Therefore, the log file switch was biased towards the first public redo strand reaching its limits, and this produced archived redo logs of a fairly regular 35MB (which would be 25MB for public strand #1 and 10MB for public strand #2). It took me a few tests to realize what had happened. The results above come from a modified test where I changed the loop to run a small number of times updating 1,000 rows each time. I checked that I still saw switches at 25MB with a single run – though, as you may have noticed, the array update generated a lot less redo than the single-row updates to update the same number of rows.
Finally, since I had three redo strands, what’s going to happen if I run three copies of the loop (addressing three different tables)?
With sufficient pressure on the redo log buffers (and probably with just a little bit of luck in the timing), I managed to get redo log files that were just about full when the switch took place.
Consequences
Reminder – my description here is based on tests and inference; it’s not guaranteed to be totally correct.
When you have multiple public redo strands, each strand allocates space in the current online redo log file equivalent to the size of the strand, and the memory for the strand is pre-formatted to include the redo log block header and block number. When Oracle has worked its way through the whole strand, it tries to allocate space in the log file for the next cycle through the strand. If there isn’t enough space for the whole strand, it allocates all the available space. If there’s no space available at all, it initiates a log file switch and allocates the space from the next online redo log file.
As a consequence, if you have N public redo strands and aren’t keeping the system busy enough to be using all of them constantly, then you could find that you have N-1 strand allocations that are virtually empty when the log file switch takes place. If you are not aware of this, you may see log file switches taking place much more frequently than you expect, producing archived log files that are much smaller than you expect. (On the damage limitation front, Oracle doesn’t copy the empty parts of an online redo log file when it archives it.)
In my case, because I had created redo log files of 65MB then set the log_buffer parameter to 60MB when the cpu_count demanded three public redo strands, I was doomed to see log file switches every 25MB. I wasn’t working the system hard enough to keep all three strands busy. If I had left the log buffer to default (which was a little under 7MB), then in the worst-case scenario I would have left roughly 14MB of online redo log unused and would have been producing archived redo logs of 51MB each.
Think about what this might mean on a very large system. Say you have 16 Cores which are pretending to be 8 CPUs each (fooling Oracle into thinking you have 128 CPUs), and you’ve set the SGA target to be 100GB. Because the system is a little busy, you’ve set the redo log file size to be a generous-sounding 256MB. Oracle will allocate 8 public redo strands (cpu_count/16), and – checking the table above – a granule size of 256MB. Can you spot the threat when the granule size matches the file size, and you’ve got a relatively large number of public redo strands?
Assuming the fixed SGA size is still about 12M (I don’t have a machine I can test on), you’ve got
|
1 |
strand size = 244MB / 8 = 30.5 MB |
When you switch into a new online redo log file, you pre-allocate 8 chunks of 30.5MB for a total of 244M, with only 12MB left for the first strand to allocate once it’s filled its initial allocation. The worst-case scenario Is that you could get a log file switch after only 30.5 MB + 12 MB = 42.5 MB. You could be switching log files about 6 times as often as expected when you set up the 256MB log file size.
Conclusion
There may be various restrictions or limits that make some difference to the arithmetic I’ve discussed. For example, I have seen a system using 512MB granules that seemed to set the public strand size to 32 MB when I was expecting the default to get closer to 64MB. There are a number of details I’ve avoided commenting on in this article, but the indications from the tests that I can do suggest that if you’re seeing archived redo log files that are small compared to the online redo log files, then the space you’re losing is because of space reserved for inactive or “low-use” strands. If this is the case, there’s not much (legal) that you can do other than increase the online redo log files so that the “lost” space (which won’t change) becomes a smaller fraction of the total size of the online redo log. As a guideline, setting the online redo log file size to at least twice the granule size seems like a good idea, and four times the size may be even better.
There are other options, of course, that involve tweaking the parameter file. Most of these changes would be for hidden parameters, but you could supply a suitable setting for the log_buffer parameter that makes the individual public strands much smaller – provided this didn’t introduce excessive waits for log buffer space. Remember that the value you set would be shared between the public redo threads, and don’t forget that the number of public redo threads might change if you change the number of CPUs in the system.
Load comments