
Now that SQL Server 2012 is released, we can expect to start seeing new and unfamiliar wait types appear in the output of sys.dm_os_wait_stats, sys.dm_os_waiting_tasks and extended event sessions. For those unfamiliar with wait types and wait statistics, the key concept to understand is that the SQL Server engine was designed to track areas where a task may need to wait for “something”. That “something” may be a resource, synchronization activity or queue. For example, a task may have to wait to acquire an Update lock on a data page because another task has already acquired it and is still holding the resource. When this occurs, that waiting task is moved off the scheduler and set to a waiting state along with an associated wait type, which in this example would be “LCK_M_U”. Once the resource becomes available, the task is signaled that the resource is available and the task then gets back in line on the scheduler. Once it has its scheduler time, it acquires the resource and continues with its work. A single task may encounter multiple waits during its lifetime, cycling repeatedly through a running, waiting and runnable state until complete.
Note: For an in depth overview of wait statistics, see Tom Davidson’s white paper, “SQL Server 2005 Waits and Queues“. While this paper was written for SQL Server 2005, it is still very relevant to SQL Server 2012.
As of SQL Server 2012 CU1, SQL Server tracks 649 different wait types. Not all wait types are relevant – with many wait types representing the accumulation of normal background tasks. While some wait types can be ignored, other wait types should indeed be paid attention to in your overall performance troubleshooting efforts. It’s best to treat wait statistics as a pointer for further research. Think of wait statistics as the initial symptoms that help you efficiently direct your next steps instead of blindly searching for possible culprits.
Of the new wait types, there are at least 50 related to AlwaysOn Availability Groups. AlwaysOn Availability Groups are one of the more prominent new feature areas added to SQL Server 2012, adding new capabilities for both high availability and disaster recovery. If there was a performance issue related to availability groups, what wait types would we expect to see? For example, if transactions on the primary replica were slow to commit due to disk latency issues on the secondary synchronous replica, what wait type would accumulate? This article will explore the answers to this question.
With so many variations and potential deployment configurations, consider this to be a first look, rather than a complete detailing of every possible pattern. For this article, I’m starting off with the following configuration:
- There will be one availability group with three availability databases
- There are two availability replicas (primary, secondary)
- I’m starting off with synchronous commit on both replicas and a manual failover mode between the two
- All connections are allowed in the primary role
- Both replicas are configured to be readable secondaries
In order to show the application’s perspective, I’ll be measuring wait statistics for a specific load-driving session. In this case, I’m tracking wait statistics for session id 56:
|
1 2 3 4 5 6 7 8 9 |
CREATE EVENT SESSION App_AG_Waits ON SERVER ADD EVENT sqlos.wait_info( ACTION (sqlserver.session_id) WHERE ([package0].[equal_uint64]([sqlserver].[session_id],(56)))) ADD TARGET package0.asynchronous_file_target (SET FILENAME = N'C:\temp\App_AG_Stats.xel', METADATAFILE = N'C:\temp\App_AG_Stats.xem'); GO |
Prior to measuring the wait type distribution for each test, I started off the extended events session as follows:
|
1 2 |
ALTER EVENT SESSION App_AG_Waits ON SERVER STATE = START; GO |
After running my test, I stop the extended event session and then parse it out into a summarized wait stats accumulation result set for the specific session id:
|
1 2 3 4 5 6 7 8 9 10 11 12 13 14 15 16 17 18 19 20 21 22 23 24 25 26 27 28 29 30 31 32 |
ALTER EVENT SESSION App_AG_Waits ON SERVER STATE = STOP; GO SELECT CAST(event_data as XML) event_data INTO #App_AG_Stage_1 FROM sys.fn_xe_file_target_read_file ('C:\temp\*.xel', NULL, NULL, NULL); SELECT event_data.value ('(/event/action[@name=''session_id'']/value)[1]', 'smallint') as session_id, event_data.value ('(/event/data[@name=''wait_type'']/text)[1]', 'varchar(100)') as wait_type, event_data.value ('(/event/data[@name=''duration'']/value)[1]', 'bigint') as duration, event_data.value ('(/event/data[@name=''signal_duration'']/value)[1]', 'bigint') as signal_duration INTO #App_AG_Stage_2 FROM #App_AG_Stage_1; -- Final result set SELECT session_id, wait_type, SUM(duration) total_duration, SUM(signal_duration) total_signal_duration FROM #App_AG_Stage_2 GROUP BY session_id, wait_type ORDER BY session_id, SUM(duration) DESC; GO |
I was also careful to delete the XEL files after each test, so that I don’t accidently accumulate the combined set of current and past tests.
Additionally, I measured the aggregated wait statistics on the primary and secondary, both before and after each test: Nothing fancy – just a delta to see what wait stats accumulated across all sessions on both sides. Before each test, I executed (in SQLCMD mode) the following:
|
1 2 3 4 5 6 7 8 9 10 11 12 13 |
-- Primary replica :CONNECT SQLFCIPRIMARY\DC1 SELECT wait_type, wait_time_ms, signal_wait_time_ms INTO tempdb.dbo.before_waits FROM sys.dm_os_wait_stats; GO -- Secondary replica :CONNECT SQLFCIDR\DC2 SELECT wait_type, wait_time_ms, signal_wait_time_ms INTO tempdb.dbo.before_waits FROM sys.dm_os_wait_stats; GO |
Then after each test I executed the following:
|
1 2 3 4 5 6 7 8 9 10 11 12 13 14 15 16 17 18 19 20 21 22 23 24 25 26 27 28 29 30 31 32 33 34 35 36 37 38 39 40 41 |
-- Primary replica :CONNECT SQLFCIPRIMARY\DC1 SELECT wait_type, wait_time_ms, signal_wait_time_ms INTO tempdb.dbo.after_waits FROM sys.dm_os_wait_stats; SELECT 'Primary replica:' ReportNM; SELECT b.wait_type, a.wait_time_ms - b.wait_time_ms wait_time_ms, a.signal_wait_time_ms - b.signal_wait_time_ms signal_time_ms FROM tempdb.dbo.before_waits b INNER JOIN tempdb.dbo.after_waits a ON b.wait_type = a.wait_type WHERE a.wait_time_ms > b.wait_time_ms ORDER BY a.wait_time_ms - b.wait_time_ms DESC; DROP TABLE tempdb.dbo.before_waits; DROP TABLE tempdb.dbo.after_waits; GO :CONNECT SQLFCIDR\DC2 -- Secondary replica SELECT wait_type, wait_time_ms, signal_wait_time_ms INTO tempdb.dbo.after_waits FROM sys.dm_os_wait_stats; SELECT 'Secondary replica:' ReportNM; SELECT b.wait_type, a.wait_time_ms - b.wait_time_ms wait_time_ms, a.signal_wait_time_ms - b.signal_wait_time_ms signal_time_ms FROM tempdb.dbo.before_waits b INNER JOIN tempdb.dbo.after_waits a ON b.wait_type = a.wait_type WHERE a.wait_time_ms > b.wait_time_ms ORDER BY a.wait_time_ms - b.wait_time_ms DESC; DROP TABLE tempdb.dbo.before_waits; DROP TABLE tempdb.dbo.after_waits; GO |
Keep in mind that I’m not going into much detail on the hardware specifications, network setup, I/O subsystem, etc. The goal of these initial tests is to smoke out new wait types and begin formulating patterns based on specific scenarios. I fully intend to expand out the list of patterns over time. Now, without further ado, here are a few test scenarios and the associated wait statistics.
Test: No User Activity, Synchronous Mode
In the first test, I’m just interested in seeing what background processes are waiting for something to do. I had synchronous mode configured for the availability group replicas.
What wait stats are associated with just regular availability group background processes? I ran a simple WAITFOR DELAY of 30 seconds.
My session accumulated waits, as expected, showed no waits related to availability groups:
|
Wait Type |
Duration |
Signal Duration |
|
WAITFOR |
30008 |
0 |
|
WRITELOG |
1 |
0 |
|
XE_BUFFERMGR_ALLPROCESSED_EVENT |
0 |
0 |
Regarding the primary replica itself, here was what accumulated during the 30 seconds (I filtered out some of the known background wait types as well – in order to keep the noise down on the results):
|
Wait Type |
Duration |
Signal Duration |
|
HADR_WORK_QUEUE |
137533 |
139 |
|
HADR_FILESTREAM_IOMGR_IOCOMPLETION |
30653 |
7 |
|
LOGMGR_QUEUE |
30644 |
1 |
|
HADR_TIMER_TASK |
30522 |
39 |
|
HADR_CLUSAPI_CALL |
30498 |
0 |
|
HADR_LOGCAPTURE_WAIT |
15060 |
2 |
|
HADR_SYNC_COMMIT |
5 |
0 |
So this gives us an idea of background, queue related wait types that increment independently of activity in the various availability databases within an availability group.
What about the secondary replica?
|
Wait Type |
Duration |
Signal Duration |
|
HADR_WORK_QUEUE |
122073 |
49 |
|
HADR_CLUSAPI_CALL |
30994 |
0 |
|
LOGMGR_QUEUE |
30820 |
2 |
|
HADR_FILESTREAM_IOMGR_IOCOMPLETION |
30775 |
4 |
|
HADR_TIMER_TASK |
30433 |
7 |
We see the same background accumulation, but without the HADR_LOGCAPTURE_WAIT and HADR_SYNC_COMMIT.
Test: Synchronous Mode and Singleton INSERT Operations
In the first test, I’m performing a repeating INSERT operation against the AppDB database that participates in the availability group and is in synchronous mode. The test was a simple, singleton INSERT performed 10,000 times on the primary replica:
|
1 2 3 4 5 6 7 8 9 10 11 12 13 14 15 16 17 18 19 20 |
USE AppDB; GO CREATE TABLE [dbo].[category]( [category_no] int IDENTITY(1,1) NOT NULL, [category_desc] nvarchar(200) NOT NULL, [category_code] nchar(10) NOT NULL, CONSTRAINT [category_ident] PRIMARY KEY CLUSTERED ( [category_no] ASC )) ON [PRIMARY]; GO INSERT [dbo].[category] (category_desc, category_code) VALUES (CAST(NEWID() as nvarchar(200)), LEFT(CAST(NEWID() as nvarchar(36)),10)); GO 10000 |
After stopping the session, the aggregated primary replica wait stats for the session were as follows:
|
Wait Type |
Duration |
Signal Duration |
|
HADR_SYNC_COMMIT |
17408 |
18 |
|
XE_BUFFERMGR_ALLPROCESSED_EVENT |
18 |
0 |
|
WRITELOG |
0 |
0 |
|
SOS_SCHEDULER_YIELD |
0 |
0 |
In this case, our obvious standout is HADR_SYNC_COMMIT. In this guess, I’d assume this is the accumulated wait time waiting for the synchronous replica acknowledgement before committing the transaction. Books Online defines it as “Waiting for transaction commit processing for the synchronized secondary databases to harden the log. This wait is also reflected by the Transaction Delay performance counter. This wait type is expected for synchronized availability groups and indicates the time to send, write, and acknowledge log to the secondary databases.”
What are the top waits (by duration) on the primary replica that were not background-based?
|
Wait Type |
Duration |
Signal Duration |
|
HADR_NOTIFICATION_DEQUEUE |
563205 |
0 |
|
HADR_SYNC_COMMIT |
19971 |
97 |
We see the HADR_SYNC_COMMIT as expected – but also a new wait type, the HADR_NOTIFICATION_DEQUEUE. I wondered if I would see this for asynchronous mode. Books Online defines HADR_NOTIFICATION_DEQUEUE as a “background task that processes Windows Server Failover Clustering notifications is waiting for the next notification. Internal use only.“
I saw the following on the secondary replica:
|
Wait Type |
Duration |
Signal Duration |
|
HADR_NOTIFICATION_DEQUEUE |
563139 |
0 |
HADR_NOTIFICATION_DEQUEUE has near-identical duration to the primary – and no wait time for HADR_SYNC_COMMIT, so it seems to be a wait type for synchronous mode based on a primary replica.
Test: Asynchronous Mode and Singleton INSERT Operations
This dovetails in to the next test, where, basically, I just repeated the first test, deleting all rows from the table first, but this time using asynchronous mode between the replicas.
The results on the primary replica were as follows:
|
Session ID |
Wait Type |
Duration |
Signal Duration |
|
56 |
WRITELOG |
5029 |
96 |
|
56 |
XE_BUFFERMGR_ALLPROCESSED_EVENT |
7 |
0 |
There were no wait stats generated that were related to the availability group, only those related to the transaction log and extended event session buffer flushes to targets.
As for the primary and secondary replicas, I saw non-background wait values for HADR_NOTIFICATION_DEQUEUE, both hovering around the same wait time value as with the previous test.
Test: Asynchronous Mode and Large Transaction Operations
This test arose from the question – “can I push enough volume in asynchronous mode to get an availability group non-background related wait stat to accumulate?” To attempt this, I ran the following test:
|
1 2 3 4 5 6 7 8 9 10 11 12 |
INSERT [dbo].[category] (category_desc, category_code) VALUES (CAST(NEWID() as nvarchar(200)), LEFT(CAST(NEWID() as nvarchar(36)),10)); GO 1000 INSERT [dbo].[category] (category_desc, category_code) SELECT category_desc, category_code FROM [dbo].[category]; GO 10 |
This test did an INSERT SELECT based on the rows in category, executing 10 times total and thereby doubling the result set on each execute.
The results on the primary replica were as follows (top 4):
|
Session ID |
Wait Type |
Duration |
Signal Duration |
|
56 |
PAGEIOLATCH_EX |
7913 |
11 |
|
56 |
SOS_SCHEDULER_YIELD |
3888 |
3875 |
|
56 |
WRITELOG |
596 |
114 |
|
56 |
WRITE_COMPLETION |
373 |
0 |
As for the primary and secondary replicas, I saw non-background wait values for HADR_NOTIFICATION_DEQUEUE, both around the same wait time value. There were only familiar faces here, so I moved on to some other tests, but I’ll be returning to this at another time.
Test: Synchronous Mode and Querying the Readable Secondary
I was interested to see what wait statistics might be generated around read-only queries on the secondary. To prepare this test, I loaded the table with 100,000 rows, failed-over the replica so that it switched to being secondary and then executed a simple SELECT:
|
1 2 3 4 5 6 7 8 9 10 11 |
-- Failover to the secondary :CONNECT SQLFCIDR\DC2 ALTER AVAILABILITY GROUP [AG1] FAILOVER; GO :CONNECT SQLFCIPRIMARY\DC1 USE AppDB; SELECT category_no, category_desc, category_code FROM [dbo].[category]; GO 10 |
The results were not particularly interesting. The session executing the SELECT had associated PAGELATCH_SH and PAGELATCH_EX accumulated wait time, but there was no wait statistics for the availability group; background related wait statistics.
|
Wait Type |
Total Duration |
Total Signal Duration |
|
PAGELATCH_SH |
33 |
33 |
|
PAGELATCH_EX |
16 |
16 |
What if we had concurrent writes on the primary? Would we see different SELECT wait statistics related to availability groups?
Test: Synchronous Mode and Querying the Readable Secondary with Concurrent Writes
I repeated the prior test, but this time with concurrent INSERT operations running on the primary replica (this ran concurrently to the SELECT statement used in the previous test):
|
1 2 3 4 5 6 7 8 9 10 11 12 |
INSERT [dbo].[category] (category_desc, category_code) VALUES (CAST(NEWID() as nvarchar(200)), LEFT(CAST(NEWID() as nvarchar(36)),10)); GO 1000 INSERT [dbo].[category] (category_desc, category_code) SELECT category_desc, category_code FROM [dbo].[category]; GO 10000 |
After running the SELECT workload, here is what was returned. As I expected, the query runtime increased compared to the previous test due to the significant concurrent data modification activity on the primary replica:
|
Wait Type |
Total Duration |
Total Signal Duration |
|
SOS_SCHEDULER_YIELD |
23966 |
23874 |
|
NETWORK_IO |
8389 |
1068 |
|
LCK_M_S |
210 |
6 |
|
PAGEIOLATCH_SH |
134 |
2 |
The wait types associated with the SELECT operation on the secondary replica were ones we’ve had in previous versions of SQL Server. No additional wait stats accumulated on the primary that weren’t related to the background tasks – however the secondary replica did show the following:
|
Wait Type |
Total Duration |
Total Signal Duration |
|
HADR_SYNC_COMMIT |
1870 |
1 |
Test: Asynchronous Mode and Singleton INSERT Operations with an Offline Secondary
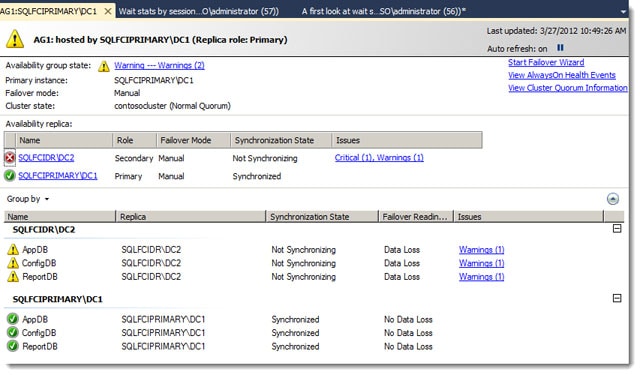
I next wanted to test my earlier singleton INSERT test in asynchronous mode with a disconnected replica. I took the secondary replica SQL Server service offline. The below figure just shows the Availability Dashboard – and shows a “not synchronizing” for the secondary:
The results of the test were as follows:
|
Wait Type |
Duration |
Signal Duration |
|
PAGEIOLATCH_EX |
554 |
1 |
|
WRITELOG |
202 |
2 |
|
SOS_SCHEDULER_YIELD |
192 |
190 |
|
LOGBUFFER |
36 |
0 |
|
IO_COMPLETION |
19 |
0 |
|
WRITE_COMPLETION |
17 |
0 |
There were no types associated with the availability groups – and that was instance-wide (no accumulation outside of the availability group background related tasks).
Test: Synchronous Mode and Singleton INSERT Operations with an Offline Secondary
The next test was for another singleton INSERT test in synchronous mode, this time with a disconnected replica. I took the secondary replica SQL Server service offline, just as I did with the previous test.
The results were as follows:
|
Wait Type |
Duration |
Signal Duration |
|
HADR_SYNC_COMMIT |
11057 |
4 |
|
SOS_SCHEDULER_YIELD |
1043 |
1037 |
|
HADR_SYNCHRONIZING_THROTTLE |
827 |
36 |
|
WRITELOG |
583 |
31 |
|
SLEEP_TASK |
12 |
1 |
One interesting type emerged, HADR_SYNCHRONIZING_THROTTLE. Books Online defines this as “Waiting for transaction commit processing to allow a synchronizing secondary database to catch up to the primary end of log in order to transition to the synchronized state. This is an expected wait when a secondary database is catching up.”
And looking at the non-background tasks for the primary replica itself, I saw the following:
|
Wait Type |
Duration |
Signal Duration |
|
HADR_NOTIFICATION_DEQUEUE |
49903 |
0 |
|
HADR_SYNC_COMMIT |
11075 |
5 |
|
HADR_SYNCHRONIZING_THROTTLE |
889 |
59 |
|
HADR_REPLICAINFO_SYNC |
465 |
0 |
|
HADR_AG_MUTEX |
82 |
1 |
|
HADR_LOGCAPTURE_SYNC |
73 |
72 |
New wait types included HADR_REPLICAINFO_SYNC, HADR_LOGCAPTURE_SYNC and HADR_AG_MUTEX. I had not seen them before in my testing. I wondered if HADR_AG_MUTEX was similar to DBMIRROR_DBM_MUTEX – indicating contention for the send buffer contention. Looking up the definition in Books Online, I see that this wait state was defined as occurring “when an AlwaysOn DDL statement or Windows Server Failover Clustering command is waiting for exclusive read/write access to the configuration of an availability group.”
HADR_REPLICAINFO_SYNC was defined as “waiting for concurrency control to update the current replica state” and HADR_LOGCAPTURE_SYNC was defined as “concurrency control around the log capture or apply object when creating or destroying scans. This is an expected wait when partners change state or connection status.”
What’s next?
There is much more to be explored in this area and other wait types not yet discussed. If you are encountering performance issues in your availability group topology, or if you suspect your availability group topology is causing issues with other workloads, I suggest you evaluate the accumulated wait statistics and use them to help prioritize your troubleshooting efforts.