

This is the fourth article in a series that examines the output of the Brent Ozar Unlimited sp_Blitz™ script run against the SQLServerCentral database servers.
Managing a SQL Server is an ongoing job. While the SQL Server platform will run itself for a long time, as your workload evolves, your applications are patched, and your staff experiences changes, it's easy for configuration and security issues to creep into your environment. The best way to prevent issues and problems is with regular monitoring and auditing of your instances.
The SQLServerCentral servers are regularly monitored, using SQL Monitor from Red Gate Software, and you can see the data at monitor.red-gate.com. We expose that as a demonstration of what the monitoring software can do. This covers alerts and problems that occur in real time, but it doesn't catch some changes which may occur over time.
This is where some type of auditing becomes very important. One of the ways in which you might think about auditing your instances is with a standard script that examines various potential places where your configuration isn't optimal.
sp_Blitz™

Brent Ozar Unlimited has released a fantastic script for examining the configuration, health, and performance of your SQL Server instances. This script is known as sp_Blitz™ and is currently at v16. You can download it and it builds a stored procedure that you can run on any of your instances.
A tremendous amount of information is returned. If you are interested, you can read about the script on the Brent Ozar Unlimited site.
We used this script to perform a quick audit of our database server instances and learned a few things. This series of articles examines the results and mitigation strategies we've taken. The other articles are:
- Security
- Reliability
- Performance - Part 1
- Performance - Part 2
- Query Plans
- Informational and other lower priority items
This article examines those items related to the performance of your database server. It only covers the performance items not covered in the previous article.
Performance
The third Findings Group output by the sp_Blitz script is the Performance section. These items can affect how your instance responds to client requests, warning you of items that may or may not cause your server to run slower. We received the following sections in our result set:
- High VLF Count
- Slow Storage Reads on Drive x
- Stored Procedure WITH RECOMPILE
- Active Tables Without Clustered Indexes
- Inactive Tables Without Clustered Indexes
- Queries Forcing Joins Hints
- Triggers on Tables
- Old Compatability Level
Each of these items is discussed below with regard to our database servers.
High VLF Count
This is one of those areas that can definitely affect performance if you are writing lots of log records. I used a quick script from Michell Ufford to look for the current VLF counts. Most of our databases were < 100, bt we had 4 databases that were larger:
| Database | VLF Count |
| Community Server | 427 |
| SQLServerCentral | 1024 |
| SQLServerCentralForums | 1150 |
| SingleSignOn | 1656 |
I suspect all of these high counts are related to the problems of the transaction log files being larger than the data files. As is common with many systems, someone was using small autogrow settings and not backing up the log files. As a result the files grew constantly, adding lots of VLFs along the way.
My mitigation procedure here, after getting the OK from our IT group, was to shrink the log files and then grow them back. This was mentioned in the second article of this series (Reliability) and it's what I decided to do. My plan was to run this code for each database:
dbcc shrinkfile(CommunityServer_Log, TRUNCATEONLY)
go
ALTER DATABASE MyDatabase
 MODIFY FILE (NAME =  CommunityServer_Log, SIZE = 1000MB)
I would change the file names and sizes as appropriate for the particular databases. This worked well for one database, but not the others. Apparently I had active VLFs in the files that prevented me from shrinking the files down to a small amount. I was hoping to get each to its minimum size before growing it.
As a result, I used a trick that I've been using since SQL Server 7. I did the following:
- created a dummy table
- added some rows to my dummy table
- ran a log backup
- re-ran the shrink file
For all for the databases except one, this worked and I was able to then modify it to a number that was larger than any of the log backups. My reasoning on the file size was to prevent any autogrows from occuring by ensuring there was adequte log space. I grew a few of them larger than I might need, just because we are dealing with rather small storage sizes and a few extra GB don't affect these systems.
For the one file that didn't respond here, I repeated steps 2-4 above a few times and managed to shrink the file down to a small size before expanding it. If you are interested in how to expand your transaction log file, here's a great post from Kimberly Tripp of SQLskills.
When I finished, all of my databases had VLF counts below 100 except 1. Community Server was at 126, which is still low enough that I didn't bother redoing my shrink/grow proces again.
You can read more about this alert at BrentOzar.com.
Slow Storage Reads on Drive x
This is not the type of message I want to see on a database server. These alerts come when you have reads that take more than 100ms and writes over 20ms. The targets should be in the 15-20ms range for reads and low single digits for writes.
I'm not completely sure what the problem is here, though I suspect it's the shared SAN storage we are on. We host our servers at Rackspace and our database cluster is a set of virtual machines (VMs) running with SAN storage for our database systems. We don't control the SAN and in essence have "rented" storage from a pool the vendor maintains.
Things are slow, but how slow and how big a problem. FIrst, let's look at the results we're getting:
- Slow Storage Reads on Drive S
- Slow Storage Reads on Drive U
- Slow Storage Writes on Drive S
- Slow Storage Writes on Drive U
These two drives are used for data files (s:) and tempdb (u:). You can see this at monitor.red-gate.com by going to the details for a database. I've shown the tempdb database below:
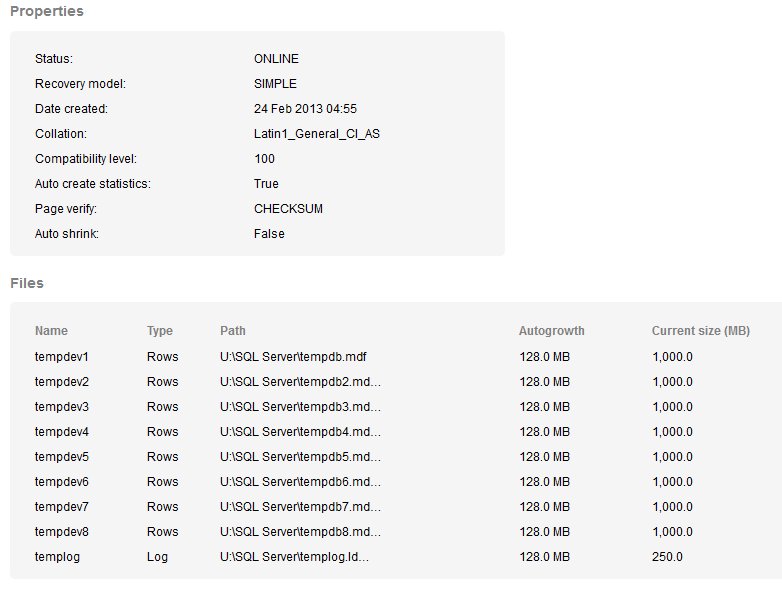
Both of these are a bit disconcerting to have slow reads and writes. These drives are mapped through to a SAN device at our hosting company. I've asked for more information from our hosting provider, but since this can be a difficult issue to track down and get resolved, I'm not hopeful. We will keep an eye on this.
You can read more about this alert at BrentOzar.com.
Stored Procedure WITH RECOMPILE
This one is a little funny as the only instance of this occuring is with the sp_Blitz procedure itself. Brent has noted this will be fixed in the next version.
You can read more about this alert at BrentOzar.com.
Active Tables Without Clustered Indexes
I believe most tables should have a clustered index. There are valid reasons to not have a clustered index, but as a default, you should choose some clustering key. Which one? That's the subject of endless debate, but here's an article that might help (and a video).
The scan returned a note that a number of our database had tables with heaps. When I scanned the CommunityServer database, I found most of the tables did not have clustered indexes (they were heaps). The same with the SQLServerCentralForums database. Both of these databases are third party product databases, and the guidance is not to change anything without the vendor's blessing.
However.
Neither of these databases is currently used and I suspect we would not get any support on them anyway. As a result, I am not overly worried about these particular items. As far as the tables in the other database, they are not queried enough to be a problem for us, though I have asked our developers to re-examine them for a good clustered index key.
You can read more about this alert at BrentOzar.com.
Inactive Tables Without Clustered Indexes
You can read more about this alert at BrentOzar.com.
Moving Forward
This is the fourth article looking at the very helpful and popular sp_Blitz™ script, and it examined part of the performance section of the output. The next article will examine the Query Plans section of the script as run against the SQLServerCentral database servers.
The other articles in this series are:
- Security
- Reliability
- Performance - Part 1
- Performance - Part 2
- Query Plans
- Informational and other lower priority items
This is a great script to run on your instances, but you need to run it periodically to catch changes, some of which might potentially be causing you problems, or will cause you problems in the future. Saving your output from previous runs and comparing the results and looking for changes is a good idea to save during future analysis.