

Introduction
When you build a report with Reporting Service to show visual information and data, a geographic map is often the most immediate and effective way to achieve your representation goals. You don’t need to add details to single points, regions, or states as users immediately recognize information that are in a familiar and easy to understand format.
Reporting Services allows you to create map-based reports. Furthermore, you can exploit the spatial features of SQL Server and work with spatial data types. Handling with geography (or geometry) fields, their methods and properties, can add power and flexibility to your project, allowing you to obtain a very impressive presentation.
In this article, I’ll show you how to set up a point on a map, based on its geographic coordinates (latitude and longitude). Afterwards, I’ll draw a circle (a buffer) around this point. The point's position and the circle's radius can vary, depending of user's choice made by report parameters.
Demo data
To construct the example, first of all we need some spatial data. We create a new database and a new table with few European towns coordinates and a geography data type field. For each record we insert city name, latitude, longitude.
CREATE DATABASE Spatial;
GO
USE [Spatial]
GO
/****** Object: Table [dbo].[Cities] ******/IF EXISTS (SELECT * FROM sys.tables WHERE name = N'Cities' AND type = N'U')
DROP TABLE dbo.Cities;
GO
CREATE TABLE [dbo].[Cities](
[id] [int] IDENTITY(1,1) NOT NULL,
[CityName] [varchar](50) NULL,
[Latitude] [decimal](12, 6) NULL,
[Longitude] [decimal](12, 6) NULL,
[Geomapping] [geography] NULL
) ON [PRIMARY]
GO
---------------------------------------------------------------------
INSERT INTO dbo.Cities (CityName,Latitude,Longitude)
VALUES
('Roma', 41.903049,12.495800),
('Madrid', 40.4165000,-3.7025600),
('Paris', 48.856930,2.341200),
('London',51.506420,0.127210),
('Berlin', 52.501408,13.402328);
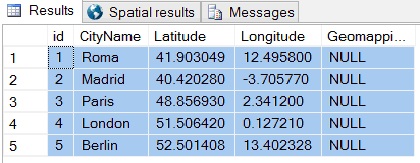
GONow our table is populated with some data, but the Geomapping field is empty.
SELECT *
 FROM dbo.Cities;
To calculate the Geomapping field, we must use a built-in method to convert longitude and latitude into the SQL Server’s geography data type:
UPDATE Cities
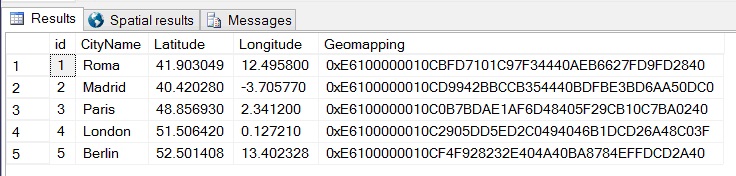
SET Geomapping = geography::STPointFromText('POINT(' + CAST(Longitude AS VARCHAR(20)) + ' ' + CAST(Latitude AS VARCHAR(20)) + ')',4326);The Geomapping field is now filled and contains some spatial data:
SELECT * FROM dbo.Cities;
Setting Up the Map
Now we have some data and can build our solution.
Open Visual Studio and create a new project. File > New > Project. From the project list select Business Intelligence > Reporting Services. Give a name and a destination to your project and click Ok (I called mine “Reporting Buffer”). If the Report Wizard starts, close it. We’ll do it from scratch.
Create a new data source pointing to your Spatial database. In the Solution Explorer windows right click on the Shared Data Source folder.
Click Add New Data Source and in the following window insert a name for the data source:
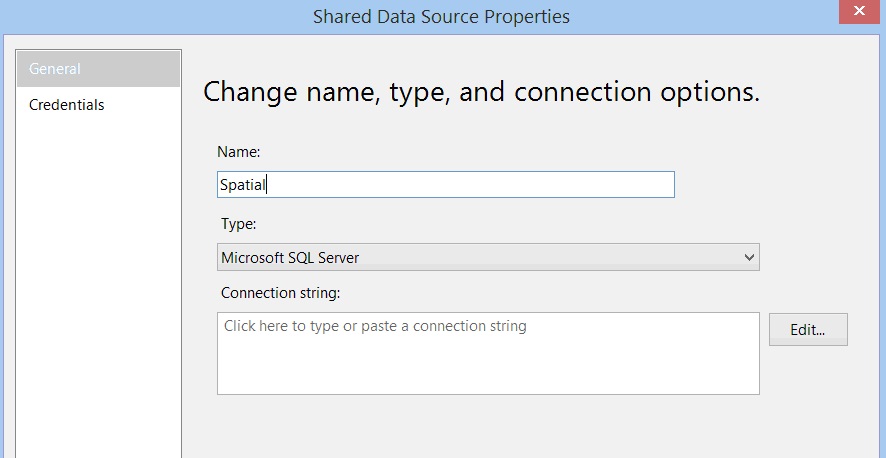
I called it “Spatial”. To create a connection string to SQL Server, click Edit …
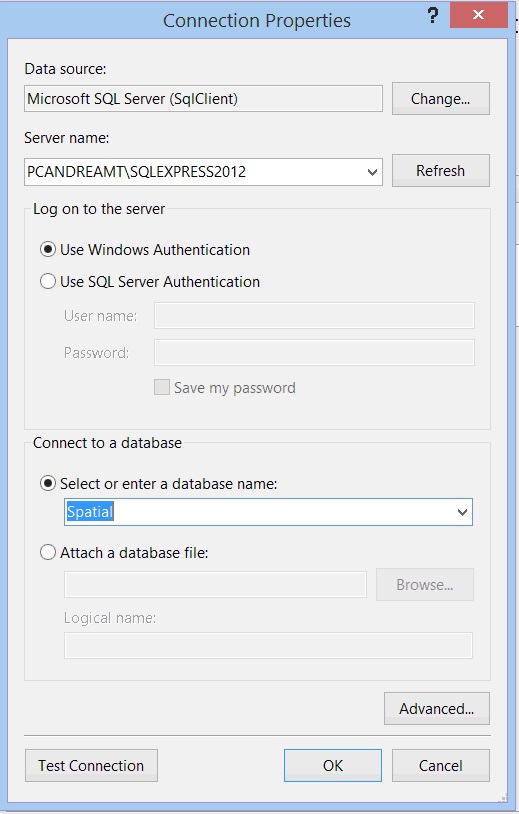
In the connection properties window, insert you SQL Server instance name, the authentication type and the database name you want to connect. To try whether everything works, click “Test Connection”.
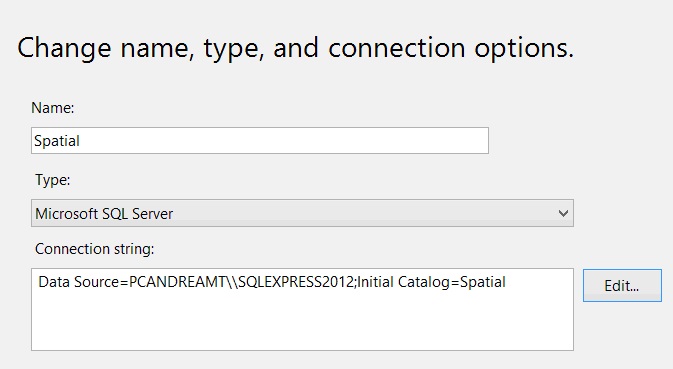
Click Ok and return to the Shared Data Source Properties. Now you have a connection string configured.
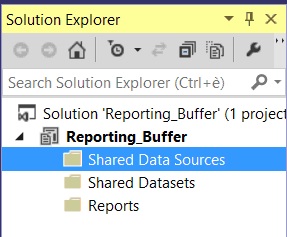
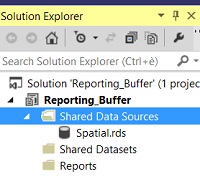
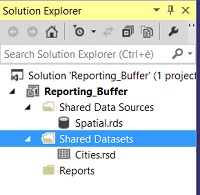
Click OK again and the data source is set up as you can see in the Solution Explorer window.
Now we need a Dataset to retrieve Cities list. In the Solution Explorer right click on Shared Datasets then Add New Dataset.
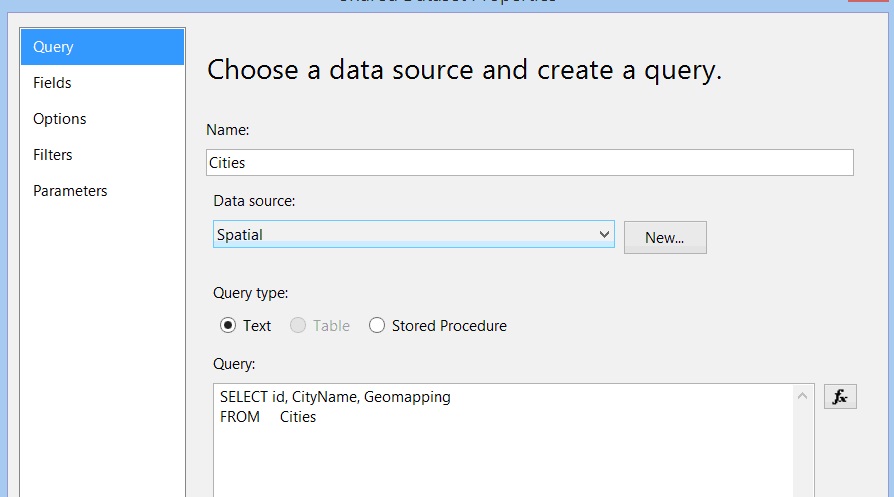
Insert a name for the dataset (for me “Cities”), choose an existing Data Source (“Spatial”), and write a query for selecting the data you want to retrieve. In this case:
SELECT id, CityName, Geomapping
 FROM dbo.Cities
Click OK and the dataset is ready, too.
It’s time to add a report to our project. In Solution Explorer right click on Report > Add new item. In the “Add New Item” window select Report (not Report Wizard), give a name to your report (for me “DemoBuffer”) and click OK.
A new empty report has been added to our project. First of all, we must use the data sources we defined before. Open the Report Data window, Right click on Data Sources > Add New Data Source.
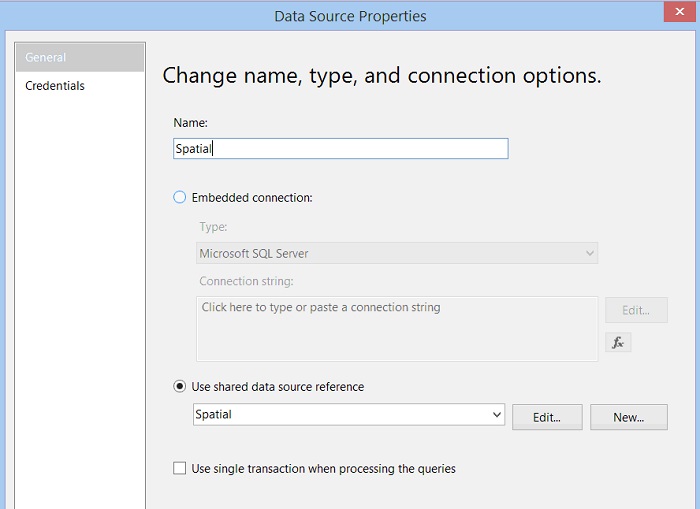
Choose Use shared data source reference, give it a name and click OK.
Right click on Datasets > Add Dataset … choose Use a shared dataset and select the already existed dataset “Cities”, give it a name and press OK.
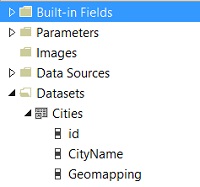
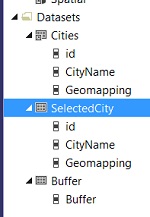
In the Report Data window you can see the datasource reference and the dataset Cities with three fields.
The report is still empty, but before creating the map, we first need to define one parameter: the starting city to set up a point on the map. This parameter gets its values from the cities table we created in our database. To create the parameter in the Report Data window, right click Parameters > Add Parameter ….
This opens the Report Parameters Properties window, tab General. The name is the name of the parameter; write “StartingPoint”. The prompt is the message showed to the user; write “Select a city”. The data type is the format of the parameter; choose Text. For the visibility, leave it Visible.
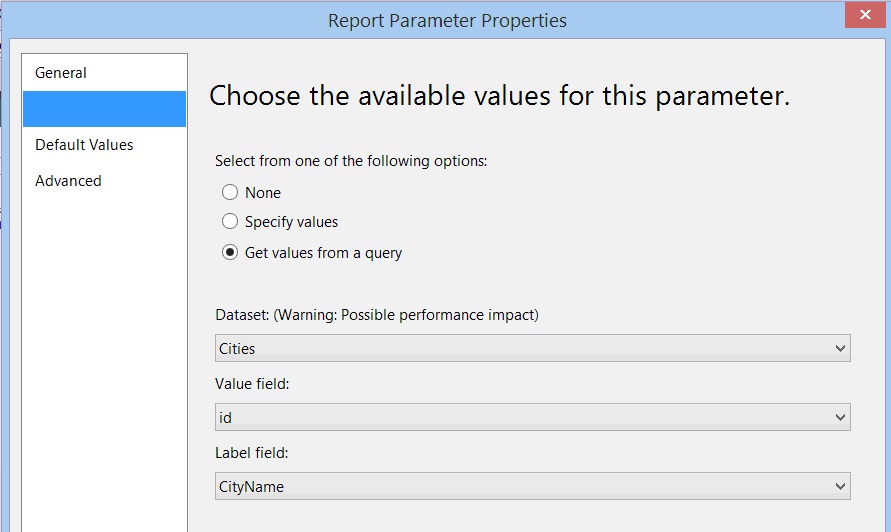
In the same window, choose the Available Values tab. Here you define the source for the town list displayed by the parameter. Select the Get values from a query option and then the Cities dataset from the pulldown list. The Value field is the field the parameter pass to a report for the query, the Label field is the city name displayed to the user. Choose id as the value field, CityName as label field and click OK on the bottom of the window.
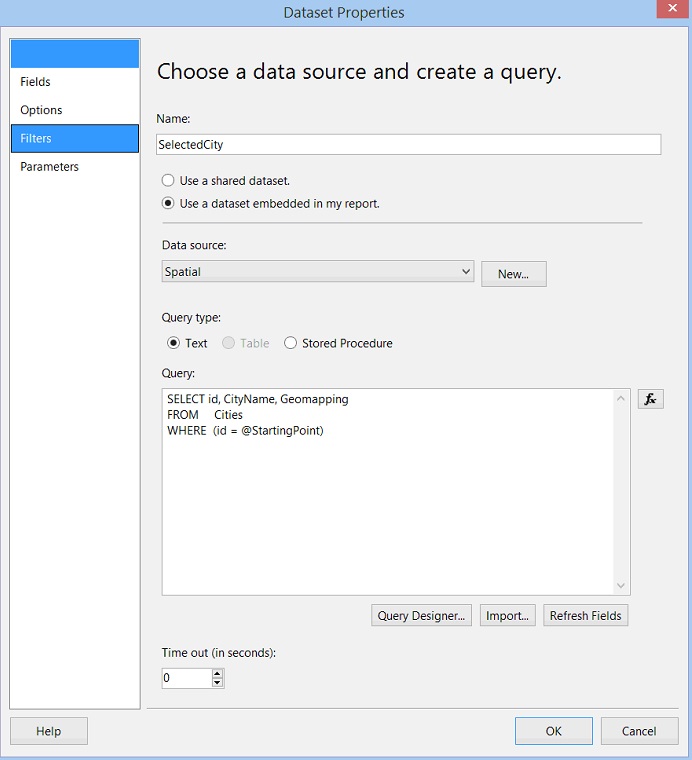
Once we’ve defined the parameter, we must create a new dataset that retrieves data from the Cities table, based on the value selected in the parameter. Right click on Datasets > Add Dataset …
Give “SelectedCity” as name to your dataset, this time select the Use a dataset embedded in my report option, select the datasource Spatial and add the following query text:
SELECT id CityName, Geomapping
 FROM dbo.Cities
 WHERE id = @StartingPoint
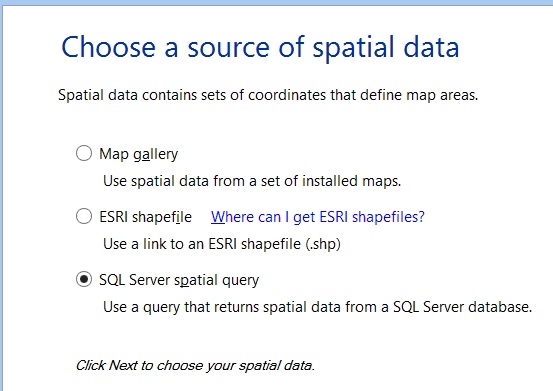
Now it’s finally the moment to create a map on our report to display data. In the Toolbox window, choose Map and then click in an empty space of the report page. This opens a wizard for the creation of the map. In the first screen “Choose a source of spatial data”, choose SQL Server spatial query and then click Next.
In the following screen, “Choose a dataset with SQL Server spatial data” select the dataset SelectedCity. It’s binding that the dataset contains a spatial field of type geometry or geography. In our example, the geography field is the one called Geomapping.
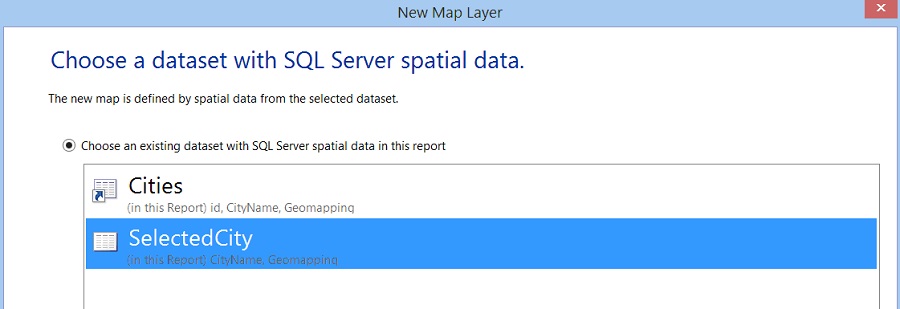
Click Next.
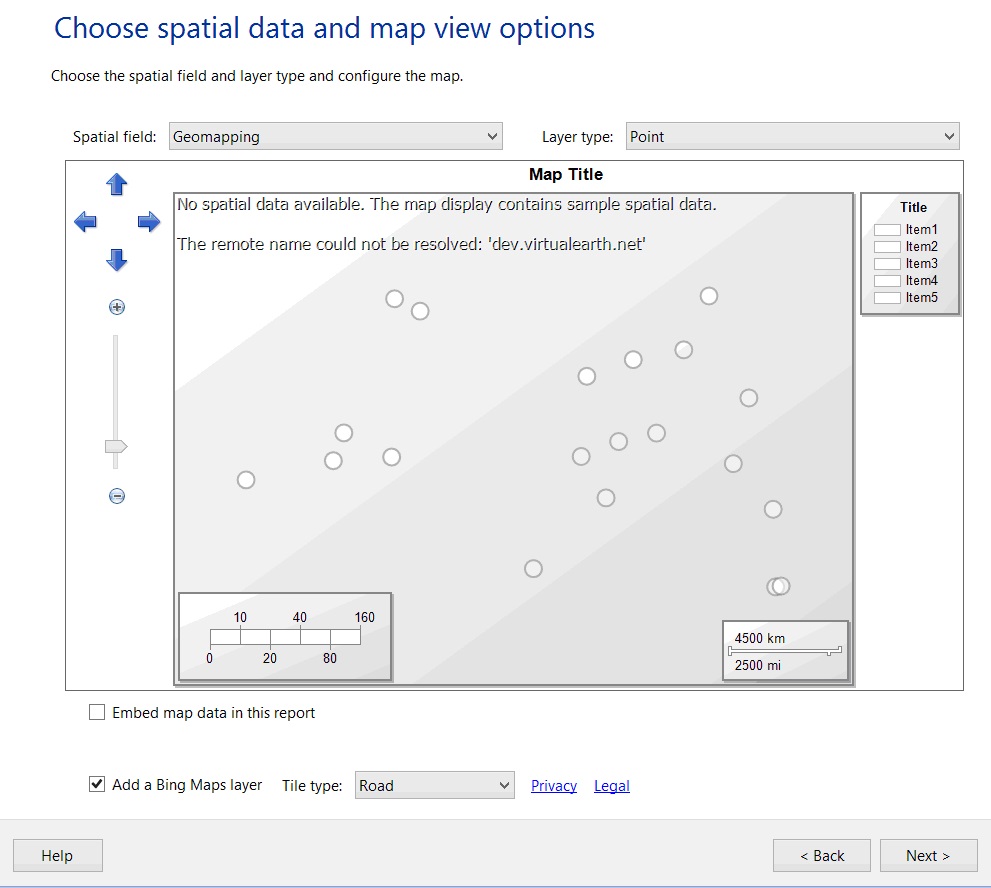
In the window “Choose spatial data and map view option”, select Geomapping as the spatial field and Point as layer type. Check the option “Add a Bing Maps Layer” of type “Road” to add a native Bing map layer to your report.
Click Next.
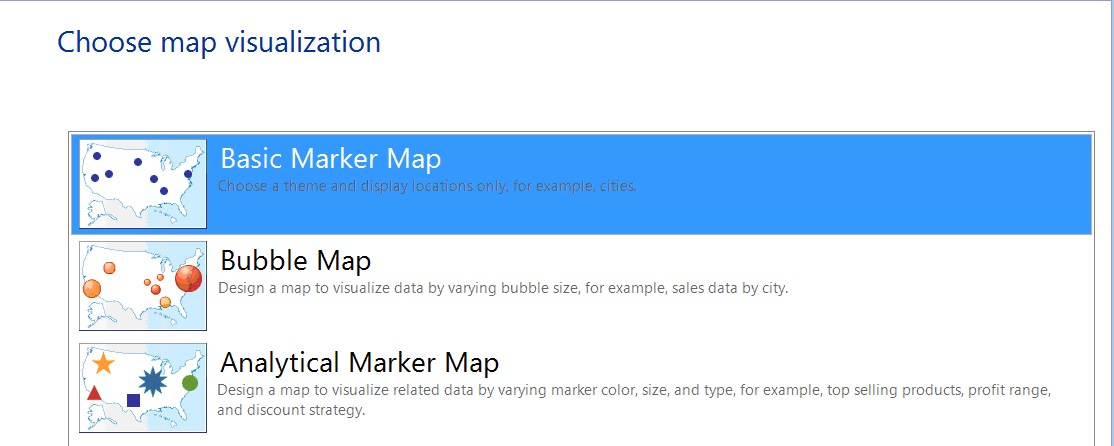
In the window “Choose map visualization”, select Basic Marker Map and then click Next.
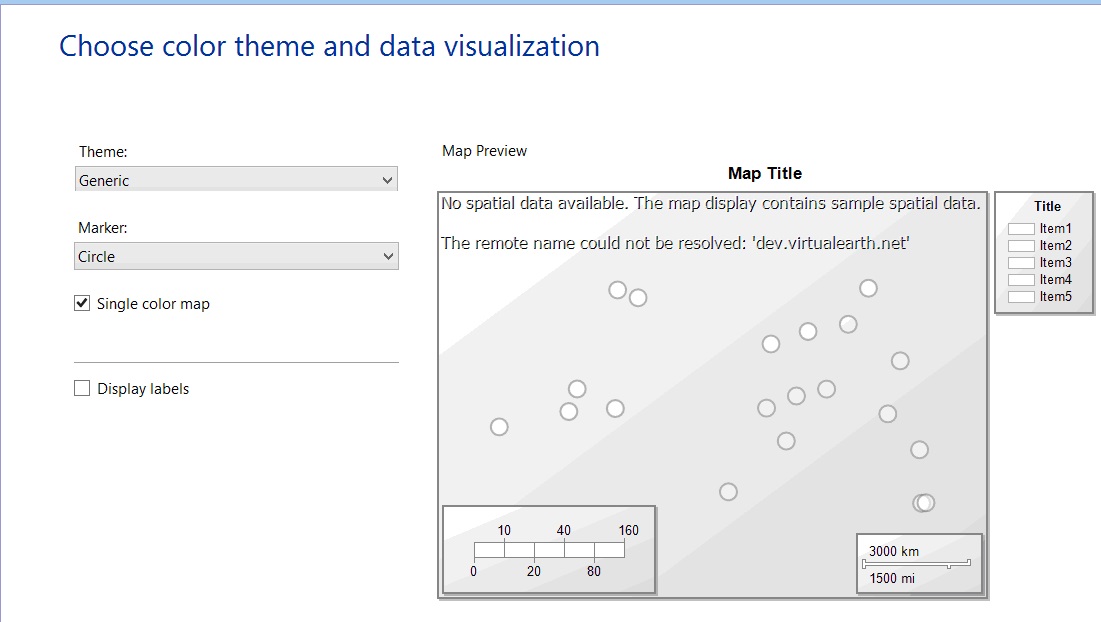
In the window “Choose color theme and data visualization”, choose a theme (I leave default) and a marker type.
Click Finish and your map is ready in design mode.
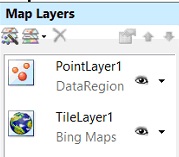
Now, click inside the map, and you can see on the right a window, that contains two layers: the Bing Map layer and a point layer based on the dataset selected in the wizard.
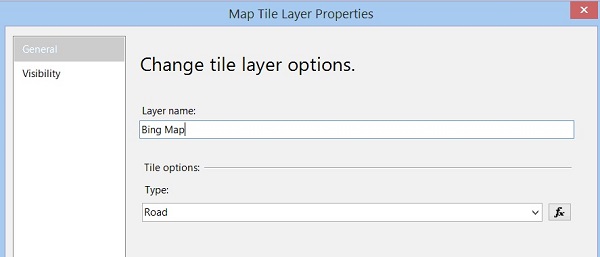
I don’t like the default layers names assigned by Reporting Services and want to change them. Right click on TileLayer1 > Tile Properties …. Rename the tile layer (I wrote BingMaps) and click OK.
Right click on PointLayer1 > Layer Data …
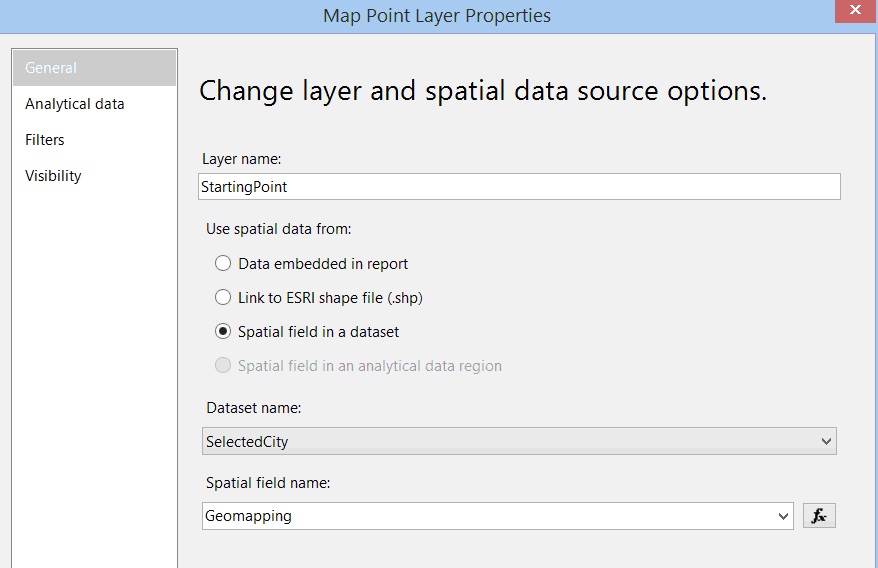
Change the layer name in StartingPoint. Be sure that the layer takes the data from the dataset “SelectedCity” created before and from the spatial field “Geomapping”.
Click Ok.
Again, right click on the point layer and choose Point Properties. In this window you can set some properties of the points showed on the map.
In the General tab, change the Marker size and take it to 15 pt. Then select the Fill tab and change the fill color. Default is white, set, for instance, blue. Click Ok and return to the map design.
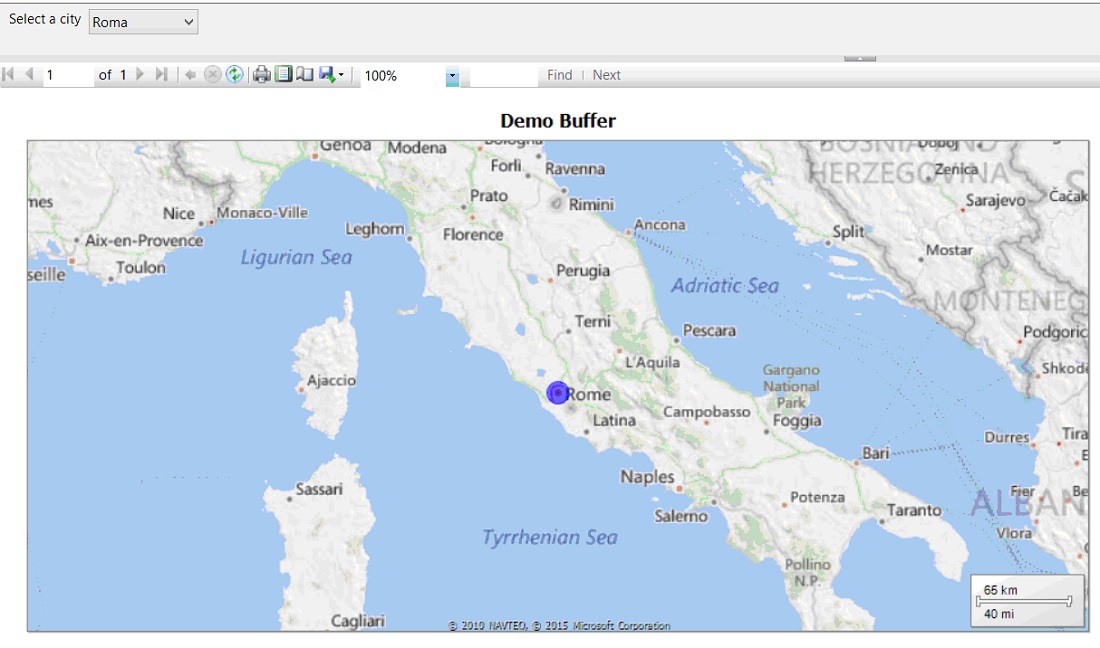
Now we can try to visualize our data. Go on the report preview tab. From the drop down list select a city, click View Report and you can see a map with a blue point corresponding to the city you’ve chosen. Changing the city, changes the map’s focus.
The next step is to draw a buffer on the map around the starting point. It is convenient to use a method of the geography data type called STBuffer. This method returns a geography object that represents the union of all points whose distance from a geography instance is less than or equal to a specified value. The syntax is quite simple:
GeographyField.STBuffer(distance).
Distance is a float value and the calculation returns the region around the point, within that distance. To test how the method works, in SQL Server Management Studio write and execute the following script:
USE Spatial;
GO
DECLARE @Buffer int = 7;
SELECT Geomapping.STBuffer(@Buffer * 1000) AS Buffer
 FROM dbo.Cities
 WHERE CityName = 'Paris'
If you click in the spatial tab, you can watch the buffer drawn around the point that represents Paris.
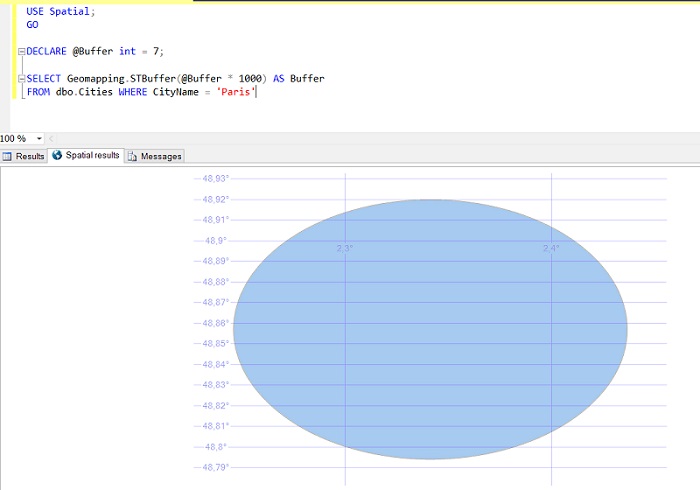
Note that the STBuffer method takes meters in input. To convert the distance in km, we have to multiply to 1000.
In our report, the buffer’s radius depends on the value of a user-defined parameter. To add the parameter for the buffer, switch to the report design window, again click on Parameters > Add Parameter and insert the following definitions:
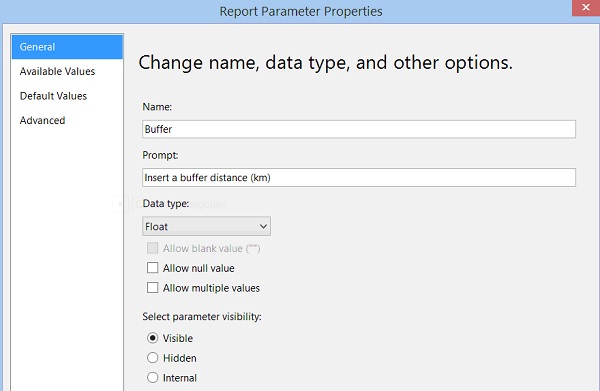
Name = Buffer.
Prompt = Insert a buffer distance (km).
Type = Float.
Once finished, click OK.
Set a new dataset to calculate the buffer, based on the size of the parameter, starting from the city selected by the user. Right click on Datasets > Add Datasets. Call the dataset “Buffer”, choose Select a dataset embedded in my report, Data Source = Spatial and write the following query:
SELECT Geomapping.STBuffer(@Buffer * 1000) AS Buffer
FROM dbo.Cities WHERE id = @StartingPoint
The new dataset appears on the left.
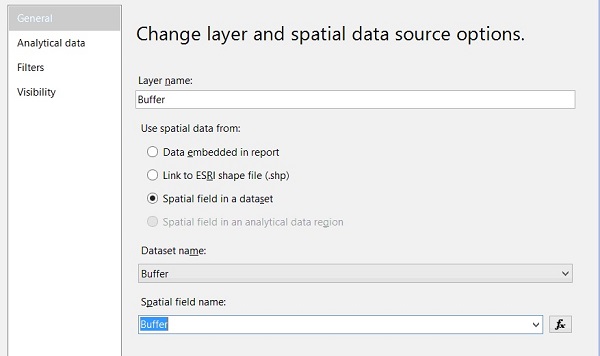
The last setting is the creation of a new layer to show the buffer. Click twice inside the map, until the Map Layers box appears on the right. Then click on the Add layer button and choose Polygon layer. Right click > Layer Data … on the new layer to define its properties.
Set the layer name as Buffer, choose Use spatial data from – Spatial field in a dataset, Buffer as dataset name, Buffer as spatial field name and press OK.
Right click again on the buffer layer and this time choose Polygon Properties, to set the visibility properties of the object. Go to the tab Fill and set No Color as Fill color. Then go to the tab Border, change the border color to blue and take the line width to 1,5 pt. Click Ok to confirm your changes.
The report definition is finally complete. To view the result, switch to Preview, select a city (for instance Rome), insert a buffer radius (i.e. 5) click View Report and you can see the buffer around the point you’ve selected.
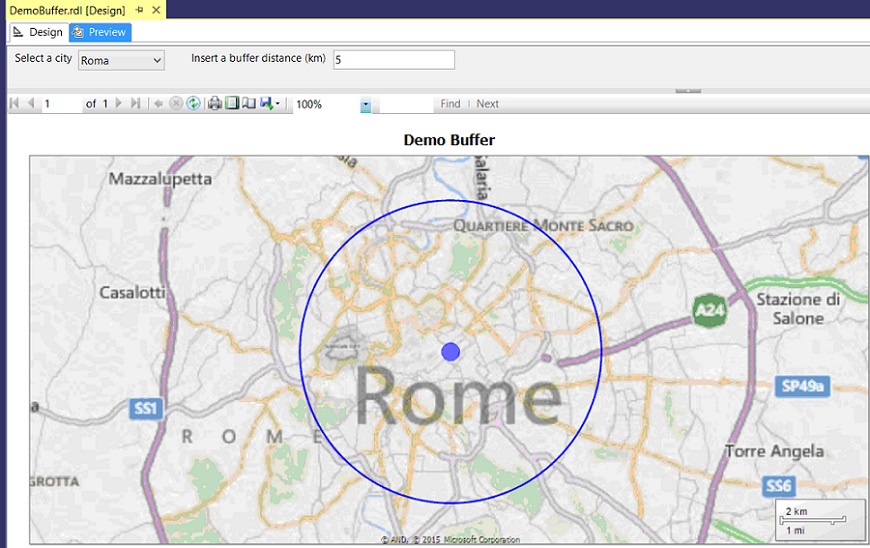
Changing the city and the buffer size, changes the map’s pointing and the visualization scale. Let’s try it yourself to watch the result.
Conclusions
In this article I showed you an example of working with spatial data on Reporting Services.
Starting from a base map, you can add several overlaying layers to increase the effectiveness of your solution. Beyond the buffer layer, for instance you could wish to add nation or region boundaries to the map, or to make same distance calculations, objects intersection, or to represent some distributions compared to the starting point.
Once you’ve learned how spatial data works, it worth to exploit their properties and methods to obtain rich and powerful data representations.

