Introduction
We often need to present the report data in graphical format, specially when we develop reports for business users. Most common chart formats are bar / column chart or pie chart. SSRS is a widely used reporting service and/or tool to develop and render reports into various business applications. In this article we will develop a simple report using the report wizard (I will publish another article to display creating rich reports without using wizard) to see how to represent the report data in graphical format using chart. Our report will display all employees along with their department name in tabular format and chart will display department wise allocation of total number of employees.
Data Preparation
Before we proceed to develop a report file (.rdl) we will first create the data to display on report. For simplicity and easy understanding we will take commonly used example of Employee and Department tables. Let's first create the tables tblEmpReportData and tblDeptReportData for storing employee details and department details respectively. (I am creating these tables in tempdb database)
CREATE TABLE tblEmpReportData
(
 EmpID NUMERIC(3),
 EmpName VARCHAR(100),
 Salary NUMERIC(6),
 DeptID NUMERIC(2)
)
CREATE TABLE tblDeptReportData
(
 DeptID NUMERIC(2),
 DeptName VARCHAR(50)
)
Lets insert the data into tblDeptReportData and tblEmpReportData tables respectively.
INSERT INTO tblDeptReportData VALUES(1,'Top Management')
INSERT INTO tblDeptReportData VALUES(2,'HR')
INSERT INTO tblDeptReportData VALUES(3,'Accounts')
INSERT INTO tblDeptReportData VALUES(4,'Development')
INSERT INTO tblEmpReportData VALUES(1,'SUNIL',330000,2)
INSERT INTO tblEmpReportData VALUES(2,'MAHESH',150000,4)
INSERT INTO tblEmpReportData VALUES(3,'ANAND',150000,4)
INSERT INTO tblEmpReportData VALUES(4,'RAHUL',310000,2)
INSERT INTO tblEmpReportData VALUES(5,'YOGESH',210000,4)
INSERT INTO tblEmpReportData VALUES(6,'SANJIV',300000,4)
INSERT INTO tblEmpReportData VALUES(7,'GANESAN',500000,1)
INSERT INTO tblEmpReportData VALUES(8,'DEV',300000,3)
INSERT INTO tblEmpReportData VALUES(9,'VINAY',300000,4)
INSERT INTO tblEmpReportData VALUES(10,'AVINASH',600000,1)
INSERT INTO tblEmpReportData VALUES(11,'BRIJESH',400000,1)
INSERT INTO tblEmpReportData VALUES(12,'DHANAJI',250000,3)
INSERT INTO tblEmpReportData VALUES(13,'SWAPNIL',200000,3)
Lest run following query and test the output. The output of the query will be displayed on report in tabular format.
SELECT erd.EmpName,erd.Salary,drd.DeptName
FROM tblEmpReportData erd INNER JOIN tblDeptReportData drd
ON erd.DeptID = drd.DeptID
We are done with basic data preparation. We can move ahead to create a report definition file which will display the desired report.
Setup Report Project
To create a report file we will create a report server project. Go to Start -> Programs -> SQL Server 2005 and click 'SQL Server Business Intelligence Development Studio'. (I have mentioned the path on Windows XP in classic style view. On your machine the link may be situated at some other place).
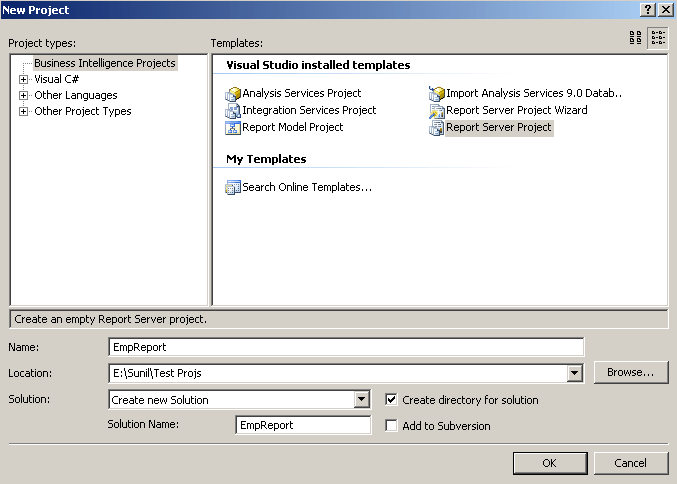
Once MS Visual Studio is opened, click new Project and select Report Server Project as shown in below image.
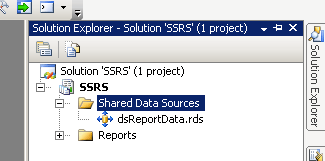
Once the project is created first step is to create a data source for our report. In solution explorer right click on shared data source and click 'Add new Data Source'. Provide your database connection string, give a name to datasource(dsReportData in this example) and click OK. The data source should appear as below:
Our next step is to add a report file to our project. Right click on 'Reports' and click 'Add new Report'. A dialog will appear to select data source for the report. Select our shared data source 'dsReportData' in the dropdown. (We can have multiple datasource in a single project and for a single report)
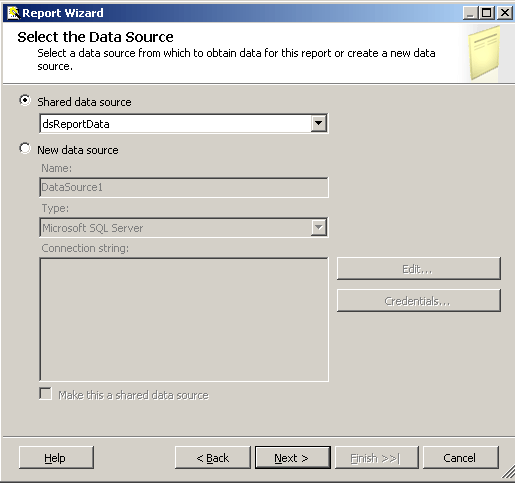
Now click 'Next'
Building Actual Report
Next thing is to provide query for our report to fetch the data. We can provide inline query string i.e. direct select query or we can provide a Stored Procedure name which while return us the data. In this example we will use direct query to get employee details.
We have our query which we used to test output after creating the tables.
SELECT erd.EmpName,erd.Salary,drd.DeptName
FROM tblEmpReportData erd INNER JOIN tblDeptReportData drd
ON erd.DeptID = drd.DeptID
Copy this query and paste in query string box as displayed below:
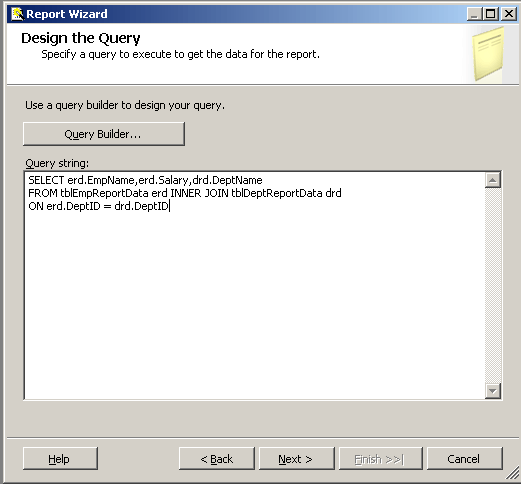
Click 'Next' two times. Select all values in 'Available fields' at left side and add them to 'Details' section at right side.
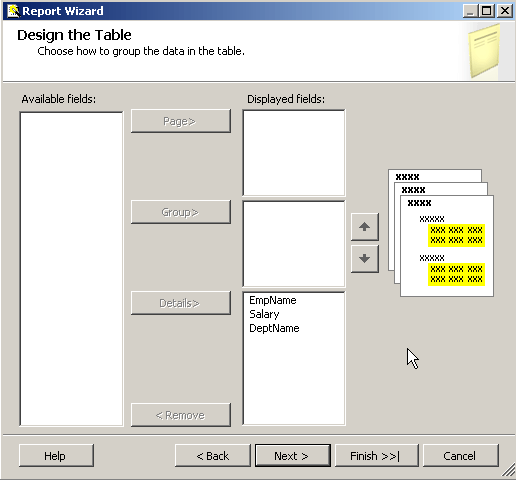
Click Next two times. Provide a name to your report (RptChart in this example) and click Finish. Entire thing should look like as below:

Update the table captions to Employee Name, Salary and Department to be more appropriate.
Adding Chart
Expand the report pane by dragging the bottom line and add a chart control from toolbox in empty area.
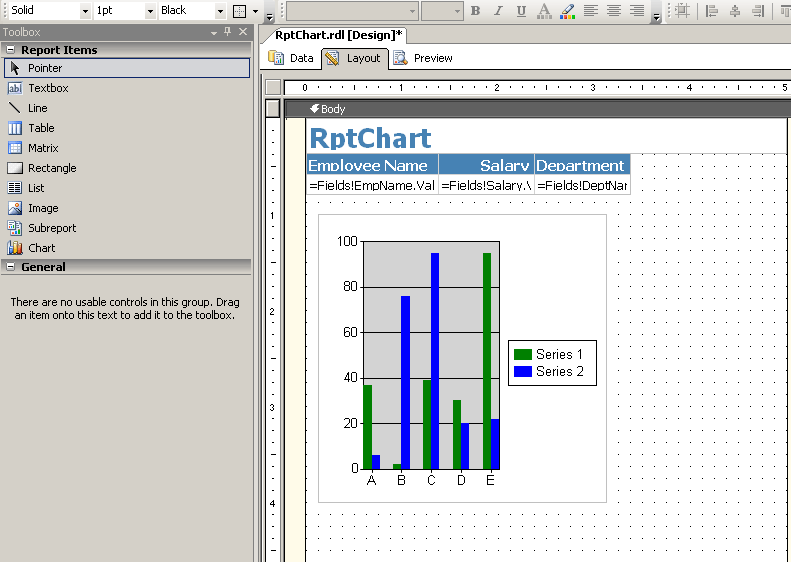
Lets now define Chart properties. Right click on chart and click 'Properties'
Provide Name and Title to the chart in 'General' tab.
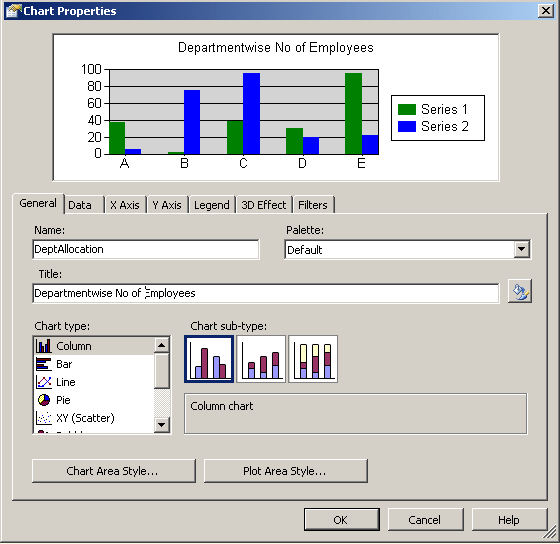
Setup chart Data
Click on Data Tab and select dataset name. Then click 'Add' against Values section. Select '=Count(Fields!EmpName.Value)' in values dropdown. Delete anything displayed in Series Label field.
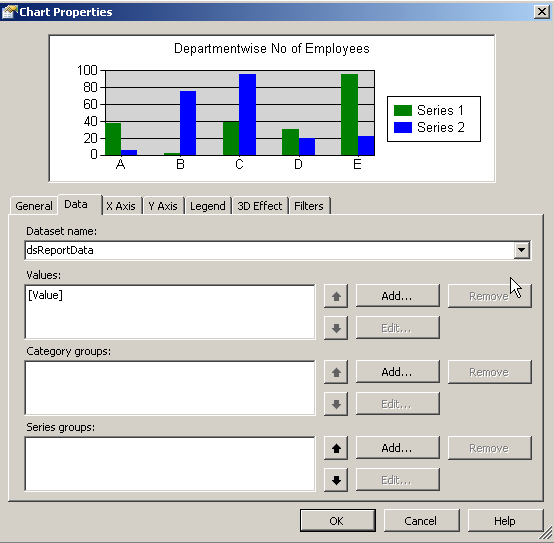
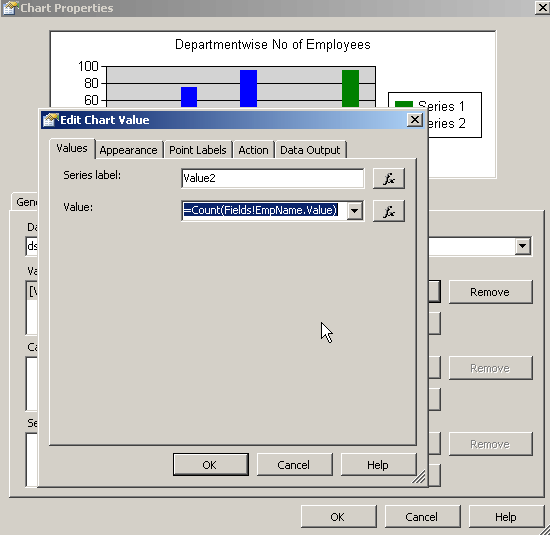
Then click 'Add' against Category groups section. Select '=Fields!DeptName.Value' in expression. Click 'Ok'

Go to 'Legend' tab and uncheck 'Show Legend' checkbox. Click 'OK' to close chart property dialog.
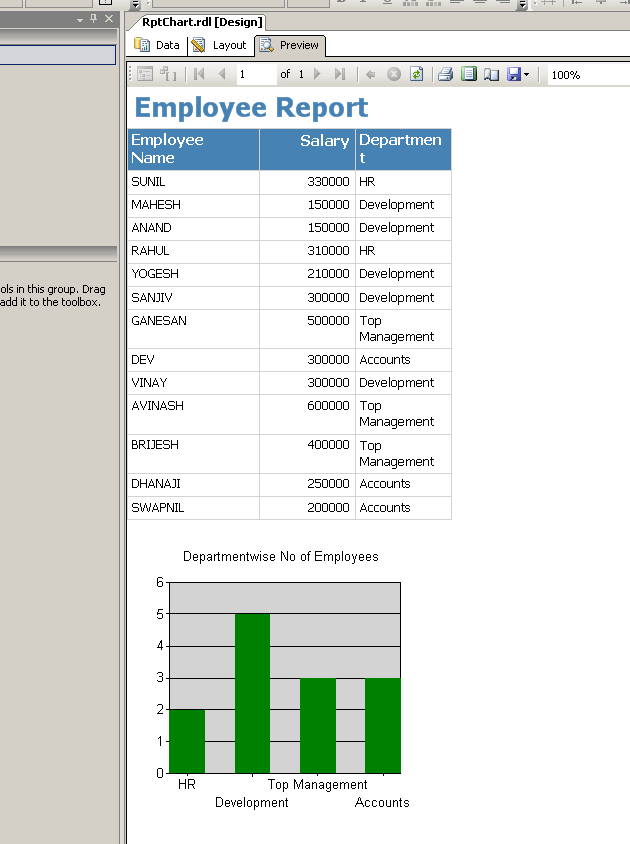
Now we have our basic report ready to run. Click on preview tab to see how report looks like.
Enhancing the Chart a little more
We developed a simple chart in a report. Lets enhance it further by adding captions on axis and providing legends. Switch to layout view and click on chart's graphical area. Three sections will appear as below.
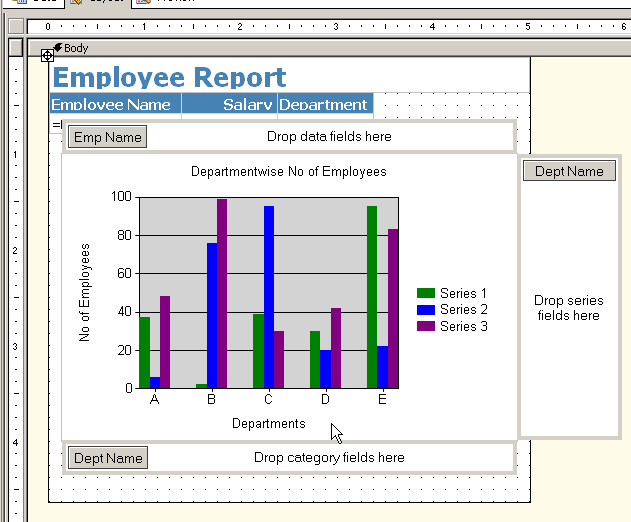
From Datasets window drag DeptName and drop it in 'Series Fields' section at right. Then open chart properties do following steps
- Go to 'Legend' tab. Check 'Show Legend' checkbox.
- On X Axis tab type 'Departments' in title field
- On Y axis tab type 'No of Employees' in title field.
- Click ok to close properties dialog box.
- Save report file and click 'Preview'
Our chart report is ready as below:

Summary
Here I have shown a step by step way to create charts on report developed using SSRS. We can further add expressions and formulas over chart to generate its display based on specific conditions like we can display only those departments where number of employees in more than 3 etc. We have different types of charts such as line chart, bar chart, bubble chart etc. The same can be exported to PDF and excel to name a few. My focus in this article was to create a chart for report data. I am not going to show how to setup a report server and deploy the reports on the server. Though I have not provided much attention towards report layout I leave it to readers to explore it.


