

One of the best ways to collect performance metrics on queries and stored procedures is to use the trace events defined by the Profiler software that comes free with SQL Server. However, running the Profiler GUI directly against production systems is not generally considered a good idea (for more details, read this article). Instead, you should set up a scripted trace, what is usually referred to as a server side trace. The server side trace uses T-SQL statements to define all the trace elements, but if you're not familiar with all the commands and structure needed to put this together, it can be a bit daunting. Don't worry, the Profiler tool comes with a mechanism to generate the scripts needed for a server side trace.
First, open Profiler, connect to a development server or some other non-production server, create a new trace, and define the events, columns, and other properties you would like to capture (here's a great article on how to do that). With the trace defined, click the on the definition window in Profiler and then immediately click the Stop button on the toolbar. You should now have a defined, but stopped trace. Now click on the File menu, then the Export menu choice and then the Script Trace Definition menu choice. From there you can generate a script for various purposes and versions of SQL Server. For this example select For SQL Server 2005 - 2008 R2 menu choice. This will just open a file save window. Select a location for the script, save it.
We're done with Profiler so you can close it.
In SQL Server Management Studio you can open the T-SQL script that you just created. This script is not specific to the server you created it on. It's simply reflects the choices you made with Profiler. The main points that concern us in this script are the beginning of the script. Assuming you used defaults, the first few lines of the script generated will look like this:
/****************************************************//* Created by: SQL Server 2008 R2 Profiler *//* Date: 10/30/2010 01:18:55 PM *//****************************************************/
-- Create a Queue
declare @rc int
declare @TraceID int
declare @maxfilesize bigint
set @maxfilesize = 5
-- Please replace the text InsertFileNameHere, with an appropriate
-- filename prefixed by a path, e.g., c:\MyFolder\MyTrace. The .trc extension
-- will be appended to the filename automatically. If you are writing from
-- remote server to local drive, please use UNC path and make sure server has
-- write access to your network share
exec @rc = sp_trace_create @TraceID output, 0, N'InsertFileNameHere', @maxfilesize, NULL
if (@rc != 0) goto error
This is where you can take control of the server side trace. The variables defined are mostly used within the query and you don't need to worry about them. The one of interest here is the @maxfilesize parameter. This will define how big the output file for the server side trace will be, in megabytes. You can set this to what seems appropriate to your system. Further, you may want to collect multiple files using the rollover option. Rollover will basically let the trace continue, but when the max file size is reached, it starts a new file. I recommend using this option so that you can collect a lot of trace data, but still access it as it gets collected. You can get to the file after the files roll over because the active file will be locked by the trace. For now I'll leave that as the default.
The comments immediately after the variable declarations tells you what to do to define a file storage location for this trace. You can use a network location, just be sure that the security context that SQL Server runs under can access that location. For the example, I'll change this to a share on my machine:
exec @rc = sp_trace_create @TraceID output, 0, N'\\mymachine\myshare\mytrace', @maxfilesize, NULL
As the comments tell you, the .trc extension will be automatically added.
From here, you can run this script, as is, on your production system and you will have a server side trace collecting data and outputting it to the file you defined. But, don't run it yet. We still need to define the rollover option. There are multiple options that can be defined for a trace, but I'll leave that for you to read in the Books Online. The one option we need to enable rollover has a value of 2. So now the script is modified as follows
exec @rc = sp_trace_create @TraceID output, 2, N'\\mymachine\myshare\mytrace', @maxfilesize, NULL
Note the change of the value from 0 to 2. Now, when this trace runs, you will get a new file every time the file size hits 5mb. You could run this script now, but there's still a problem. How do you stop it?
You have two options. You can simply start the trace and then use fn_trace_getinfo to retrieve the ID of the trace from SQL Server and then run sp_trace_setstatus to stop the trace and deallocate it. However, that's a lot of work. And, in most circumstances you only want to run the trace for a limited amount of time. Luckily, there's another option on sp_trace_create, stoptime. This defines a date and time to stop the query. Since our purpose is to automate the execution of this script, we can't simply type in the date and time we want it to stop. Instead we need to automate it. For the example here, I'll make it so it will stop one hour after it starts, regardless of start time. Here's the modification to the script:
DECLARE @stoptime DATETIME = DATEADD(hour,1,GETDATE())
exec @rc = sp_trace_create @TraceID output, 2, N'\\mymachine\myshare\mytrace ', @maxfilesize, @stoptime
I've created a variable, @stoptime, as a DATETIME data type. I've set the value of the variable using DATEADD to add one hour to the current date and time. Then, the sp_trace_create call was modified, changing the final NULL to the new variable, @stoptime. This will automatically stop the trace after one hour.
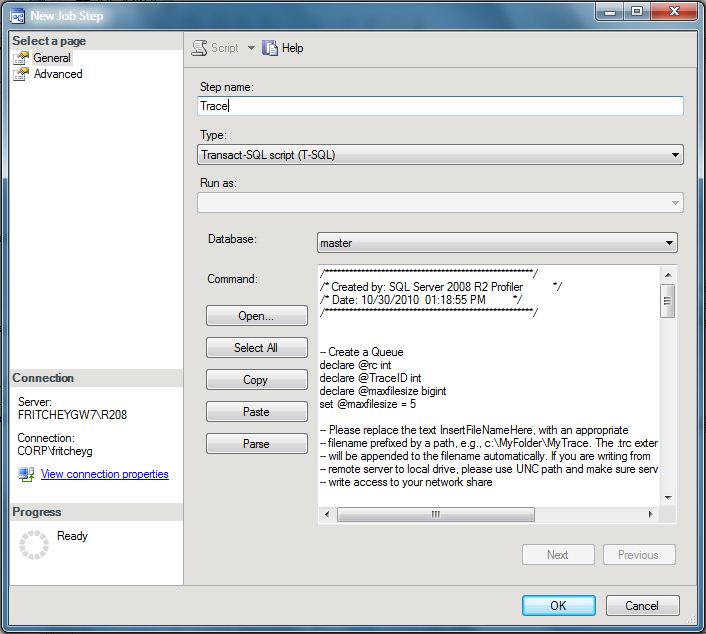
Now we're ready to execute the script. But, if you want to automate it, you can take advantage of SQL Agent. Just save the file to a location accessible from the server where you intend to automate the trace. Open Agent and add a new Job. Create a new Step. On the Step definition page, you can define the step as being a T-SQL Script. Then, click the Open button. Select the script you've been working on, and you will see it opened in the script window, looking something like you see below:
Create a schedule to run the job, or run it on demand and you'll have a server-side trace collecting the events you defined out to a file that will rollover as needed and automatically stop. This is everything you need to get started on automatically collecting performance metrics on your systems in an automated fashion.
