

SQLServerCentral has been a busy web site for over a decade. Our users come to the site for a variety of reasons. They read articles, test themselves with the Question of the Day, search for Scripts, and ask a lot of questions. Our forums are very active, and have been for years. There are many days where we have hundreds of new questions and answers posted on all aspects of SQL Server.
As the editor, I expect to have a large number of posts on any given day. If there aren't many posts, it's likely a sign that something has gone wrong. Over the last ten years we have had DNS issues, code errors, or other problems with the site. These haven't been major issues, and we've resolved them fairly quickly, but they were still annoying for the community. Our goal is to detect and react to issues as soon as possible.
To resolve these issues, we wrote various checks in T-SQL and scheduled jobs to run the checks, with alerts through email setup. That worked, but it was a little cumbersome, and over time our SQL Agent jobs became very populated with a lot of disparate checks, making administration a little more cumbersome than it needed to be.
Last year SQL Monitor v3 (currently we are at v3.4) was released with support for custom metrics. We had been running SQL Monitor on the SQLServerCentral servers for some time, but the custom metrics added a whole new dimension to the administration and monitoring of the servers. With custom metrics, we had the ability to perform any check on our SQL Servers that we wanted. As you can see on the custom metric configuration page, we have a number of technical metrics related to queries, memory, cache, and more.
However I was excited by the idea of including business metrics as well.
Forum Posts Per Hour
Having a metric that tracks the number of posts/hour allows me, as a business user of the site (I'm not the DBA or admin), to keep an eye on how the site is performing. I expect a variable, but fairly high number of posts every hour. If I see the number of posts drop to zero, it's an indication that something is wrong. Usually.
We added this metric to the site, and it was easy to do. I'll walk you through the process of building this business metric, which you can do yourselves in SQL Monitor.
The Code
The first step in any metric is writing the code. SQL Monitor requires that your code return a single, scalar value. NULL can be returned, which is taken as a 0. You can use a stored procedure as well, as long as it meets this criteria.
For this metric, I used this code:
SELECT COUNT(*)
 FROM SQLServerCentralForums.dbo.InstantForum_Topics AS ift
 WHERE DateStamp > DATEADD(HOUR,-1,GETDATE())
This counts the number of posts made in the last hour. It results in a rolling count of posts, so I don't have an exact count of posts in an hour, but I expect this value to trend up or down slightly, not dramatically. I am also usig this alert to let me know if there is a problem with the post count dropping completely off, not if the count is any particular value above 0.
Metric Meta Data
The other parts of the custom alert, things that can be lost a bit in a SQL Agent job, are more complete descriptions. In agent, I could easily add a comment section in the code, but it's also easy to forget that. Having a separate text box makes me think briefly about what I'm doing.
Here's the top of the meta data screen.
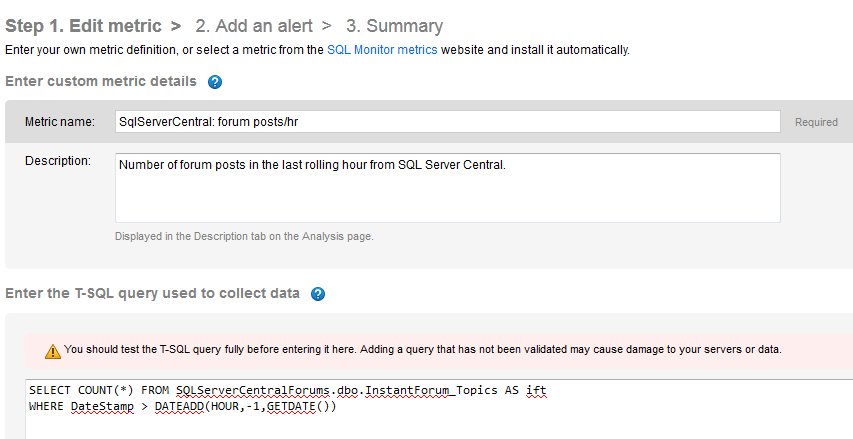
This is completely ad hoc, though we've set a standard of including our application name in the first part of the name, and then the metric name. This helps us distinguish SQLServerCentral metrics from Simple Talk metrics.
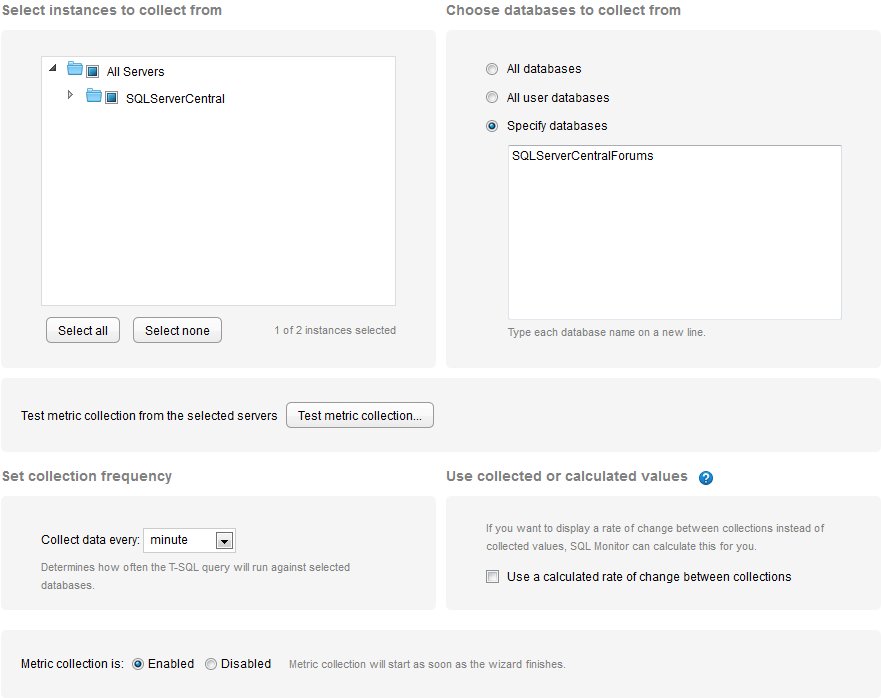
Below this, we have the chance to limit where this is run. SQL Agent can do this, but it can't easily run across multiple servers or databases. In this case we don't care, only executing this code against one database.
After this is set up, clicking the "Next" button brings us to the alert screen. At monitor.red-gate.com, we have a demo version of SQL Monitor running. On the actual SQL Monitor instance we use, we have alerts enabled. However you can see the options listed below.
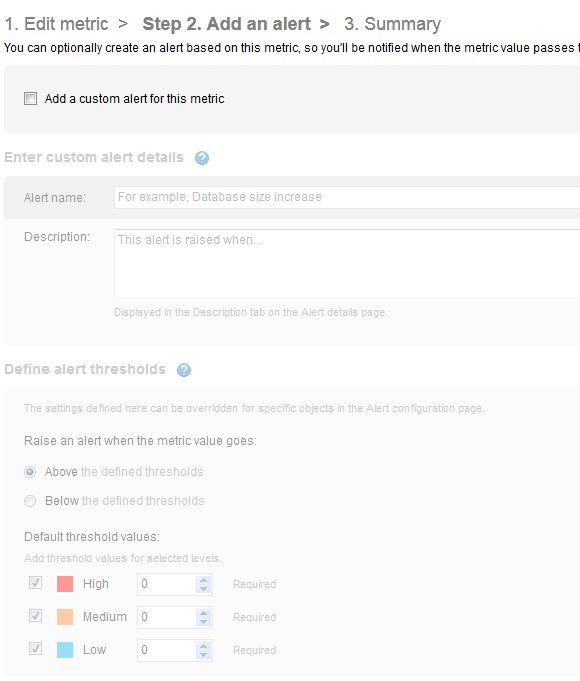
As you can see, you can change the default threshold values that are used for alerts. Below this, you can also set a minimum number of collection intervals the value must exceed the threshold before the alert is sent out.
There are a few things I'd like to see added here, particularly an exclusion time frame for the alert. Despite the fact that we are a global community, on the weekends we do typically see some short periods with zero posts, usually in the early hours of the morning, US time. For now, alerts at those times need to be ignored.
Conclusion
The ability to capture and track business metrics can be very valuable for clients and users of your applications. There are times when a business metric might alert you to an issue that would not otherwise be detected by most performance based counters.
There are a few business metrics that we have set up at SQLServerCentral to help us track the way the site is used and performing. As you have seen, this is very easy to do. We are looking to add more metrics over time that can help us to better understand the way various features are used and the value they might bring to customers, and us as site owners.
While you can write your own alerts and metric gathering in any way, SQL Monitor makes it very simple and easy to not only track and manage your data, but enables you to easily expand alerts across multiple servers and databases.

