Introduction
The first name of Microsoft Excel was Multiplan in 1982. It started with the internal code name EP (Electronical Paper). Multiplan was popular on Control Program for Microcomputers, but in DOS the most popular program was Lotus 1-2-3. In the 90s, MS Excel became more popular and eventually, Lotus 1-2-3 died.
MS Excel is still the most popular Spreadsheet software in the world. It can be installed on Windows, MacOS, iOS and Android. If you have Linux, you can run Excel using the Microsoft Office Online or using Wine and PlayOnLinux.There are several competitors like LibreOffice, NeoOffice, OpenOffice and more, but nobody can win this battle to MS Excel.
According to the Microsoft Shareholder Letter, there are 70 million users use Office 365. Office is installed in more than 50 million Android and iOS devices and this number is growing. That is why we consider important to talk about Excel when we talk about Azure Data Warehouse. Business Analysts and other teams sometimes do not feel comfortable with Power BI, Data Lake Analytics, SSMS or other new BI tools. However, they feel very comfortable with MS Excel.
That is why we will show now how to extract the ASDW information into Excel. Excel is a very popular tool to analyze ASDW data.
Requirements
- An ASDW database installed with the sample AdventureworksLT installed.
- MS Excel installed. In this example I am using Excel 2016.
- Make sure that an Azure firewall rule is created to allow an Excel connection.
Getting started
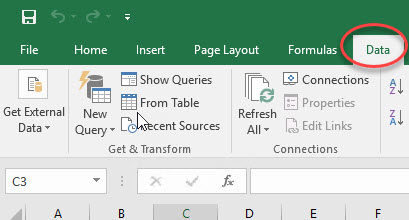
In MS Excel go to the Data Ribbon:
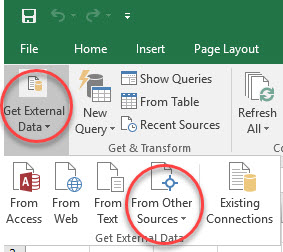
Select the option Get External Data and select the option From Other Sources:
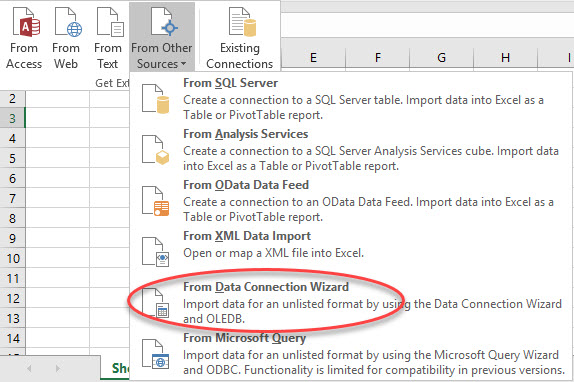
Select the option From Data Connection Wizard:
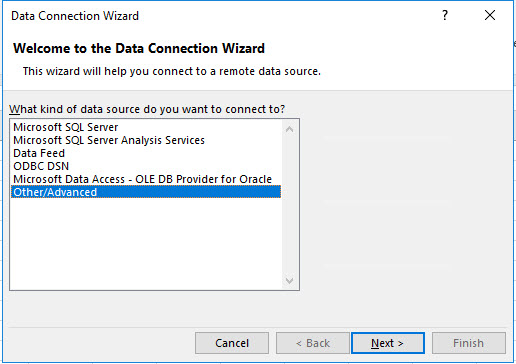
In Data Connection Wizard window, select Other/Advanced:
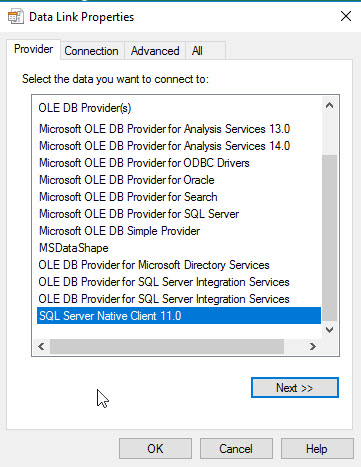
In Data Link Properties, select SQL Server Native Client 11.0:
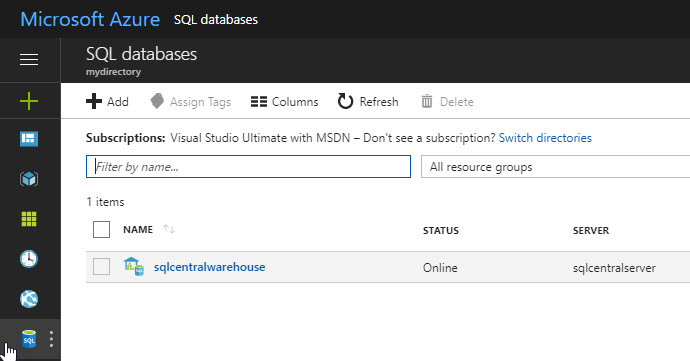
If you do not know the name of the ASDW Server, go to Azure Portal and click on Databases and click the ASDW database:
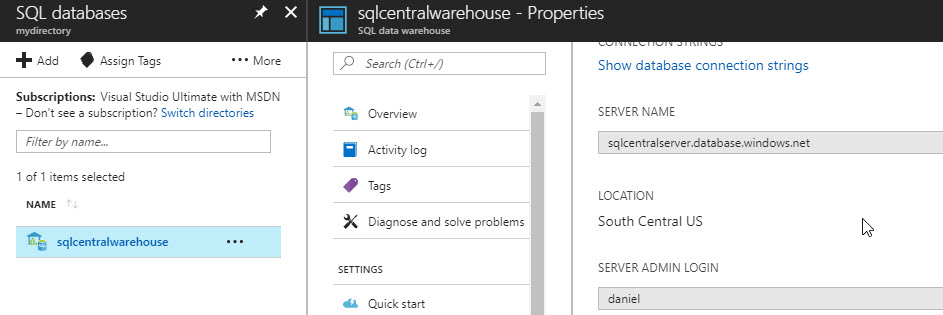
In Properties, you can find the ASDW Server Name and Server Login:
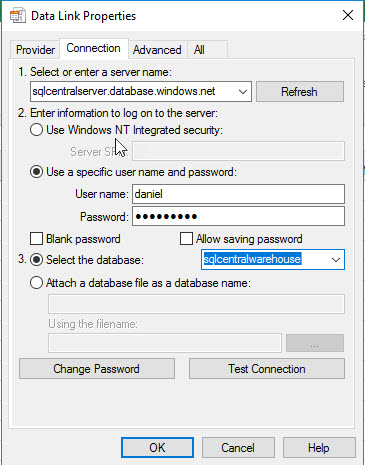
Return to Excel and write the ASDW server name, in information to log on, select use a specific user name and password. Uncheck Blank password and specify the Server Login and password. In select the database select your ASDW database and press Test Connection:
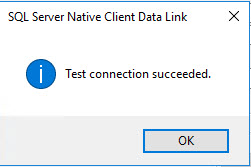
If everything is OK, you will receive a success message:
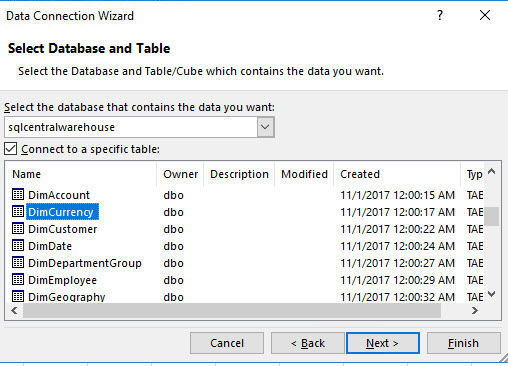
In the Select Database and Table window, you can select a view or a table. In this example, we will select the DimCurrency table:
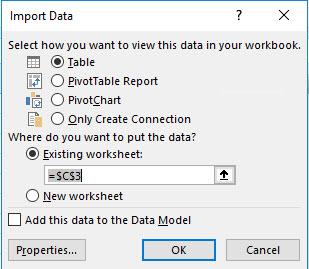
You can select how to view the data. As a Table, PivotTable-Report or PivotChart. In this example, we will view the data as a table:
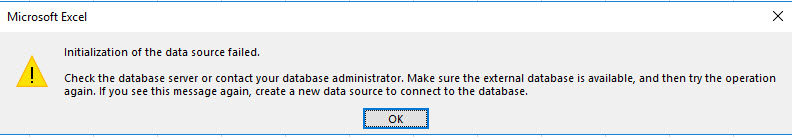
By default, there is an initialization of data error. This is normal. Press OK:
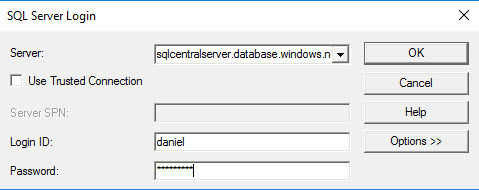
You will be asked to enter your password again and press OK:
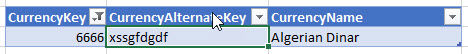
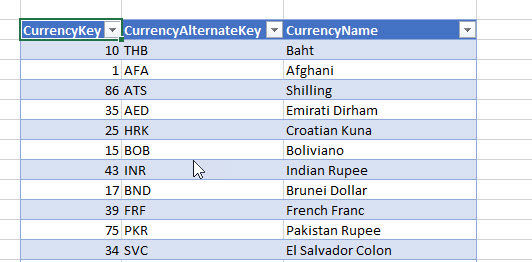
You will be able to see the ASDW data in Excel of the DimCurrency table:
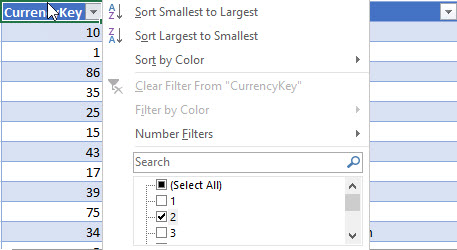
You can use filters in any column:
You can modify the data with the keyboard in Excel. This data will not be stored in ASDW. You can modify the data, but this data will be only in Excel: