

Many businesses use custom calendars. Often the tools in SQL Server Analysis Services need to be adapted to work with these calendars in time dimensions. In this article I will show you how to use custom calendars in your time dimensions and still enjoy all the benefits of SSAS tools.
4 Weekly Calendars
You may have encountered the sample calendar I am about to introduce. It is relatively common in financial accounting where a business calendar is made up of groups of the same number of weeks over a financial year. Most businesses that use this configuration call each group of weeks a Period - the year is divided into 13 Periods (each with 4 Weeks).
The first step is to give each day, week and period a unique number based on the financial year it sits in. The table below shows a partial list for a financial year that starts in April 2009. I have chosen this design simply to show you how flexible the model we develop can be. I will add another layer of complexity, and say in this scenario the business week starts on a Saturday.
Note because the 1st April is a Thursday, and the business week starts on Saturday, Week 1 actually starts in March. Because the year starts in March/April it spans 2 calendar years -so I have taken the later year of the two calendar years as the 'Year' Identifier - this is how most organisations will tag their business years - with the Year of the later year if the business year spans 2 calendar years.
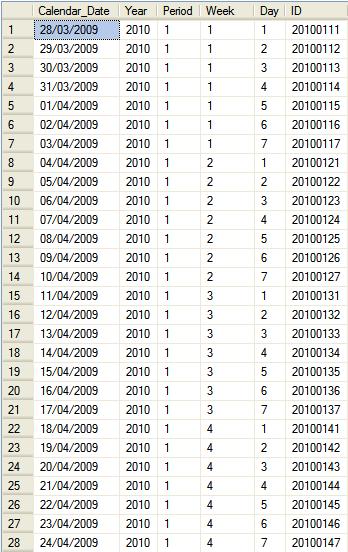
Also notice that the Period part of the ID is given 2 digit spaces to allow for Periods 10, 11, 12 and 13 (52 Weeks/4 = 13). The flexibility you can achieve with this model is quite extensive because it can be adapted to any kind of company specific calendar.
To use the different levels in a dimension hierarchy we need to give each level's members unique identifiers. With our model this is simple. We concatenate each child with its parent's values to create unique identifiers. Once this is done the table now looks like this:
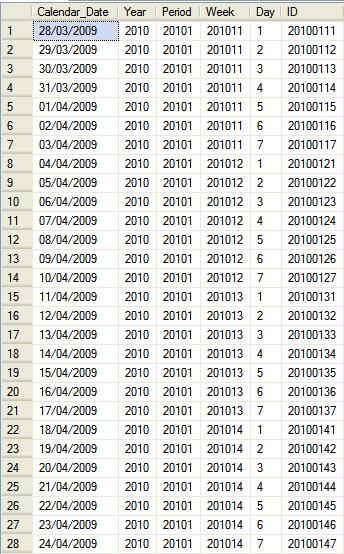
Note that as long as the pattern is followed all identifiers will always be unique. And the model will even handle those years with 53 weeks which occur every 6 years, by simply adding an extra week to one of the periods - a Week 5.
It is also important that you maintain the Calendar date so that you can use it for display purposes as the dimension is used in the cube - some users may still want to see the calendar date value. We also need some names for the levels in the time dimension hierarchy we will create. The table below shows how this could be achieved - obviously it is best to use the terminology your users are familiar with. In my case I used the descriptors as shown below.
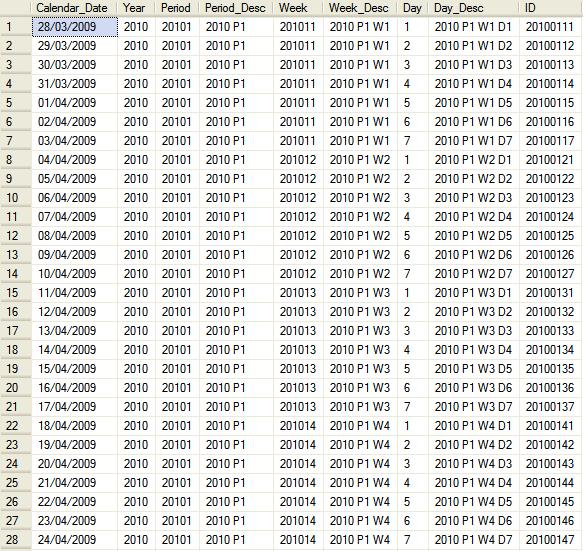
I have attached a file that shows the table with these values set up over a period of 2 years.
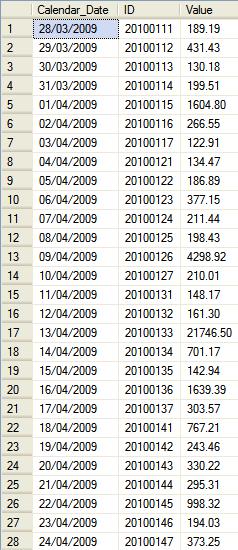
The data for the time dimension we will create is now ready, I entered this data into a table I called dbo.Days. Before we go into building the dimension and cube, we need some transactional (fact) data. I will use a simple example that tracks the money coming into a bank account. Assuming the transactions use the calendar date, we can use our newly created dbo.Days table to assign each transaction date a Day Identifier which we will use to join the time dimension to the transaction fact table. A sample of the transaction table is shown below.
Building the Dimension and Cube
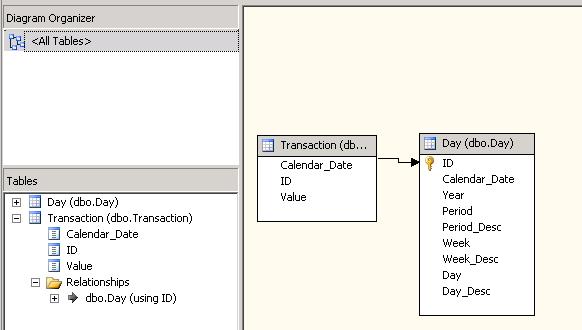
In BIDS pull in the 2 tables we created (dbo.Days and dbo.Transaction). Join them using the ID field - making sure the ID field in the dbo.Days table becomes the Primary Key if you haven't made it so in the database. Your DSV should look like this.
We can now create the Time dimension. Right click the Dimensions to create a Dimension using the Dimension Wizard. In the 'Select Build Method' screen deselect the Auto build checkbox. In the 'Select the Dimension Type' screen select 'Time Dimension' and chose the dbo_Day table from the drop down box. In the 'Define Time Periods' screen map Year to the Year column, Month to the Period column and Week to the Week column. The key thing here is that we are tricking Analysis Services to think of the Periods as though they are months, and therefore placing them below Year and above Week in the time hierarchy.
In the 'Review New Hierarchies' screen deselect the hierarchies Analysis Services has auto-generated - we will be creating our own. Finally name the dimension - Time. The Dimension Structure area should look like this.

To use the dimension we need to change a number of properties. If you expand the attribute nodes, you will notice that Period, Week and Year have all been related to day. This is not correct because we need the dimension attributes to relate according to their positions in the business calendar hierarchy - Year-Period-Week-Day.
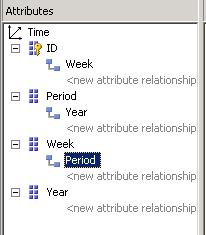
Drag the Year related attribute (underneath ID) and drop it underneath the Period attribute. Drag the Period related attribute and drop it under Week. The attribute tree should now look like this:
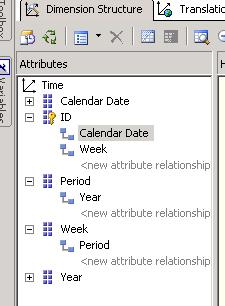
Earlier I mentioned that some users browsing the cube may wish to see the Calendar Date, so drag the Calendar Date from the day table and drop it underneath ID.
Now we can change some of the properties of these attributes. The one we will change is the NameColumn property for ID, Week and Period. Select each one and change their NameColumn property to their respective Description column for ID (Day_Desc), Week(Week_Desc), Period (Period_Desc) - you have to click 'new' in the drop down box to get the description columns. For Year select the Year column for the description.

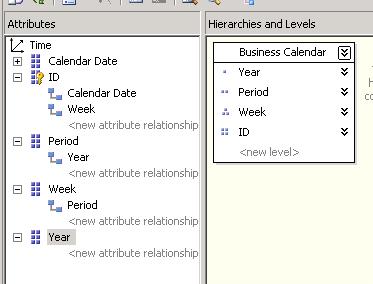
We now build our calendar hierarchy. Drag the ID, Week, Period and Year attributes into the Hierarchies and Levels area in the correct order to create a new hierarchy called 'Business Calendar' - see image below.
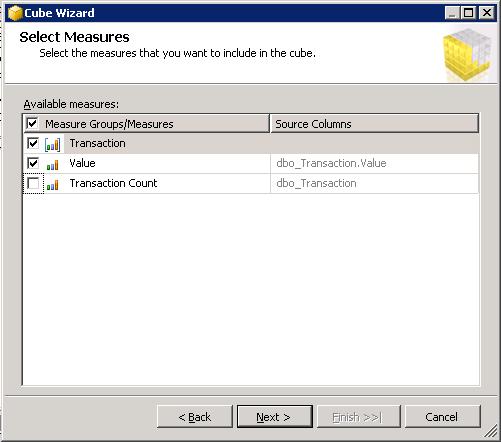
We are now ready to bring in the transactions - which is simple. Right click Cubes and select New Cube. Deselect the 'Auto build' option in the 'Select Build Method' screen. Select dbo.Transaction as a Fact table. DO NOT select dbo.Day. When you click the Next button you will be offered the Time Dimension we just created as a dimension for the cube, click it and move it into the Cube Dimensions list. In the 'Select Measures' screen select the column with the transaction vales (Value in my case):
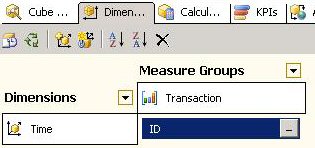
Because we linked the tables in the DSV using the ID column, Analysis Services should automatically link the dimension to the fact table using this field. You can check this by clicking the Dimension Usage tab in the cube designer.
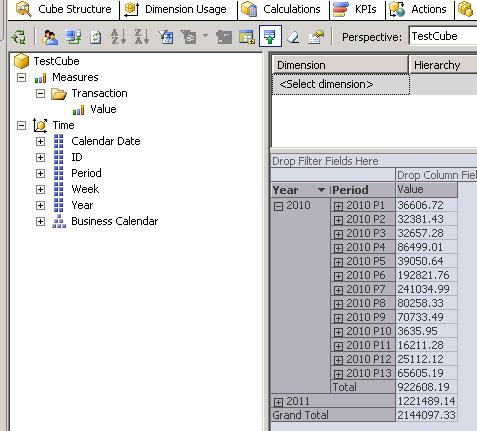
Now deploy and process the dimension and cube. Once the cube is processed we can now use our Business Calendar. In the cube Browser drag the Business Calendar to the Y-Axis and the Value Measure into the Details area. Expand one of the Year nodes, and you should see the 13 Periods:
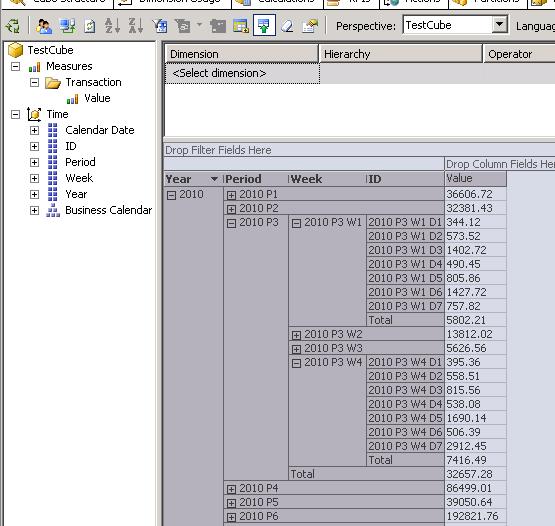
Expand one of the Period Nodes to see the Weeks, and some of the Week nodes to see the days.
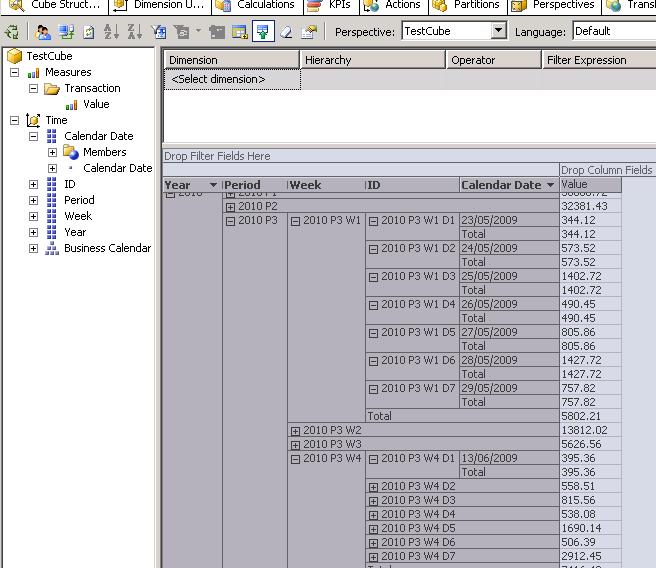
Remember I said some users may still want to see the Calendar date. So drag the Calendar date attribute and nest it after the ID (Days) column. Expand any of the Day nodes and you should see the Calendar date as shown below ( Recall, our design starts the business year in April and the Year is named after the later year of the 2 years it spans. That is why you see May and June 2009 dates in Periods in 2010).
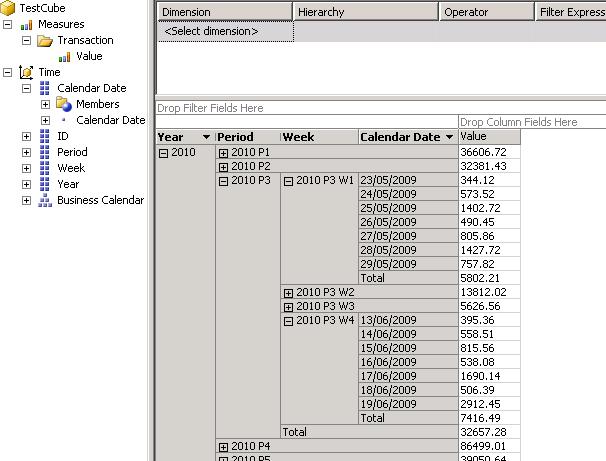
And just to show how flexible this Calendar is - drag the ID column off the Details area so that you can combine the Business Calendar with Calendar Dates like this:
As you can see developing a model like this offers you a very flexible platform to handle custom calendars. With this model you can adapt Analysis Services to cope with any custom business calendars which are usually different across different countries or territories. And above all you can still track back to the traditional Calendar date if you need to.

