Query Memory Grants - Max Used
-
Hi All
I've noticed a sudden drop in PLE on my SQL Server.
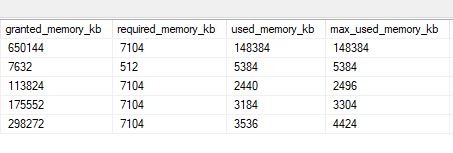
It's not to say that the system is now slow, just a noticed a drop and everything still seems to be chugging along nicely.Anyway, in trying to find the cause of this drop, I looked at sys.dm_exec_query_memory_grants and noticed the following....

What's interesting is that for most of that result set, the used and max used amounts are significantly lower than the granted memory amounts.
This is not normal behavior for this particular system
Could this be playing a part in my PLE drop?
As far as the cause for this differences between the granted and the used memory, I'm leaning towards the cause being that SQL Server is over estimating the memory requirements for the query. Am I on track here?
Could this be attributed to bad parameter sniffing? How can I track this down?Thanks
- SQLSACT - Thursday, March 1, 2018 3:59 AM
When you query dm_exec_query_memory_grant, it's showing what the grants are at that moment in time. It has no historical information. I'd worry more if you see a lot of rows with null values, meaning the sessions are waiting for memory.
Drops in PLE can be perfectly normal at times. You can see with running dbcc checkdb, if you execute right after the buffer pool has been swept by the lazy writer, etc. If it drops and then goes back up near it's normal baseline, it is often nothing to worry about.
Queries that have a lot of pages and missing indexes can hurt as can those that do a lot of physical reads. Jonathan Kehayias has a great query in this post that can help with information on both:
Sudden drop in Page Life ExpectancySue
Viewing 2 posts - 1 through 1 (of 1 total)
You must be logged in to reply to this topic. Login to reply