SQL Server 2017 not setting affinity for all processors in system
-
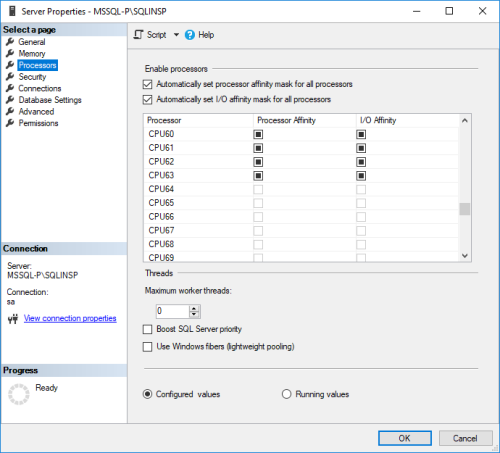
I'm running some performance tests on the new Intel Skylake procs. Here is my system outline:
Windows Server 2016 Datacenter (Volume License)
2x Intel 8168 (24 core, 48 thread)
SQL Server 2017 Enterprise Core (Volume License)Any idea why SQL Server has all the processors above 63 greyed out in this menu (attached image)? I believe this may be the cause of my performance plateauing before the CPU utilization reaches 80%.
-
Can you please open the error log and post the startup messages (the first 20 or so messages from the log)? You can remove the server names and database names.
I'm 95% certain as to why this is happening, but need the error log to confirm.
Gail Shaw
Microsoft Certified Master: SQL Server, MVP, M.Sc (Comp Sci)
SQL In The Wild: Discussions on DB performance with occasional diversions into recoverabilityWe walk in the dark places no others will enter
We stand on the bridge and no one may pass -
2017-12-29 14:08:48.83 Server SQL Server detected 2 sockets with 24 cores per socket and 48 logical processors per socket, 96 total logical processors; using 96 logical processors based on SQL Server licensing. This is an informational message; no user action is required.
2017-12-29 14:08:48.83 Server SQL Server is starting at normal priority base (=7). This is an informational message only. No user action is required.
2017-12-29 14:08:48.83 Server Detected 391874 MB of RAM. This is an informational message; no user action is required.
2017-12-29 14:08:48.83 Server Using locked pages in the memory manager.
2017-12-29 14:08:48.83 Server Large Page Allocated: 32MB
2017-12-29 14:08:48.83 Server Large Page Allocated: 32MB
2017-12-29 14:08:49.19 Server Machine supports memory error recovery. SQL memory protection is enabled to recover from memory corruption.
2017-12-29 14:08:49.97 Server Default collation: SQL_Latin1_General_CP1_CI_AS (us_english 1033)
2017-12-29 14:08:49.97 Server Automatic soft-NUMA was enabled because SQL Server has detected hardware NUMA nodes with greater than 8 physical cores.
2017-12-29 14:08:49.99 Server Buffer pool extension is already disabled. No action is necessary.
2017-12-29 14:08:50.02 Server InitializeExternalUserGroupSid failed. Implied authentication will be disabled.
2017-12-29 14:08:50.02 Server Implied authentication manager initialization failed. Implied authentication will be disabled.
2017-12-29 14:08:50.03 Server The maximum number of dedicated administrator connections for this instance is '1'
2017-12-29 14:08:50.03 Server This instance of SQL Server last reported using a process ID of 4716 at 12/29/2017 2:08:15 PM (local) 12/29/2017 8:08:15 PM (UTC). This is an informational message only; no user action is required.
2017-12-29 14:08:50.03 Server Node configuration: node 0: CPU mask: 0x0000000000555555:0 Active CPU mask: 0x0000000000555555:0. This message provides a description of the NUMA configuration for this computer. This is an informational message only. No user action is required.
2017-12-29 14:08:50.03 Server Node configuration: node 1: CPU mask: 0x0000555555000000:0 Active CPU mask: 0x0000555555000000:0. This message provides a description of the NUMA configuration for this computer. This is an informational message only. No user action is required.
2017-12-29 14:08:50.03 Server Node configuration: node 2: CPU mask: 0x0000000000aaaaaa:0 Active CPU mask: 0x0000000000aaaaaa:0. This message provides a description of the NUMA configuration for this computer. This is an informational message only. No user action is required.
2017-12-29 14:08:50.03 Server Node configuration: node 3: CPU mask: 0x0000aaaaaa000000:0 Active CPU mask: 0x0000aaaaaa000000:0. This message provides a description of the NUMA configuration for this computer. This is an informational message only. No user action is required.
2017-12-29 14:08:50.03 Server Node configuration: node 4: CPU mask: 0x0000000000555555:1 Active CPU mask: 0x0000000000555555:1. This message provides a description of the NUMA configuration for this computer. This is an informational message only. No user action is required.
2017-12-29 14:08:50.03 Server Node configuration: node 5: CPU mask: 0x0000555555000000:1 Active CPU mask: 0x0000555555000000:1. This message provides a description of the NUMA configuration for this computer. This is an informational message only. No user action is required.
2017-12-29 14:08:50.03 Server Node configuration: node 6: CPU mask: 0x0000000000aaaaaa:1 Active CPU mask: 0x0000000000aaaaaa:1. This message provides a description of the NUMA configuration for this computer. This is an informational message only. No user action is required.
2017-12-29 14:08:50.03 Server Node configuration: node 7: CPU mask: 0x0000aaaaaa000000:1 Active CPU mask: 0x0000aaaaaa000000:1. This message provides a description of the NUMA configuration for this computer. This is an informational message only. No user action is required.
2017-12-29 14:08:50.04 Server Using dynamic lock allocation. Initial allocation of 2500 Lock blocks and 5000 Lock Owner blocks per node. This is an informational message only. No user action is required.
2017-12-29 14:08:50.04 Server Lock partitioning is enabled. This is an informational message only. No user action is required. - dnwobu - Friday, December 29, 2017 1:47 PM
Ok, my first assumption was wrong. I thought it was a licensing problem.
Have you confirmed that SQL's not using those processors? Check the processor load, check sys.schedulers
Gail Shaw
Microsoft Certified Master: SQL Server, MVP, M.Sc (Comp Sci)
SQL In The Wild: Discussions on DB performance with occasional diversions into recoverabilityWe walk in the dark places no others will enter
We stand on the bridge and no one may pass -
Yeah I thought it was licensing too. I've been scouring a number of MSFT tech pages about the affinity mask but nothing really explaining why auto stops at 64 procs. Also when I try setting manually, I still can't enable the others.
I also looked into processor groups to see if the sql server process is stuck to one group that has 64 procs and not accessing the other.
select * from sys.dm_os_schedulers
With regard to sys.dm_os_schedulers, the cpu_id column list values 0-47 and 64-111. The scheduler_id column lists values 0-95 then jumps to a few high values for some hidden online schedulers (1048576-1048593)Also looking at my perfmon data, the overall CPU usage caps at around 56% and never increases no matter how much more load I add with my test. I even did some spot checking with my data files and looked at specific cpus within both NUMA nodes. They varied between 45%-57% usage. When I look at task manager during an active test, it seems like all the procs are under load.
I looked into these things before I posted to the forum. I was hoping someone with a high core count system had seen this before. Let me know if you can think of anything else to look into. Thank you.
-
Ok, I suspect what you're seeing is not SQL not using the other processors, but a side effect of how affinity is set on higher processors. Your observation that all processors are ~50% under load suggests that as well.
Check sys.dm_os_schedulers, and look at the load factor, the worker count and other columns. That'll tell you if SQL is using those processorsKeep in mind that overall processor usage will not all reach 100%, it's very, very hard to max out modern processors, and you could well have waits or other resource constraints that's limiting throughput.
Gail Shaw
Microsoft Certified Master: SQL Server, MVP, M.Sc (Comp Sci)
SQL In The Wild: Discussions on DB performance with occasional diversions into recoverabilityWe walk in the dark places no others will enter
We stand on the bridge and no one may pass -
I understand that I wont reach 100% CPU but the only bottleneck keeping my server from doing more transactions has to be the application not leveraging the full system capability. My disk throughput is only around 1.4GB/s where the 4x NVMe drives (mirrored storage spaces) I'm testing on each have a write throughput of about 2GB/s each. In theory, I should be getting closer to 4GB/s if my drives were the bottleneck and that's not even taking into account the mixed workload of the tpcc test.
When looking at the load factor some are set to 0, 1, or 2. I'll run the query again when I have an active test going and observe. I'll post again if anything seems odd.
-
Please do. I'd like to see some snapshots of the schedulers DMV under load.
Are you monitoring wait stats? If not, can you also take snapshots of sys.dm_os_wait_stats while running your load tests?
Gail Shaw
Microsoft Certified Master: SQL Server, MVP, M.Sc (Comp Sci)
SQL In The Wild: Discussions on DB performance with occasional diversions into recoverabilityWe walk in the dark places no others will enter
We stand on the bridge and no one may pass
Viewing 8 posts - 1 through 7 (of 7 total)
You must be logged in to reply to this topic. Login to reply