K-Means Clustering with Python
-
Hello Again!
Figured I would drop some more knowledge, but more specifically on the actual topic of Machine Learning. This bit is going to cover an unsupervised learning technique with K-Means Clustering in Python. Unsupervised, in case you didn't know, just means we are not going to train the data or provide insight on what is good or what is bad to help the algorithm get to the right results. It's just going to take some data, learn from it on it's own, and output a final result.
Some people actually dislike this practice because you're not actually adding that human bias to the output. You're essentially letting the data speak for itself. This can lead you to believe the data itself, all that hard work and money you spent on it, may actually not be as valuable than you thought.
K-Means is a popular clustering approach that aims to partition n observations into k clusters in which each observation belongs to the cluster with the nearest mean, serving as a prototype of the cluster. This results in a partitioning of the data space into Voronoi cells. The trick is trying to find right value for K. In the real world, you won't know the "Right" value of K to start with and you'll need to converge on it yourself through analyzing the data.
The following function and outline was from a course I took on Python and Machine Learning that is going to fabricate income and age. The function is also going to try to simulate some natural clusters for us to help us understand how this works. But you will see that even with the natural clusters, it's not always going to churn out the results we expect from a human eyeball perspective.
from numpy import random, array#Create fake income/age clusters for N people in k clusters
def createClusteredData(N, k):
random.seed(10)
pointsPerCluster = float(N)/k
X = []
for i in range (k):
incomeCentroid = random.uniform(20000.0, 200000.0)
ageCentroid = random.uniform(20.0, 70.0)
for j in range(int(pointsPerCluster)):
X.append([random.normal(incomeCentroid, 10000.0), random.normal(ageCentroid, 2.0)])
X = array(X)
return XThen we will use K-Means to discover if there are any clusters in the data using this unsupervised learning:
%matplotlib inlinefrom sklearn.cluster import KMeans
import matplotlib.pyplot as plt
from sklearn.preprocessing import scale
from numpy import random, floatdata = createClusteredData(100, 5)
model = KMeans(n_clusters=5)
# Note I'm scaling the data to normalize it! Important for good results.
model = model.fit(scale(data))# We can look at the clusters each data point was assigned to
print model.labels_# And we'll visualize it:
plt.figure(figsize=(8, 6))
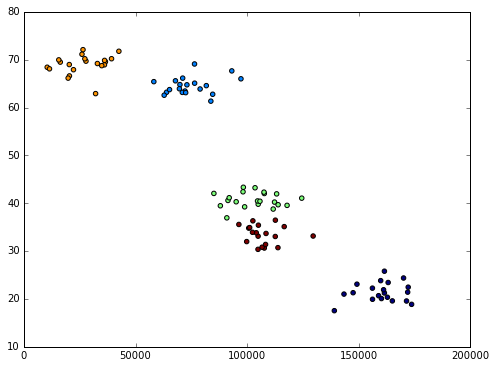
plt.scatter(data[:,0], data[:,1], c=model.labels_.astype(float))
plt.show()
From the results, we selected the K value of 5. We can see that maybe 5 was not the best result here because from a human eyeball perspective, we can clearly see there is 4 separate clusters of data, not really 5 clusters. But that's likely not what we would see in a perfect world either. Here are the high-level steps of K-Means and what it's doing:
- Place K points into the space represented by the objects that are being clustered. These points represent initial group centroids.
- Assign each object to the group that has the closest centroid.
- When all objects have been assigned, recalculate the positions of the K centroids.
- Repeat Steps 2 and 3 until the centroids no longer move. This produces a separation of the objects into groups from which the metric to be minimized can be calculated.
In Closing
This is just to show you how easy it is to use Python with machine learning. I'm no master data scientist or whatever, but from a technology or IT perspective, I can use something like this to identify new classifications of the data I have in SQL Server. This may help me create new features of my existing data to help my team understand how certain data is doing what and why. For example, in marketing, maybe can identify various clusters of users who spend more, but maybe click less or click more and spend less to where I can group them up into classifications for further breakouts of those uses in the final reports. It may lead the team to easily identify, call them out and maybe even target them in future reactions to what they see from the results.
Viewing 0 posts
You must be logged in to reply to this topic. Login to reply