
Say we have a stored procedure that has two queries in it – the second query uses a recompile hint, and you might recognize it from my parameter sniffing session:
|
1 2 3 4 5 6 7 8 9 10 11 12 |
CREATE OR ALTER PROC dbo.usp_SearchUsers @Reputation INT AS BEGIN /* Query 1, always the same: */ SELECT COUNT(*) FROM dbo.Users; /* Query 2, recompiles and gets different plans: */ SELECT TOP 10000 * FROM dbo.Users WHERE Reputation = @Reputation ORDER BY DisplayName OPTION (RECOMPILE); END GO |
The first query will always get the same plan, but the second query will get different plans and return different numbers of rows depending on which reputation we pass in.
I’m going to do some setup, free the plan cache, and then run the proc:
|
1 2 3 4 5 6 7 8 9 10 |
USE StackOverflow GO DropIndexes; GO CREATE INDEX IX_Reputation ON dbo.Users(Reputation); GO DBCC FREEPROCCACHE; GO EXEC usp_SearchUsers @Reputation = 2 |
When I run it for @Reputation = 2, the second query returns 9,149 rows.
How a recompiled query shows up in the plan cache
If I check sys.dm_exec_query_stats right now, there are a few columns with interesting results – I’m going to move them around a little so you can see ’em:
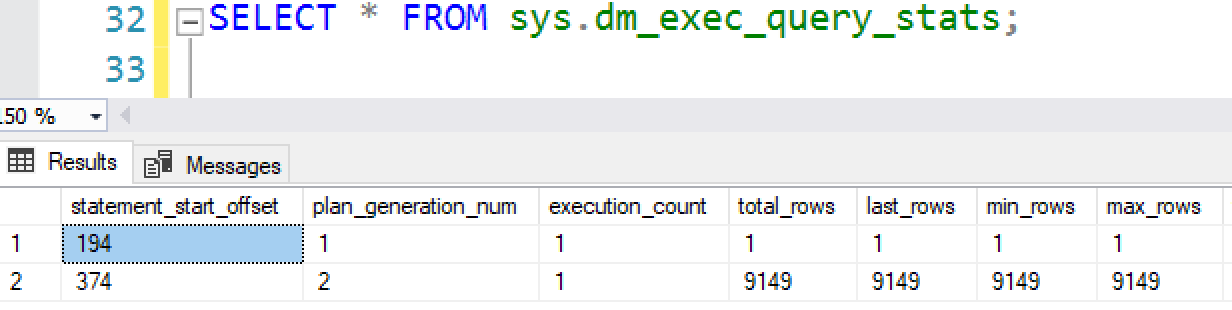
Line 1 is the first query in the stored procedure. It’s a COUNT(*), and it only returns 1 row.
Line 2 is the second query, and it returns 9,149 rows for reputation = 2.
So right now, if I’m inclined to do math, I can add up the total number of rows for both statements and I can see the total number of rows returned by the query. It might seem odd to use rows as a measurement right now, but sys.dm_exec_query_stats’s columns – CPU, reads, writes, duration, etc – all behave the same way as I’m about to show you here, and the rows numbers are more repeatable than some of the others, so let’s use rows.
If I execute the stored procedure twice – for two different parameters – and then check metrics, things look different:
|
1 2 3 4 5 6 7 |
DBCC FREEPROCCACHE; GO EXEC usp_SearchUsers @Reputation = 2 GO EXEC usp_SearchUsers @Reputation = 1 GO SELECT * FROM sys.dm_exec_query_stats; |
The results:
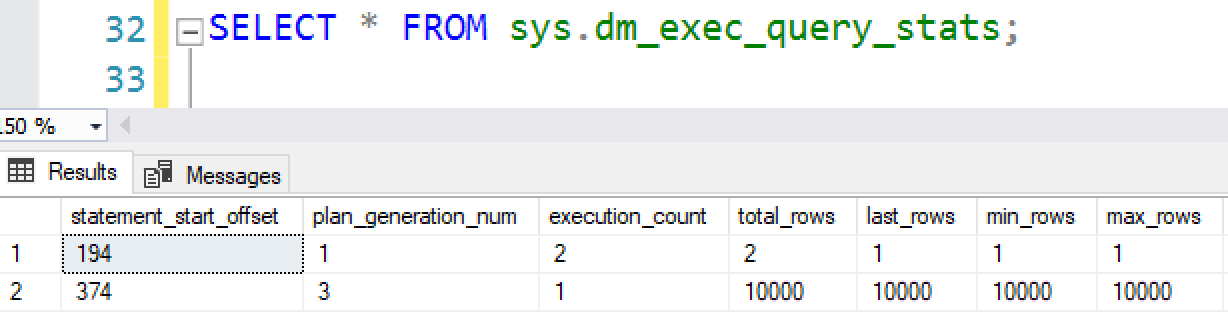
The first query’s plan stuck around in memory, so it now shows 2 executions, and 2 total rows returned. Its row metrics are correct through the life of the stored procedure’s time in cache.
However, the second query – the one with the recompile hint – has a brand new plan in the cache, but also new metrics. You’re not just recompiling the execution plan, but you’re also not getting query plan metrics here. (That’s fine, and that part I was also kinda aware of.)
But the part that I keep forgetting is that when I’m looking at the stored procedure’s totals in sp_BlitzCache, the total, min, and max values are useless:

In sp_BlitzCache, we add up the totals for each statement in a proc, and we present those as the total numbers for the proc. The problem is that they’re just not true whenever there’s a recompile hint: the totals are underreported, and the avg/min/max just reflect the last execution of any query with a recompile hint.
The plan cache just isn’t a good fit for tracking queries with RECOMPILE hints – but Query Store is.
How a recompiled query shows up in Query Store
I’m going to turn on Query Store in the Stack Overflow database, and then run the two queries again:
|
1 2 3 4 5 6 7 8 9 |
ALTER DATABASE CURRENT SET QUERY_STORE = ON; GO ALTER DATABASE CURRENT SET QUERY_STORE (OPERATION_MODE = READ_WRITE, QUERY_CAPTURE_MODE = ALL); GO EXEC usp_SearchUsers @Reputation = 2 GO EXEC usp_SearchUsers @Reputation = 1 GO |
And then query Query Store:

I get a much better picture of the number of times that the recompiled queries have run, AND the number of rows they’ve returned each time. (And of course you get other much more useful query tuning metrics too, like CPU, reads, duration, etc.)
When you decide to use RECOMPILE hints,
you probably wanna enable Query Store.
Query Store first shipped in SQL Server 2016, and about half of all production servers are 2016+. Today, in 2020, when your query tuning efforts require you to put in RECOMPILE hints, then you should probably stop for a moment to consider Query Store too. It’ll make your performance troubleshooting easier down the line.
Query Store does require a little more planning than just putting in a RECOMPILE hint, though. Here are the things you wanna think through:
- Watch Erin Stellato’s Pluralsight course on Query Store – to learn how to implement it (no, the two-line command in my post isn’t enough) and how to query it
- Read her post on Query Store Best Practices
- Stay up to date on SQL Server patches – there have been a bunch of Query Store bugs along the way, like log file problems and blocking
- Read this week’s T-SQL Tuesday posts, including Two Query Store Stories, which covers both the good and the bad
Are these things more work? Yep, absolutely, and the combination of RECOMPILE hints and enabling Query Store logging is going to have a performance impact on your server. You don’t wanna flip these switches unless you’re convinced it’s the best way to solve a parameter sniffing problem. There are other solutions, too – as a quick refresher, if you’re not familiar with any of the other ways, check out my video from SQLDay Poland:

2 Comments. Leave new
Query Store <3
[…] Brent Ozar has some tips if you use RECOMPILE hints frequently: […]