

A significant part of product development is A/B testing. Simply put, this is where companies and product managers test to see a new version of their product versus the older one to make sure it’s worth publishing their features to the entire user base. In order to do this, an A/B test needs to be set up where two user groups, test and control, respectively use the new and current version of the feature. The change in the feature can be as modest as changing the color of a button.
For an A/B test to be effective, the test and control user distributions need to be comparable so that we can then estimate the exact impact of the feature change. Comparable test and control user distribution means that, for each relevant segment, the relative proportion of users in test and control is similar. For example, if there are 10% users from the US in the test group then we should ideally expect to have about the same in the control group as well.
In practice, however, test and control distributions are frequently very different, thus leading to invalid test results. The biggest reason for that is bias in the randomization algorithm that assigns users to test and control, leading to over/under representation of certain segments, like having more US users in control compared to test. Therefore, it is imperative to check the test and control group distributions before proceeding with the test.
The Problem at Hand
Below is an example to demonstrate that. The problem we have at hand is that of a data scientist that noticed Spain-based users have a much higher conversion rate on the company’s e-commerce website than any other Spanish speaking country.
Spain and Latin American managers point out that it could potentially be due to translation. All Spanish-speaking countries had the same translation of the site that was written by a writer from Spain. Therefore, they agreed to try a test where each country would have its translation written by a local. For example, Argentina users would have translation by an Argentinian writer, Mexico users by a Mexican writer and so on.
However, after the test was run, the test results turned out to be negative. It appears that non-localized translation was doing better. The task at hand is to:
- Confirm that the test is negative, i.e. the older version of the site with just one translation across Spain and Latin America indeed performs better
- Find out why that is happening and are the localized translations worse?
- If the error is identified, can we design an algorithm that returns FALSE if the same problem happens in the future and TRUE if everything is good? In other words, can the results be trusted?
Reading the Data Sets
We have two data tables to work with: a fact table with the general information about the test results. The columns in the table are described as below:
First, we have the Test_table: a fact table with test results and the following columns:
- user_id: Unique identifier for each user
- date: When the users first came to the site for the first time since the test started
- source: Marketing channels (Ads, SEO, Direct)
- device: Device used by user
- browser : user browser (IE, Chrome, Android_App, FireFox, Iphone_App, Safari, Opera)
- browser_language: Language chosen by user in browser or app settings (EN,ES,Other)
- ads_channel: If the marketing channel was ads, then this is the site where the ad was displayed (Google, Facebook, Bing, etc.). If the user did not come through an ad then the field will show as “NA”
- Conversion: label showing whether the user converted (1) or not (0). A test is considered successful if it increases the proportion of users who convert
- test: indicator that shows whether the user was in the test(1) or control(0) group.In this example, the test users see the new translation and control users see the old version. This is obviously always “0” for Spain-based users
Next we have the User_table: dimension table with user information and these columns:
- user_id: Unique identifier for each user
- sex: user sex - Male or Female
- age: user age (self-reported)
- country: user country based on ip address
Analyzing the Data
It is important to understand that the only difference between the test and control groups has to be the feature. The user distributions in the test and control groups should be comparable. For example, if 10% of users in the test group are from the United States, then we should expect about the same proportion of US users in the control group as well.
From a purely statistical point of view, this should be true for a large data set, as we are looking for small gains in the test. However, in practice, the test and control group distributions can be wildly different and thus invalidating the test results. The primary reason for this is bugs or randomization in the two data sets, leading to over/under representation of certain segments. Thus, it becomes necessary to check for similarities in the test and control group distributions before conducting the statistical test.
R is my preferred language of choice when it comes to solving data science problems. First step in the process is to load the libraries that are needed.
Next let's read our two tables that are in .csv format.

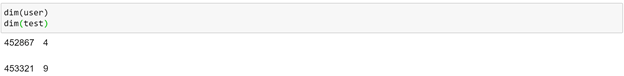
In order to check for duplicates, let's do a quick test:

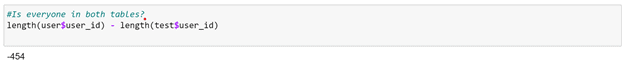
Clearly, the user table is missing some user IDs. Although this is fairly common in the real world, in this example, since there are very few values we can simply merge/join them from the test table into the user table. In practice, if this happens, we should try to find out what happened as there may be a bug somewhere.
Verifying the Problem
Now we need to check the test results, but let's first make sure that Spain’s conversion rate is indeed higher than that of LatAm countries.
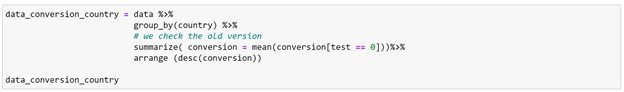
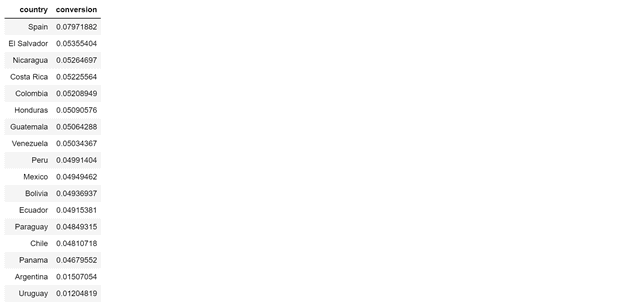
Indeed, Spain has a higher conversion rate. We can do a t-test here. The test/control split is about 50/50. Since nothing changed in Spain, we can omit those users.
We can see here that the control users are converting at 4.8% while test users at 4.3% - that is a big 10% drop! In an actual scenario that is a very dramatic drop. There could be a couple of reasons for these odd results:
- Not enough data was collected
- There is a bias in the test and control groups
Solving the Problem
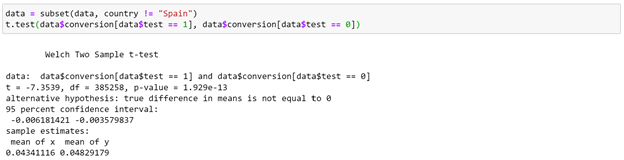
Firstly, let’s look at a day by day plot to find out if these results have been happening consistently or suddenly.
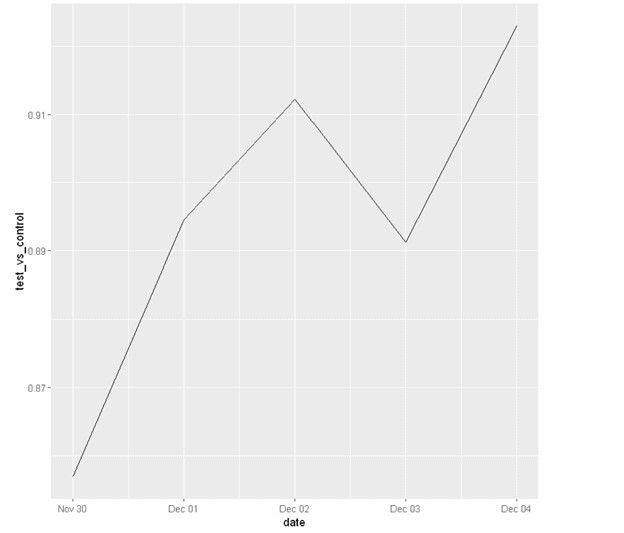
From the plot we notice a couple of things:
- Test has consistently been worse compared to control and there is relatively very small variance across days. This means although we do have enough data, there is a bias in the experiment setup
- Also, we only ran the test for 5 days. We should always run a test for at least a week (2 weeks would be ideal) in order to capture weekly patterns
Now that we know there is some bias in the experiment, it is likely that some of the user segments are more likely to appear in test or control - which means these segments had a higher/lower conversion and thus affecting the overall results.
From here we would need to check the randomization of the experiment to ensure that the distribution of the variables was the same in test and control. For example, considering the variable ‘source’, checking the randomization for this variable would simply mean to ensure a similar proportion of users coming from SEO, ads, direct. This can be achieved easily:
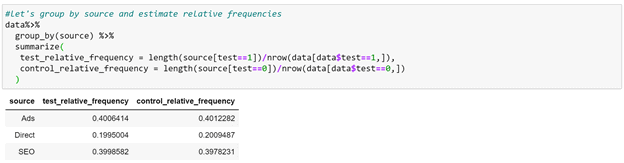
As we can see, the relative proportion of users from different sources is similar in both tables.
Using a Machine Learning Model
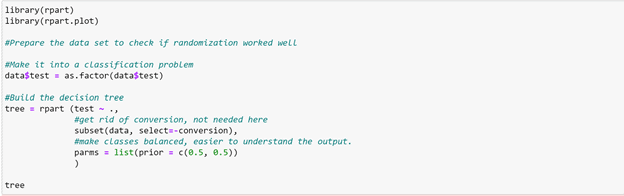
Potentially, we can do this for every variable but obviously this would be very tedious especially if there are numerical as well as categorical variables to consider. So instead, we can use basic Machine Learning and let an algorithm do this for us instead. Here is how we approach this:
- Get rid of the conversion variable for now. We don’t need it for now. We just want to check if the user distributions are the same.
- Use the variable test as our label. Try to build a model that manages to separate the users whose test value is 0 vs those whose value is 1. If randomization worked well, this should be impossible because the two groups are exactly the same. However, if randomization did not work well then the model would be able to provide a variable to separate the two groups.
- Pick a model. We shall use a decision tree which would allow us to clearly see which variable (if any) is used for the split - that is what caused the randomization to fail.
Verifying the Model
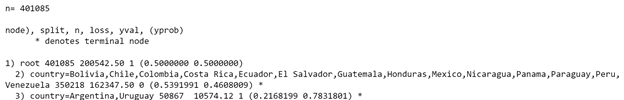
Indeed, the test and control are not the same. From the model we can see that, users from Argentina and Uruguay are more likely to be in test (~78%) than control (~22%). We can make sure of this by checking on the proportion of these users.
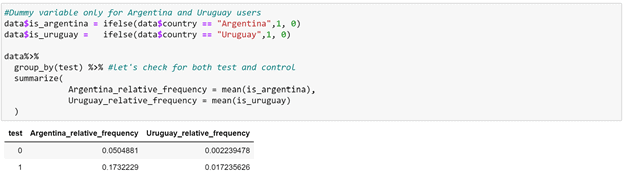
We can see from the table above that while 17% of users in test are from Argentina, only 5% of them are in control. And, while 1.7% of users from Uruguay are in test, hardly any of them (0.2%) are in control. The difference in conversion rate may well be because the two user groups are different.
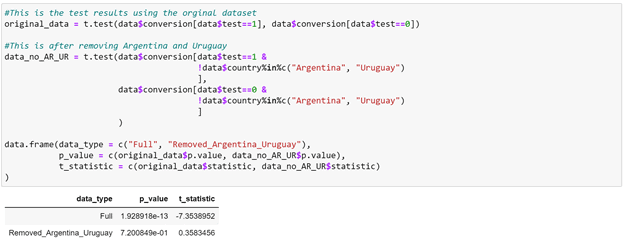
The negative t-statistic means that the two countries (Argentina and Uruguay) are over/under represented in the test and that the bias is statistically significant.
Conclusions
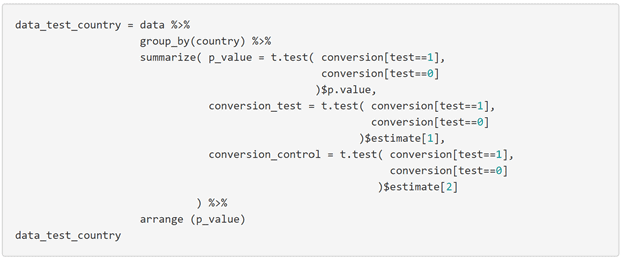
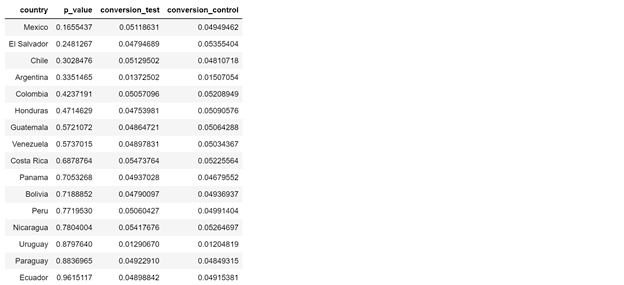
After we control for country, we see that the test clearly appears non-significant. Since the test did not improve conversion rate, we can conclude that it was not a success. We do know, however, that the localized translation did not make things any worse.
At this point there are 2 things that can be done:
- Let engineering know of the bug in the test, fix it and re-run the test. During the process of finding out what went wrong, we may discover other things that could be wrong. So it is important to get to the bottom of it.
- If we find out that for some reason there was a problem with only those two countries, we can potentially adjust the populations such that the relative frequencies become the same and then re-check the results.
It is common to see non-significant test results after conducting an A/B test. What constitutes significance comes from product teams who take the 'cost of making a change' into consideration. Since a lot of the times this cost can be large, even if the test is barely a success, the product team may decide to go against making that change.

