

Problem
Many of us are already aware of the looping methodologies in a programming language and their benefits. Looping helps us iterate over a set of items over and over again to obtain a final result. In this article, I'm going to demonstrate how to iterate/loop over a series of objects in Power BI using Power Query.
For the sake of this tutorial, I'm using the AdventureWorksDW2017 database provided by Microsoft. You can download and install the database locally. This article assumes you have some fair knowledge on how to import data into Power BI from a SQL Server table.
Disclaimer: There is no special FOR loop in Power Query. We will use the "GROUP" function in Power Query to achieve our goal. Although there is a function known as List.Accumulate which can be used to iterate over a list, that is an advanced topic and is out of scope for this simple article.
Solution
We have this dataset in SQL, and we would like to analyze the highest-selling category in each region. For this, we would need to group all the categories by the region and then calculate the maximum sales.
Let's go ahead and implement the GROUP function in Power Query to achieve our final result. We can divide the entire process into four important steps and proceed accordingly.
- Get the data into the Power BI environment.
- Group the records using AllRows on the desired group level.
- Apply custom function or a series of nested formulas over the tables that have been grouped.
- Expand the resultset.
Out of all the four, the 3rd step is the most important and critical. Here, we need to translate our logic into formulas. Since we want to visualize the highest-selling category within each region, we would need to sort the grouped subtables on the region level in descending order. The second step is to rank the records in the sorted tables by adding an index column to it. This index column will help us identify the highest-selling category.
Step 1 - Get the data into the Power BI environment
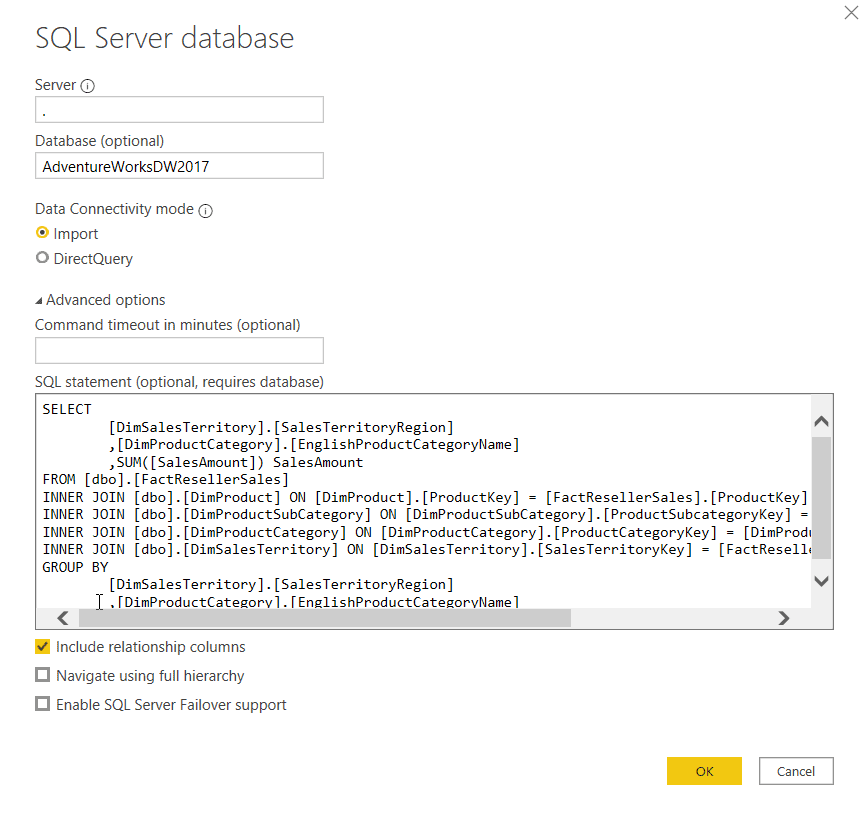
This step involves fetching the source data from SQL into the Power BI environment. For this article, I'll be using the query below to fetch the following three columns into Power BI.
- EnglishProductCategoryName
- SalesTerritoryRegion
- SalesAmount
SELECT
[DimSalesTerritory].[SalesTerritoryRegion]
,[DimProductCategory].[EnglishProductCategoryName]
,SUM([SalesAmount]) SalesAmount
FROM [dbo].[FactResellerSales]
INNER JOIN [dbo].[DimProduct] ON [DimProduct].[ProductKey] = [FactResellerSales].[ProductKey]
INNER JOIN [dbo].[DimProductSubCategory] ON [DimProductSubCategory].[ProductSubcategoryKey] = [DimProduct].[ProductSubcategoryKey]
INNER JOIN [dbo].[DimProductCategory] ON [DimProductCategory].[ProductCategoryKey] = [DimProductSubcategory].[ProductCategoryKey]
INNER JOIN [dbo].[DimSalesTerritory] ON [DimSalesTerritory].[SalesTerritoryKey] = [FactResellerSales].[SalesTerritoryKey]
GROUP BY
[DimSalesTerritory].[SalesTerritoryRegion]
,[DimProductCategory].[EnglishProductCategoryName]
Using the query above, you can fetch the data into the Power BI environment.
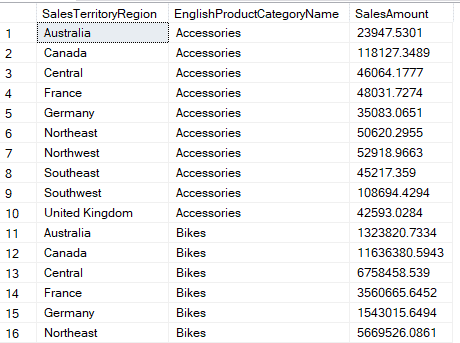
Once the data is imported into Power BI, drag and drop the fields into a table box such that we have the following table created.
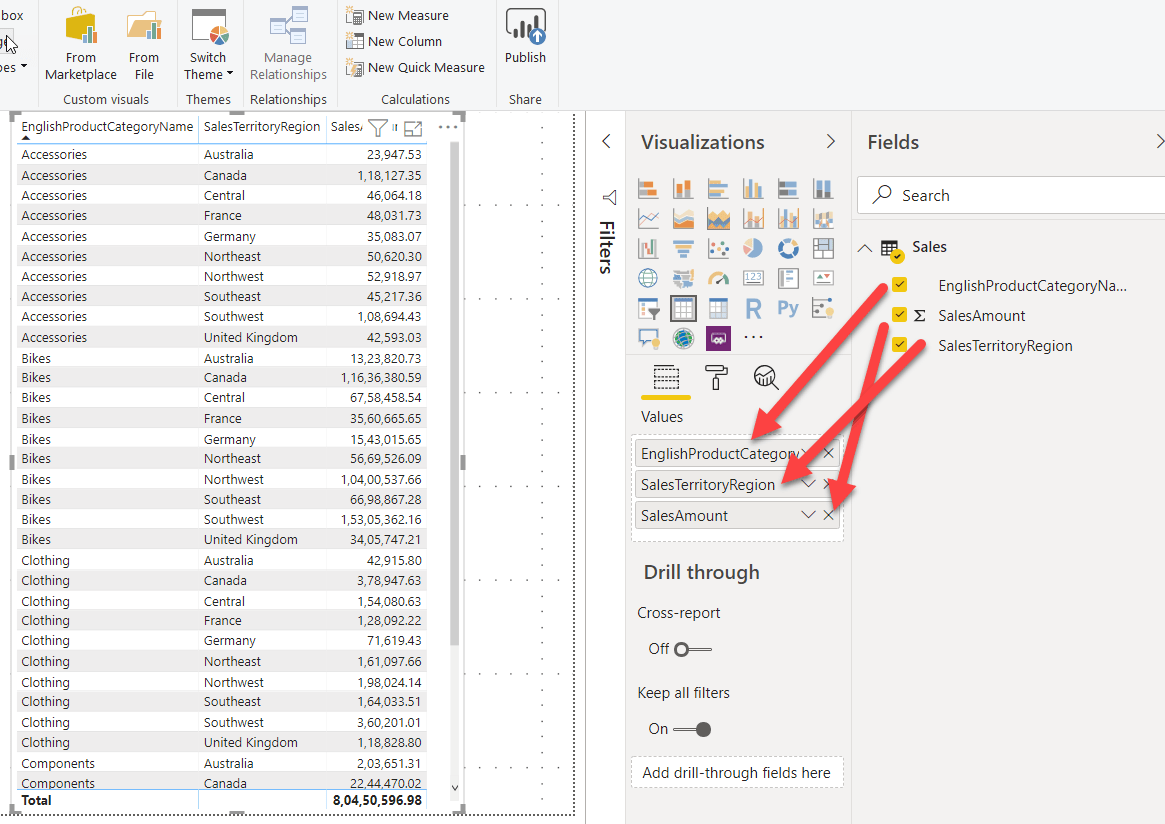
As you can see, we have the SalesAmount by EnglishProductCategoryName and the SalesTerritoryRegion. Now, we would like to analyze the highest-selling category in each region. For this, we would need to group all the categories by the region and then calculate the maximum sales.
Step 2 - Group the records using AllRows on the desired group level
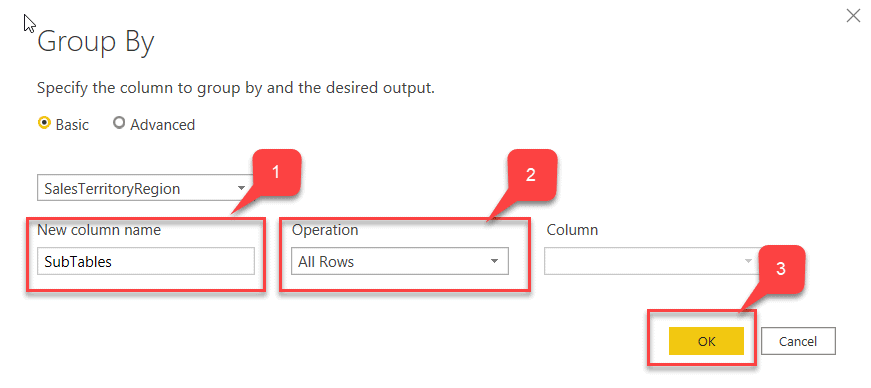
In this step, we will group the dataset on the desired level. Since we need to find the highest-selling category in every territory, we'll group by "SalesTerritoryRegion" and select the operation as "All Rows". This will create an additional column of sub-tables that'll contain the data for all the categories in that specific region.
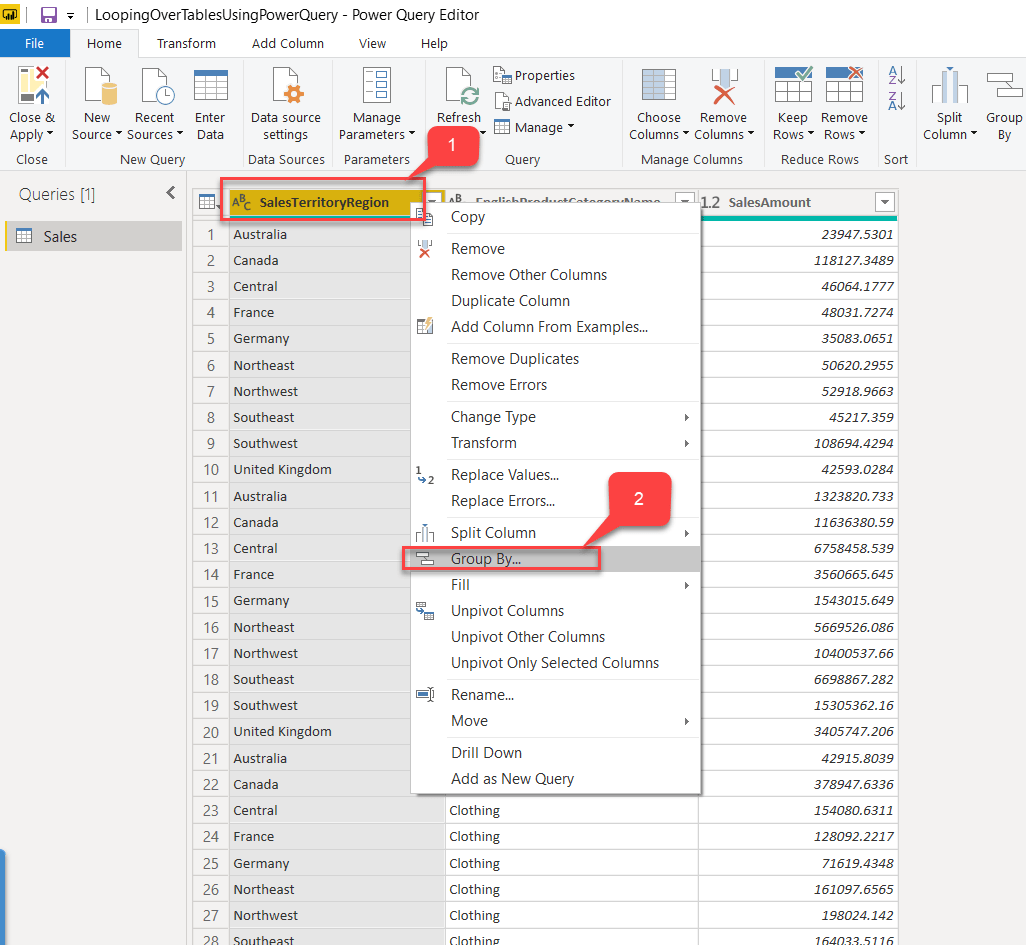
- Open the Power Query Editor window.
- Right-click on SalesTerritoryRegion and select Group By.

Fig 4 - Group By SalesTerritoryRegion - Enter the New Column Name as "SubTables".
- Select Operation as "All Rows" and click OK.
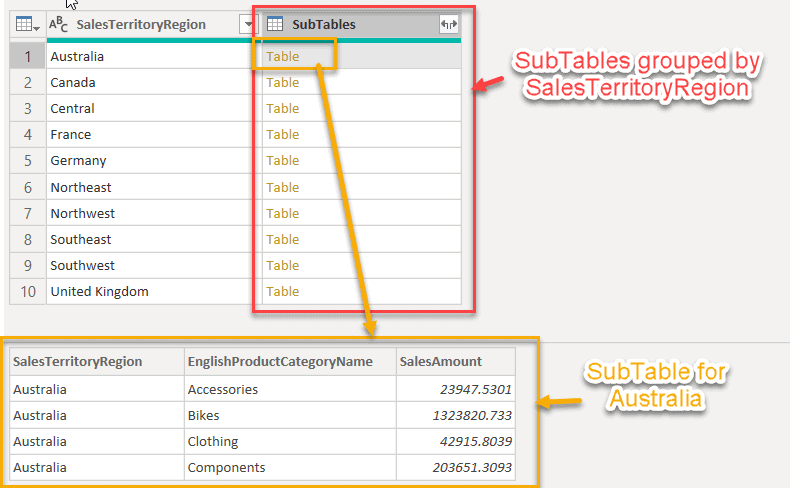
Fig 5 - Group By Configuration - Now, you can see that the SalesTerritoryRegion column has been grouped and a new column "SubTables" has been added.
Fig 6 - SubTables column added - In the figure above, when we select the table for Australia, the detailed data is shown in the subtable below (highlighted in yellow). Also, we can see that for Australia, the "Bikes" was the highest-selling category with SalesAmount of over 1M. Similarly, you can select the tables for other SalesTerritoryRegion and the detailed data will be displayed in the section below.
Step 3 - Apply formulas/functions over the tables
In this step, we'll be using two nested formulas to sort the detailed tables and then rank them in that order. The ultimate idea is to sort the subtables in descending order of the SalesAmount and then add an index column that'll store the rank value of the row. Let's go ahead and sort the subtables first, following which we'll add the index column.
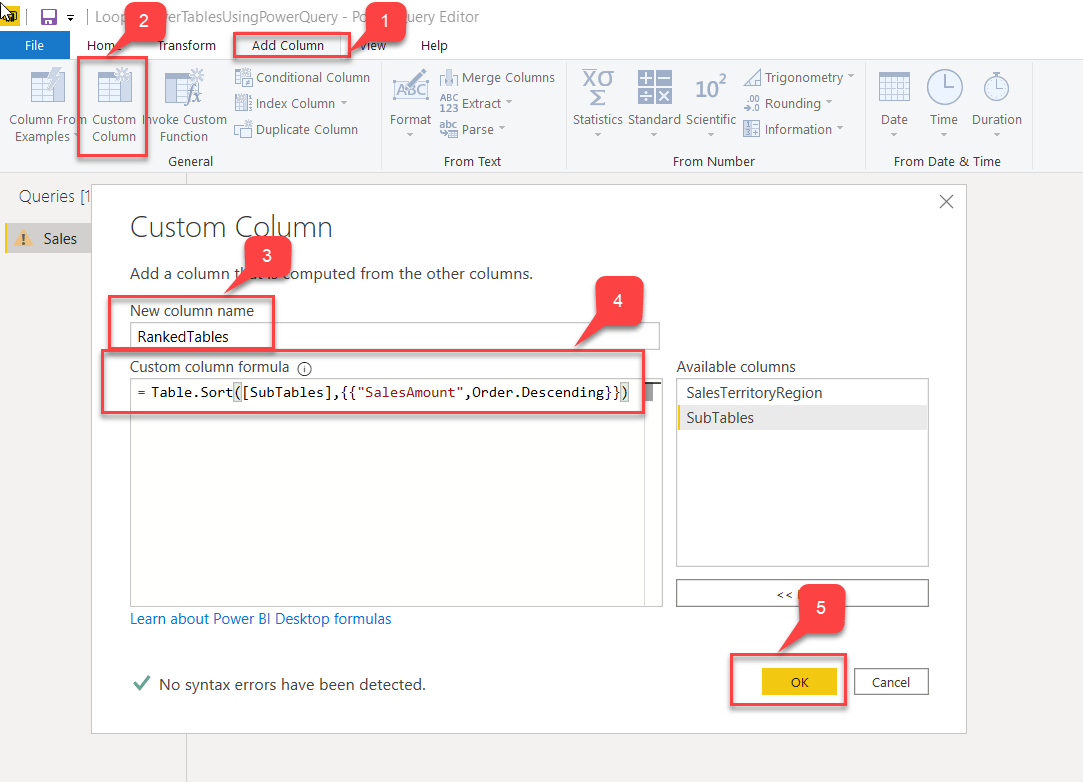
- From the Menu Bar, select Add Column and then select Custom Column.
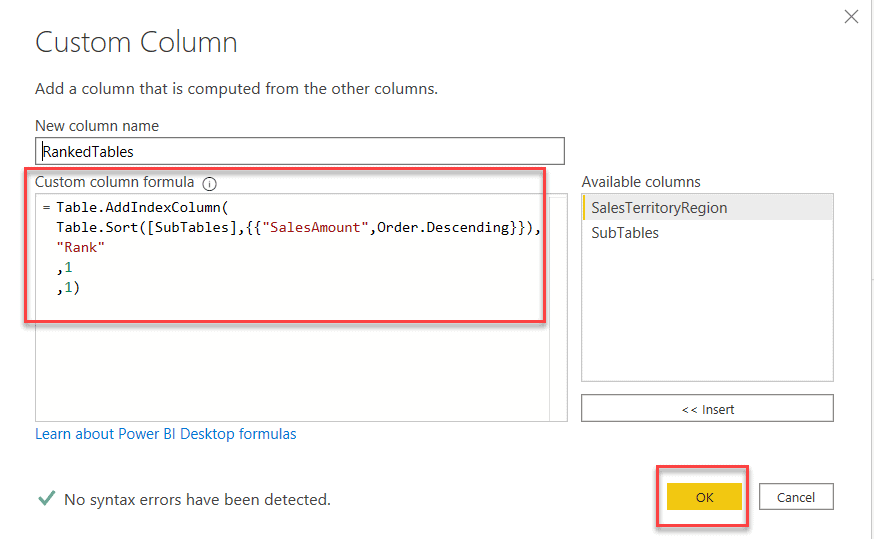
- The Custom Column dialog appears. Enter the new column name.
- Enter the custom column formula. Since we are going to sort the table by descending order of SalesAmount, we'll use the script below. The Table.Sort() function accepts two arguments - the table as the first argument and the sorting criteria as the second.
Table.Sort([SubTables],{{"SalesAmount",Order.Descending}}) - Click OK once done.
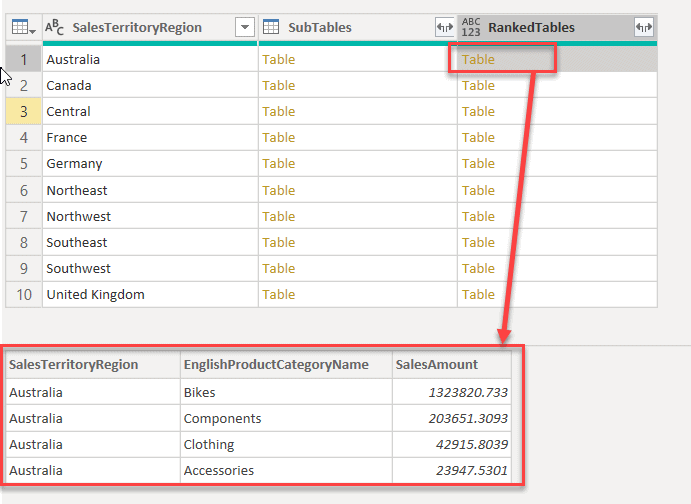
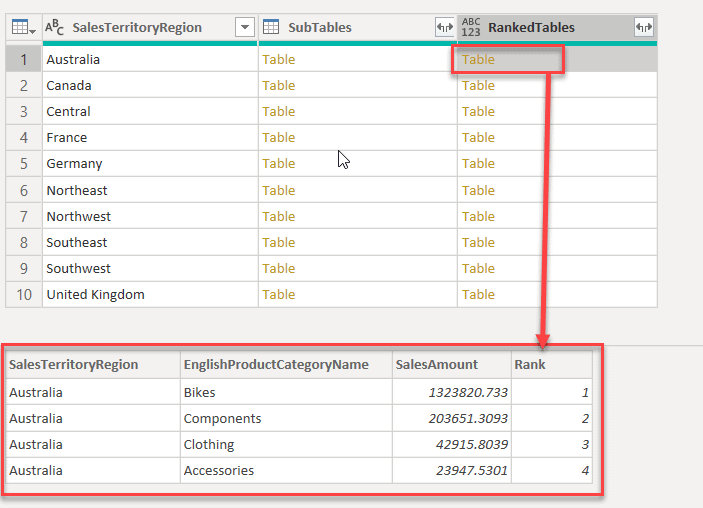
Fig 6 - Sorting by SalesAmount - Notice the new column "RankedTables" has been added. When you select the table now (highlighted in red), notice that the detailed dataset is already sorted in descending order based on the SalesAmount.
Fig 7 - RankedTables column added - Once the column is sorted, the next step is to add the index column on top of the existing sorting function. This will be a nested function. The script for this step is as below.
Table.AddIndexColumn(
Table.Sort([SubTables],{{"SalesAmount",Order.Descending}}),
"Rank"
,1
,1)?
Fig 8 - Add Index Column - Now, you can see an additional column "Rank" in the detailed dataset.
Fig 9 - Added Rank Column - The Table.AddIndexColumn() accepts the following arguments:
- Table - The table on which the index is to be applied.
- New Column Name - The name of the indexed column that'll be created.
- Starting Number - This is the starting number of the index.
- Increment - Defines by how much the index value should change for every subsequent row.
Step 4 - Expanding the resultset
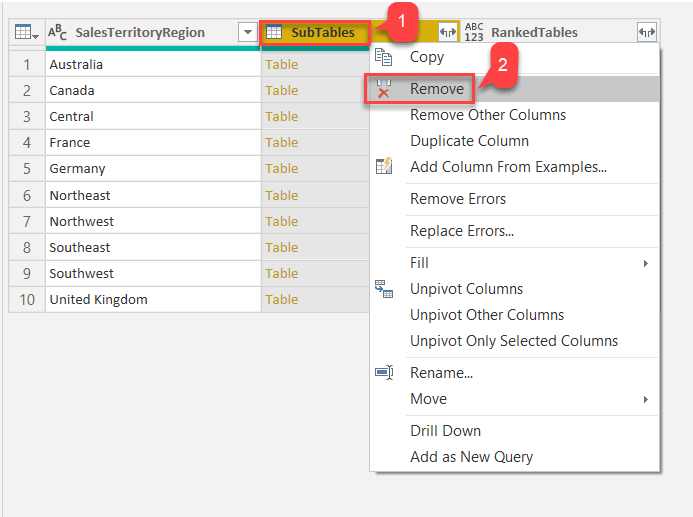
This is perhaps the most easiest step in the entire article. We just need to expand the subtables, remove additional columns and filter that resultset such that rows with rank = 1 are only displayed.
- Right-click on the SubTables column and select Remove.
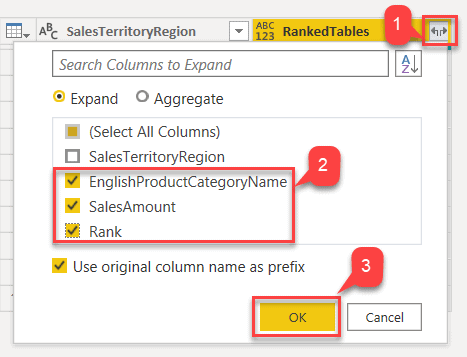
Fig 10 - Removing SubTables column - Click on the Expand button on the column, RankedTables.
- Select the columns as in the figure below and click OK.
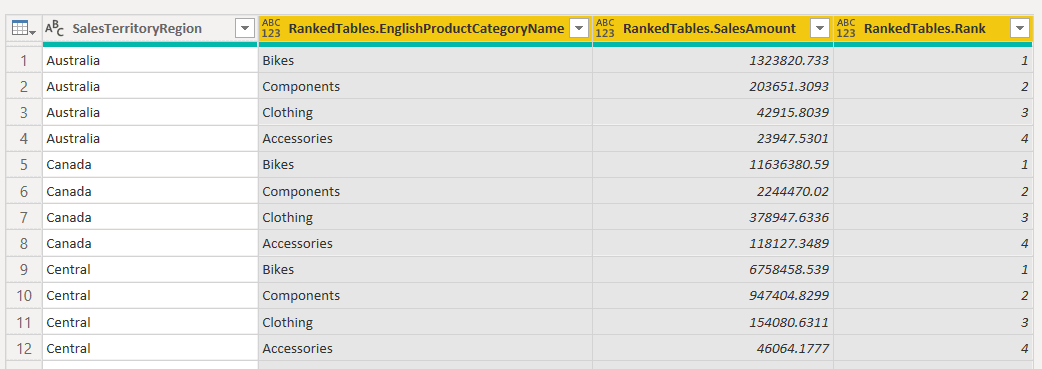
Fig 11 - Expanding Ranked Tables Filter - Notice that the subtable RankedTables has now been expanded, and we have all the data in the same resultset.
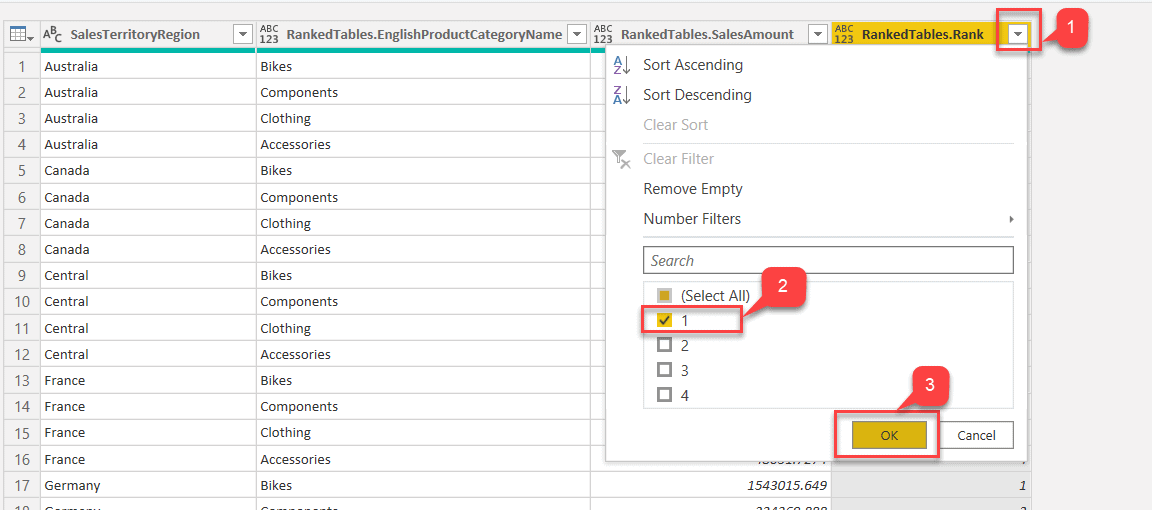
Fig 12 - Expanded Ranked Tables - Next, we need to filter the rows with rank values are 1 and eliminate the rest. Click the arrow on the right-hand side for RankedTables.Rank.
- Select 1 and deselect all the rest and click OK.
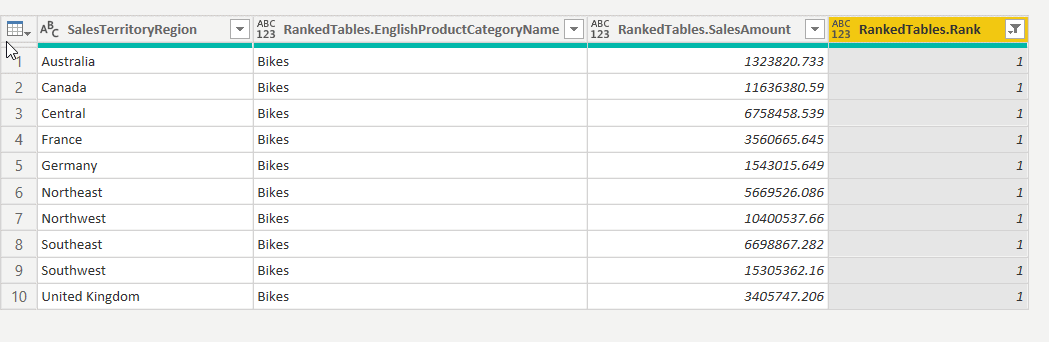
Fig 13 - Filtering Rank Values - Now, that the rank is filtered, we have the highest-selling ProductCategories for each SalesTerritoryRegion. It is evident that the category, Bikes, has the highest sales across any SalesTerritoryRegion.
Fig 14 - Final Dataset
Conclusion
In this article, we have seen how can we loop over a number of subtables and fetch the highest-selling category across various sales territories. Although this is a simple example, the same logic can be implemented on a dataset with over 1M records and it will still work the same. You can download the Power BI sample file here.
The next step would be to learn more about the table functions in Power Query.
