The series so far:
- Creating Calculated Columns Using DAX
- Creating Measures Using DAX
- Using the DAX Calculate and Values Functions
- Using the FILTER Function in DAX
- Cracking DAX – the EARLIER and RANKX Functions
- Using Calendars and Dates in Power BI
- Creating Time-Intelligence Functions in DAX
Creating and using a calendar table is pretty straightforward, but this article will explain not just how to create a table, but also why you should want to do this. The article will also answer questions such as: what happens if you have two or more dates in the same table that you want to reference? Or if you have another table which holds information at a different level of granularity? Or if you want to report sales by bank holidays? Read on for how to create a robust data model for handling time-based data!
Loading the Sample Data for this Article
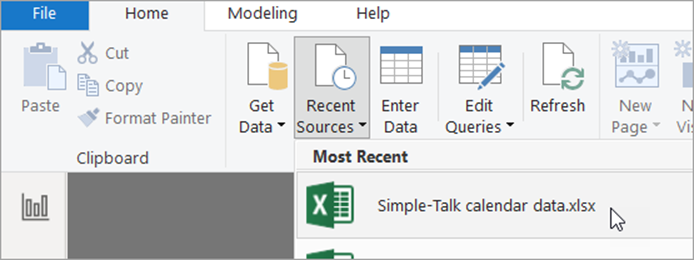
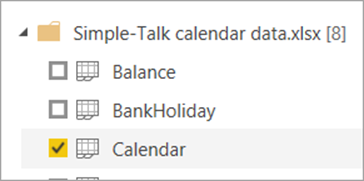
To work through the examples in this article, you’ll need to download the worksheets from this workbook. Tick all of the worksheets when you’re loading data into a new Power BI report:
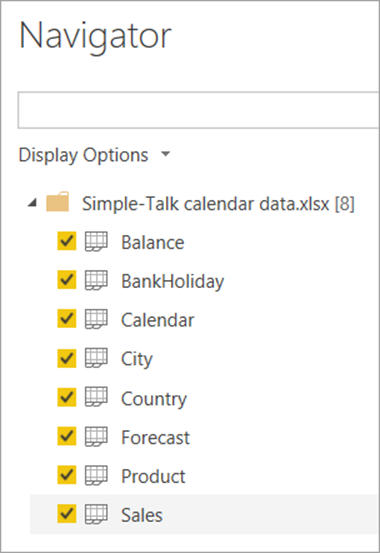
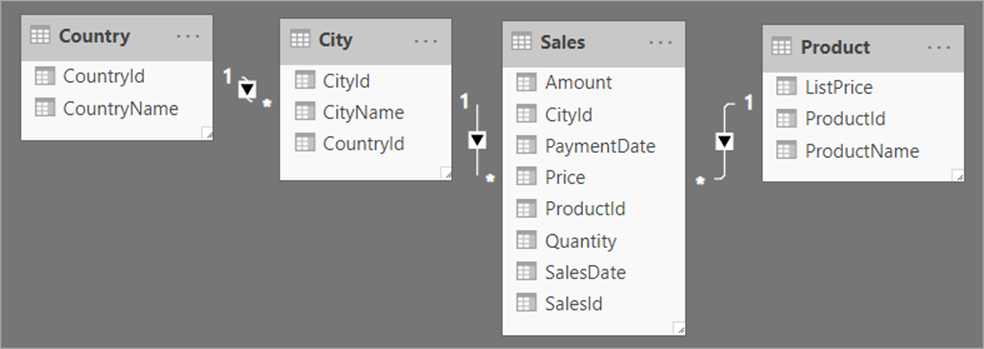
These tables will give you the following data model:
In addition, you should have the following four tables which aren’t linked:
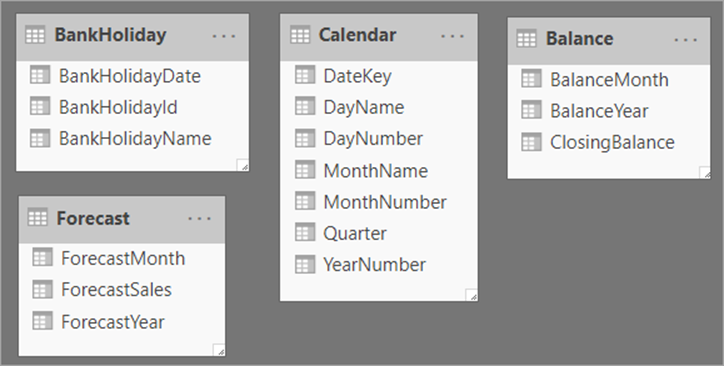
You’ll be using some of these tables in what follows, and some in the next article in the series.
Why Do You Need to Create a Calendar?
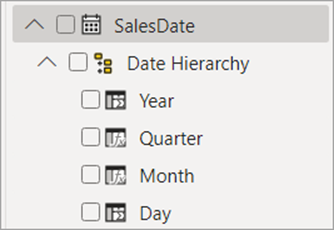
When I was first learning Power BI (actually, it was PowerPivot in those days, those many moons ago), I didn’t initially see the point of calendars. After all, Power BI allows you to include fields from date hierarchies which are created automatically for you:
However, having a calendar table gives two big advantages:
- It allows you to aggregate data by non-standard columns (think your company’s financial year, or your timesheet weeks, or the Mayan calendar!).
- It gives you access to all of the wonderful time-intelligence functions in DAX, with names like
TOTALYTDandCLOSINGBALANCE. Without a calendar table these won’t work.
Given that most people’s main interest in creating measures in DAX is to compare numbers across time periods, the second point is a bit of a clincher!
The Requirements for a Calendar
What should a calendar table in Power BI look like? Here’s an example:
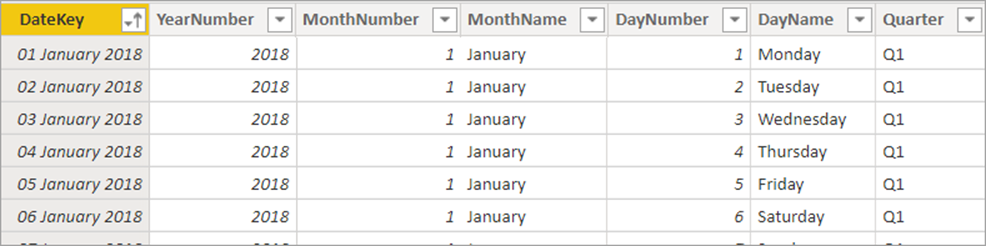
Thus, a calendar table should include one row for each date in your model in which you might be interested. In the example above, the table consists of all the dates in 2018, 2019 and 2020, since this is the lifespan of the transactions in the Sales worksheet. In addition, each date row should have a primary key (a unique field which tells you the date you’re looking at). This doesn’t have to be a date; you could use a separate numeric field instead. However, since dates are stored internally as numbers, I can’t see any reason not to use a date column as your primary key, as above.
Creating a Calendar in DAX
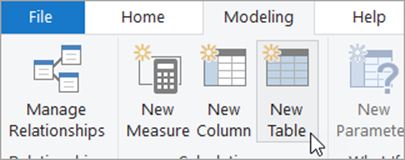
DAX contains a couple of functions which will auto-generate a calendar table for you (this sounds like a good idea, but probably isn’t – read on). One of these is the CALENDARAUTO function. To use this, click on the following tool found on the Modeling tab to create a new table:
Type in a name for your table. Here I’ve called mine My calendar. Then use the CALENDARAUTO function to say what it will contain:
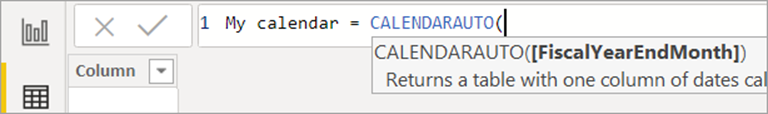
In this case, just assume that the fiscal year ends in December. You could leave out the argument 12, since December – month 12 – is the default anyway:
|
1 |
My calendar = CALENDARAUTO(12) |
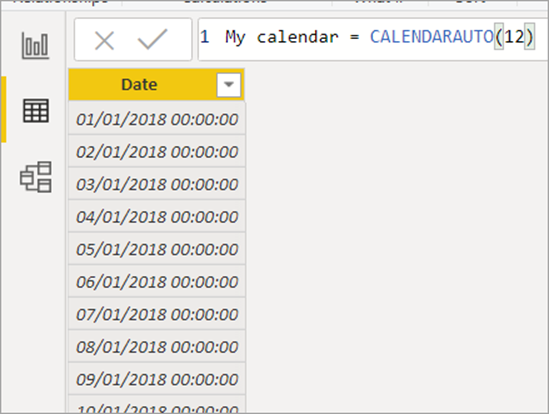
When you confirm, you’ll see that this formula Power BI will create a set of dates going from the first date it finds in your data model to the last. In this example the first date is 10th February 2018 and the last date is 8th January 2020. Because the financial year ends in December, the function will generate a table containing all the dates for the months January through to December for the years 2018, 2019 and 2020:
This was all very quick, but also not that useful, as you’re now going to have to add columns giving the year, month, quarter and so on for each date AND then do the same thing for each model that you create.
A variation of the above is the CALENDAR function, which lets you specify a start and end date:
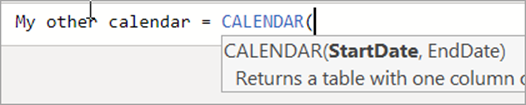
This works in exactly the same way (and suffers from the same drawbacks), but it does at least give you more control over which dates are generated.
Creating a Calendar in Excel
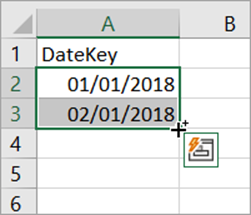
Another way to create a calendar is using an Excel spreadsheet. To do this, type in a column heading and the first couple of dates, and click and drag down using the black cross shown:
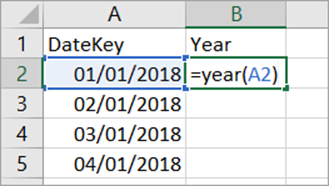
You can now add columns giving the year number, month number, etc. For example, for the year number:
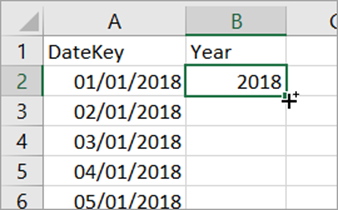
You could then double-click on this black cross to copy this formula down:
Here are some functions that you could use:
=YEAR(A2)– to get the year number, as above=MONTH(A2)– to get the month number, as above=TEXT(A2,"mmmm")– to get the month name=TEXT(A2,"mm - mmmm")– to get the month number/name=DAY(A2)– to get the day number=TEXT(A2,"dddd")– to get the day name="Q" & INT((MONTH(A2)+2)/3)– to get the quarter number
You could then save the Excel workbook (possibly pasting the formulae as values first) and use this as a source for your Power BI calendar table.
Creating a Calendar in SQL Server
If you’re using SQL Server, this is probably the best option. Here’s a sample procedure which you can adapt to generate one row for every date in a given range. It doesn’t claim to be that efficient (it uses cursors!), but you’re only going to have to run it once.
|
1 2 3 4 5 6 7 8 9 10 11 12 13 14 15 16 17 18 19 20 21 22 23 24 25 26 27 28 29 30 31 32 33 34 35 36 37 38 39 40 41 42 43 44 45 46 |
CREATE PROC spCreateCalendarTable ( @StartDate datetime = '20180101', @EndDate datetime = '20201231' ) AS -- create a table of dates for use in Power BI -- first get rid of any old versions of table DROP TABLE IF EXISTS tblCalendar -- create the table of dates CREATE TABLE tblCalendar( DateKey date PRIMARY KEY, YearNumber int, MonthNumber int, [MonthName] varchar(10), DayNumber int, [DayName] varchar(10), [Quarter] char(2) ) -- now add one date at a time DECLARE @i int = 0 DECLARE @curdate datetime = @StartDate WHILE @curdate <= @EndDate BEGIN -- add a record for this date --(could use FORMAT function if SQL Server 2012 or later) INSERT INTO tblCalendar ( DateKey, YearNumber, MonthNumber, [MonthName], DayNumber, [DayName], [Quarter] ) VALUES ( @curdate, Year(@curdate), Month(@curdate), DateName(m,@curdate), Day(@curdate), DateName(weekday,@curdate), -- the quarter number 'Q' + CAST(floor((month(@curdate)+2)/3) AS char(1)) ) -- increase iteration count and current date SET @i += 1 SET @curdate = DateAdd(day,1,@curdate) END |
Using a Calendar
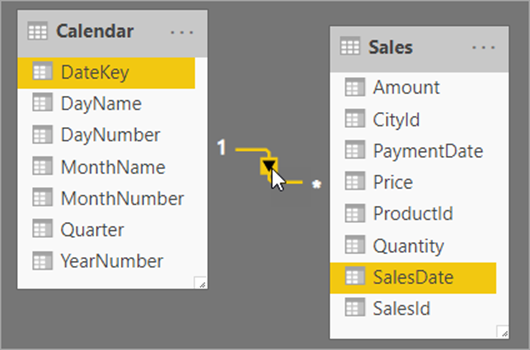
Once you’ve created a calendar, here’s how to use it. First load it into your data model (in this case, it was loaded with the Excel data), then link it to a date column. Here I’ve assumed that you want to analyse sales by the sale date and not the payment date. Later in this article you’ll learn how to cope with the situation where you have two or more dates in a table.
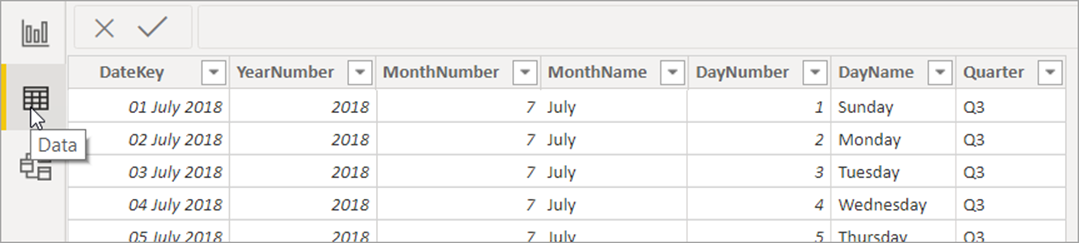
You now need to tell Power BI that the Calendar table is … a calendar table! To do this, make sure you’re looking at the calendar table in Data view:
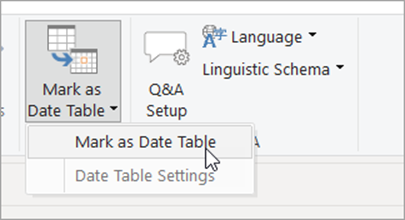
On the Modeling tab, choose to mark this as a calendar table:
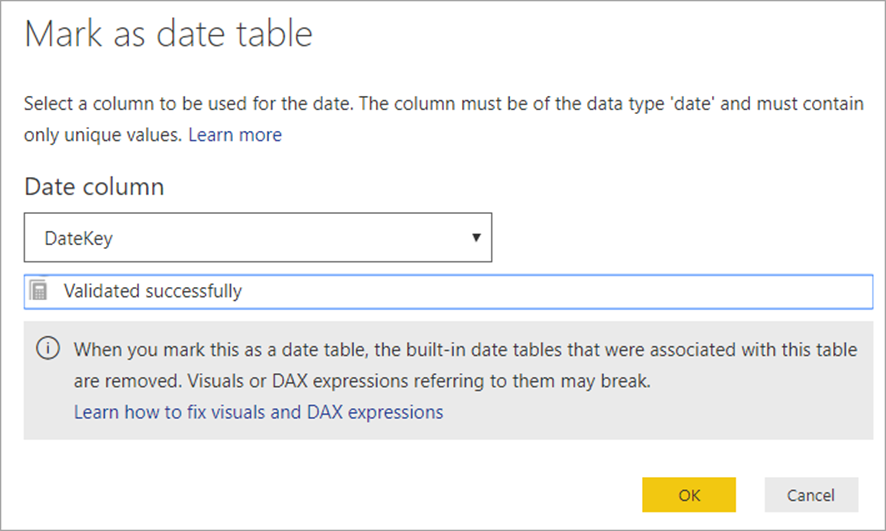
Choose the column which uniquely identifies each date, then choose OK:
The only problem with all of this is that I’m not convinced it’s necessary! It certainly can’t do any harm, but my understanding is that if you’ve chosen a date column as your primary key, DAX time-intelligence functions will work even if you omit this step.
Fine-tuning Your Calendar Table
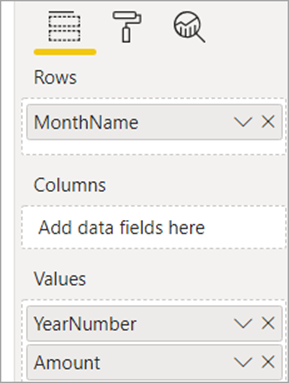
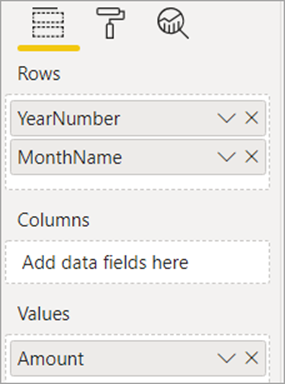
To see the Calendar table in action, create a matrix based upon your calendar, using these fields:
You’ll get something like this:
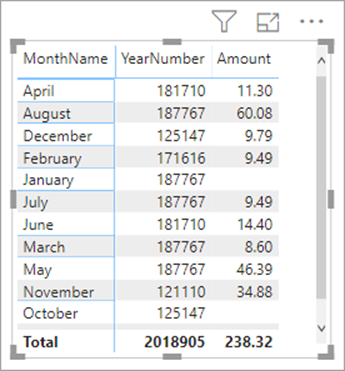
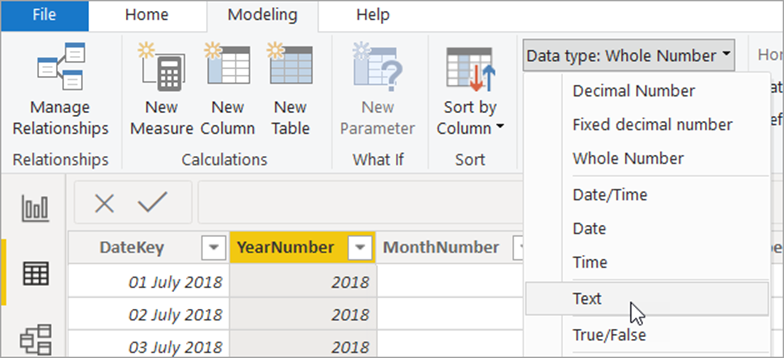
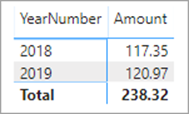
There are two problems here: Power BI has assumed that the year number is an integer which needs summing, and it has also assumed that the month name is text which can be sorted alphabetically. There are other solutions to both problems, but the simplest ones are as follows. First, change the year number to a text column:
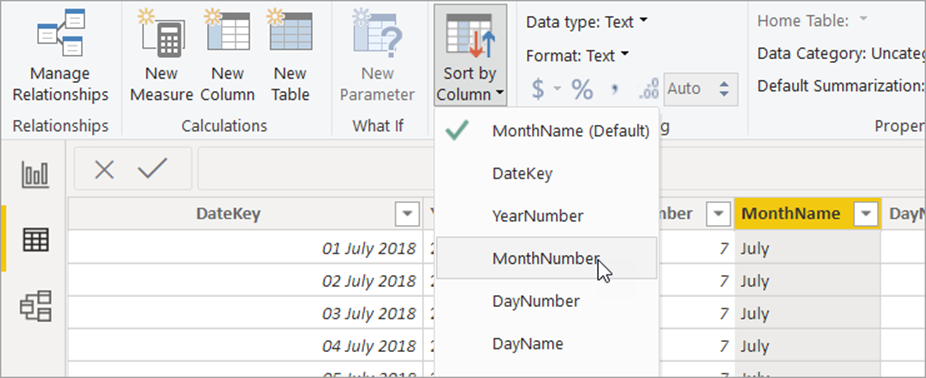
Secondly, with the month name column selected, choose to sort it by month number:
You can now create a matrix with these fields:
To get this visual:
Note that instead of the visual shown above, you may get something like this one:
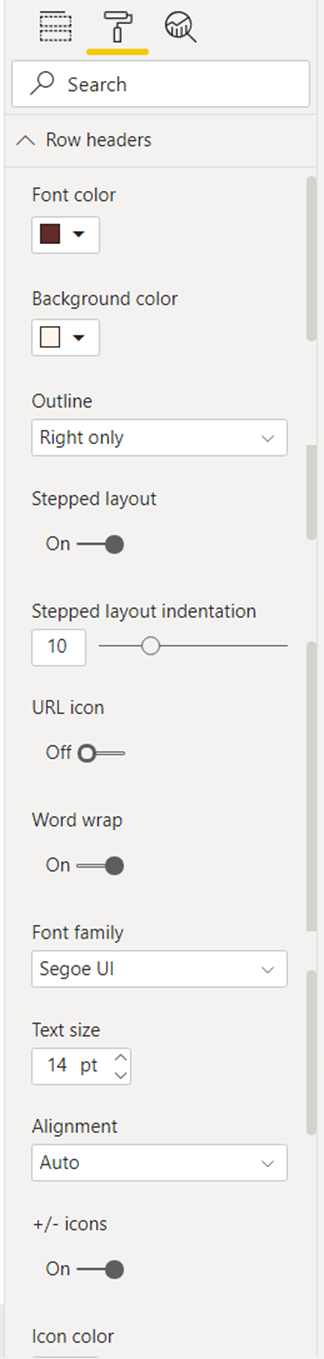
In this case, try finding and setting the +/-icons settings for your matrix in the Row headers card, to enable you to expand and collapse rows:
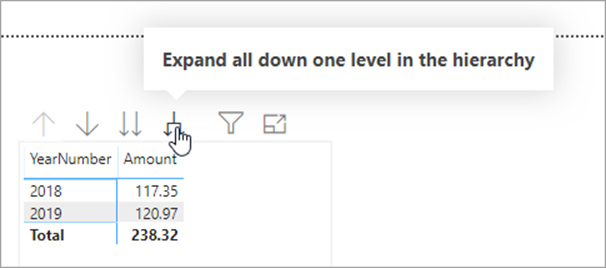
If you don’t have this property, it may be that you’re using an older version of Power BI, in which case, drill down to show all the levels of detail for your matrix:
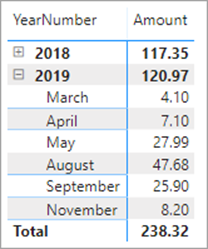
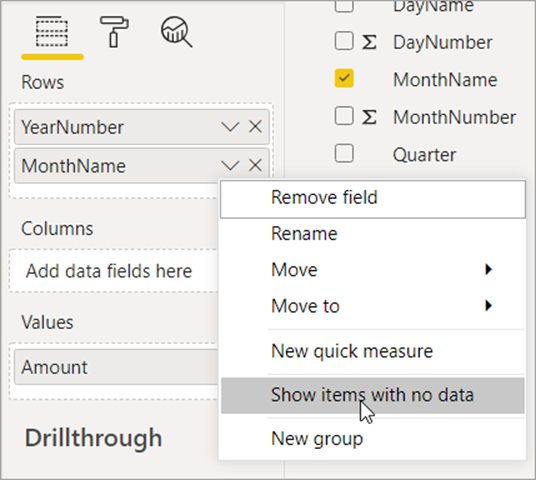
As one final touch, it would be nice to have all of the months appearing, so choose to show items with no date by clicking on the drop arrow next to the MonthName column:
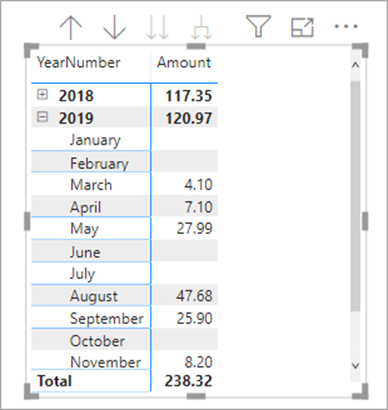
And finally, you’ll see the perfect matrix!
Dealing with Different Levels of Granularity
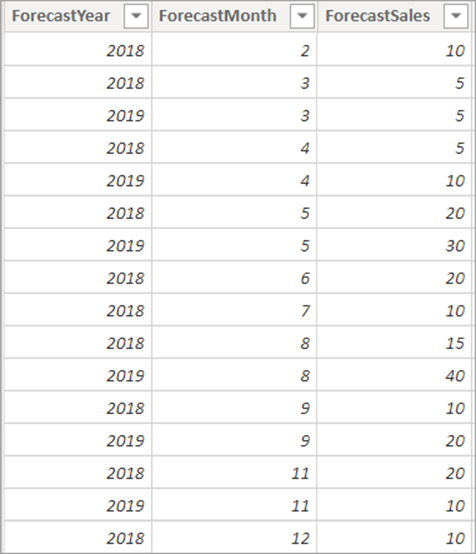
Suppose now that you want to compare actual and forecast sales which is a common enough requirement. This should be easy – you already have a table of monthly forecasts for sales:
However, these forecasts are by month and the Calendar table is by date. The easiest solution is to create another column which arbitrarily assigns each forecast to the first day of the month in which it occurs:
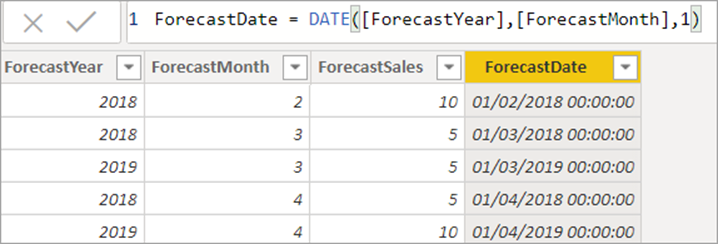
Here’s the formula used:
|
1 |
ForecastDate = DATE([ForecastYear],[ForecastMonth],1) |
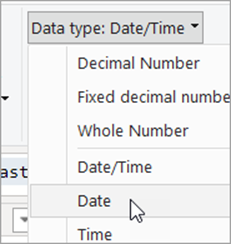
It’s probably a good idea to narrow the data type for this column from Date/Time to just Date:
You can now create a relationship between this new forecast date column and the calendar’s date key column:
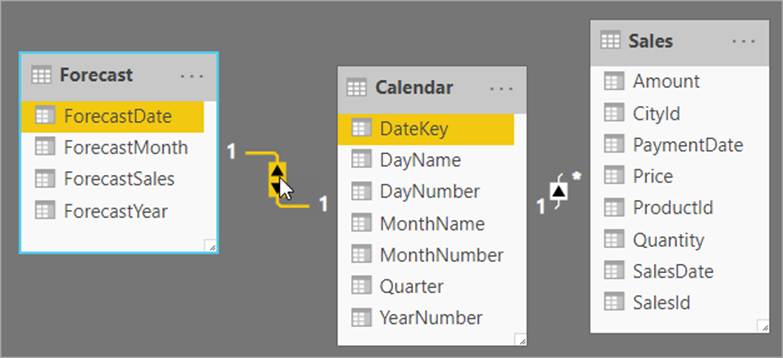
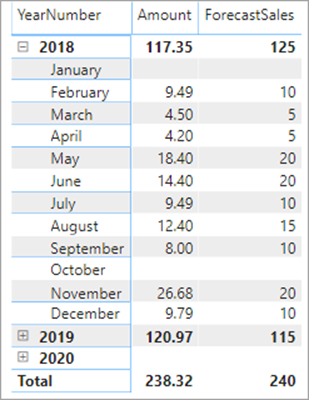
This will enable you to compare actual and forecast data at any level of granularity down to month:
Note that you’ll obviously have to be careful not to drill down to day level, since the forecast sales have been arbitrarily assigned to the first day in each calendar month and the results would be misleading.
Creating New Aggregator Columns (Like Bank Holidays)
Readers outside the UK will need to know that a bank holiday is a day which is treated like a Saturday or Sunday (that is, you don’t have to go to work); there are about 10 of them each year, including Christmas Day, Boxing Day, New Year’s Day, etc. The solution divides sales into working and non-working days where a non-working day is either a Saturday, a Sunday or a bank holiday. To do this, create some new columns in the Calendar table.
Note that you can use this principle to report by any type of date: examples could include periods when you’re offering a discount to customers, timesheet weeks, times of the day when shops are open, etc.
Although you could just create a complicated single column, to make things easier to understand – and to work with – you’ll create three:
- A column saying whether this is a weekend or not.
- A column saying whether this is a bank holiday or not.
- A column combining these two conditions.
To do the first, use the WEEKDAY function, but tweak the second argument so that it returns 6 for Saturday or 7 for Sunday:
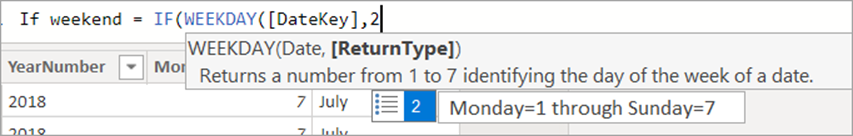
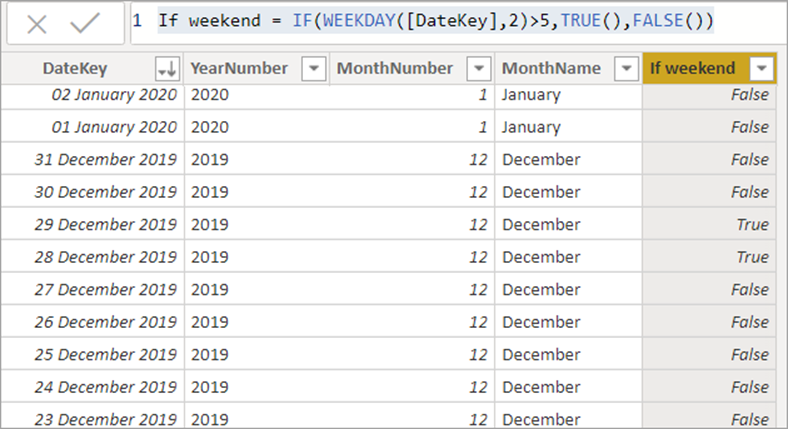
So the full calculated column will be:
|
1 |
If weekend = IF(WEEKDAY([DateKey],2)>5,TRUE(),FALSE()) |
You could use the shorter form, if you’re comfortable with Boolean algebra!
|
1 |
If weekend = (WEEKDAY([DateKey],2)>5) |
This shows, for example, that Christmas Day 2019 was on a Wednesday (that is, 3 days before the next weekend started):
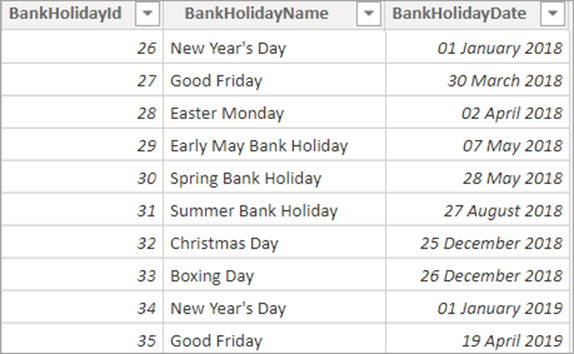
To say whether a day is a bank holiday, for example, you should first create and load a table of bank holidays (or use the one supplied in this article’s Excel workbook):
Now create a one-to-one relationship between the two tables:
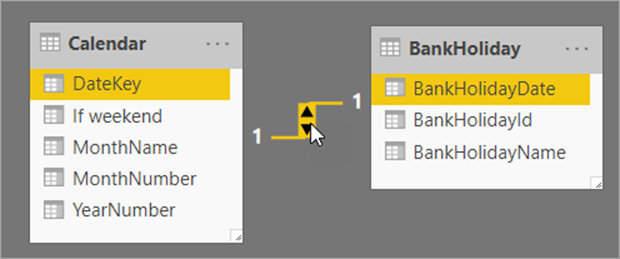
It’s created as one-to-one automatically because the DateKey is unique in the Calendar table, but the BankHolidayDate column is also unique in the bank holidays table too.
You can now create another calculated column in the Calendar table:
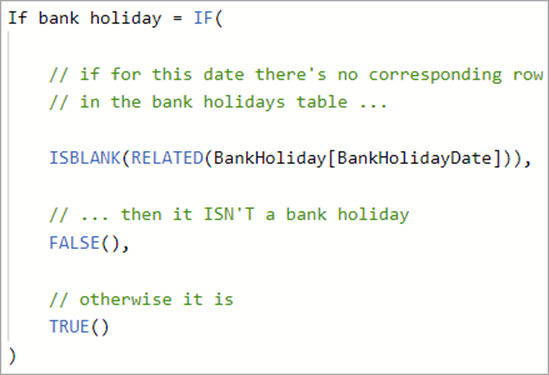
Here’s the code used, for copying:
|
1 2 3 4 5 6 7 8 9 10 |
If bank holiday = IF( // if for this date there's no corresponding row // in the bank holidays table ... ISBLANK(RELATED(BankHoliday[BankHolidayDate])), // ... then it ISN'T a bank holiday FALSE(), // otherwise it is TRUE() ) |
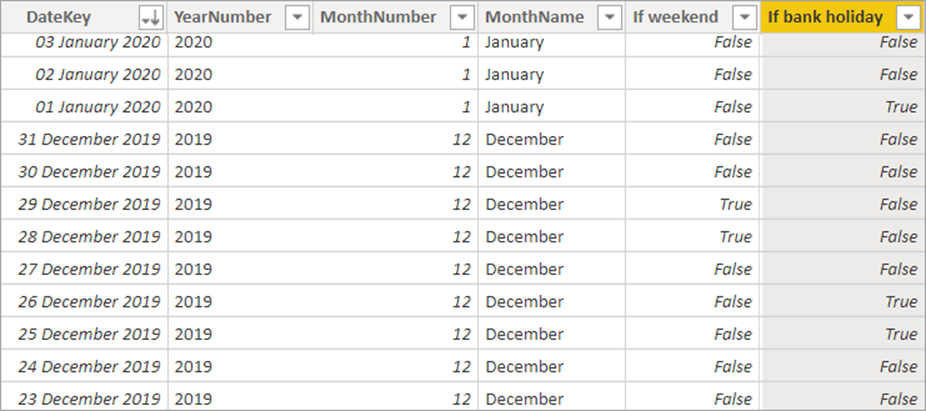
This shows that Christmas Day 2019 was a bank holiday as expected:
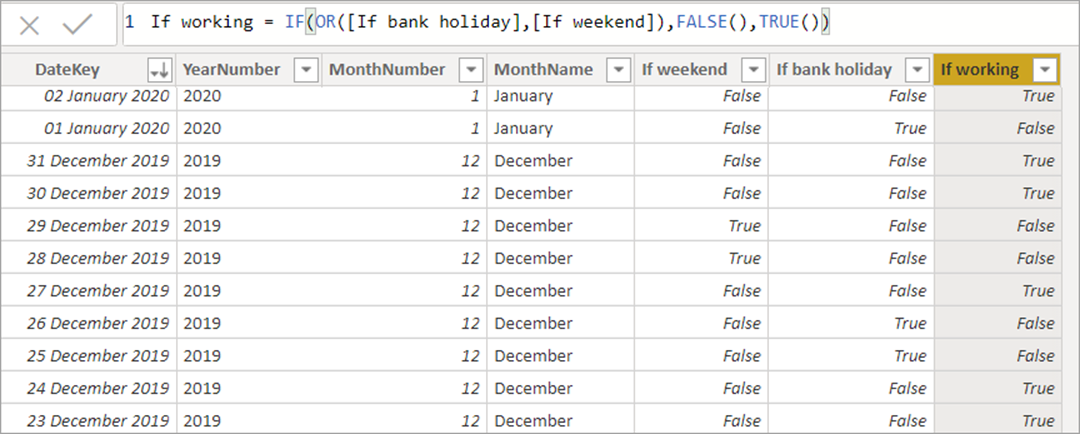
You could now combine the two conditions to get the status of any day:
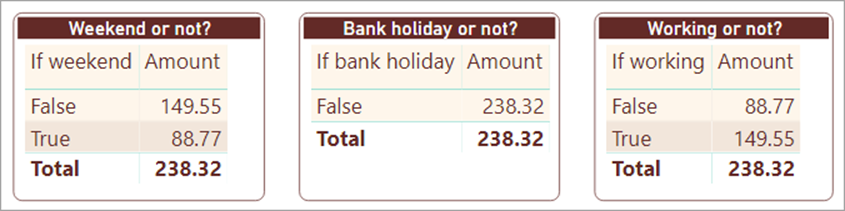
This method will allow you to create reports dividing sales into working and not-working days, although the results aren’t that exciting because as it happens no sales were made on a bank holiday:
Handling Multiple Dates
How do you cope when (as is nearly always the case in the real world) a table has two or more dates? For this example, how could you create a visual comparing the month of purchase with the month of payment? There are two ways. One way is to have multiple relationships between the same tables and specify in your measures which one you want to reference:
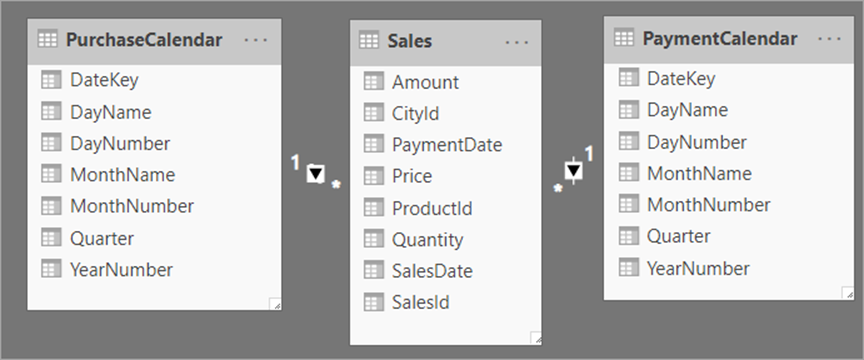
The second method is to use multiple versions of the calendar table:
Which solution you prefer will tell you a bit about what sort of person you are – think of it as a simple personality test. If you’re the sort of person who likes technology for its own sake, you’ll probably prefer the first solution: you’ll like the fact that you’re not storing the calendar table more than once, and you’ll be prepared to sacrifice a bit of ease of use. If on the other hand, you’re the sort of person who likes technology solely as a means to an end, you’ll probably prefer the second solution. Even though it involves holding multiple copies of the calendar table, the resulting model is easier to work with.
The Wise Owl Recommendation
If you’re interested, I prefer the second method (but then I do work for a training company, so by temperament am likely to want to make things as easy to use as possible). However, it doesn’t make you a bad person if you prefer the first method – just different to me.
Both methods are shown under separate headings below. I’ll begin with the multiple table approach since it’s easier to understand and is probably the one that most people will use.
Multiple Tables for Multiple Dates
For this method, start by renaming the first calendar table that you’ve imported. For the model below, the calendar table is linked to the SalesDate column (the date on which a purchase took place), so I’ve renamed the Calendar table to PurchaseCalendar to make it clear what’s going on. I’ve also removed some of the calendar columns to keep the table simple:
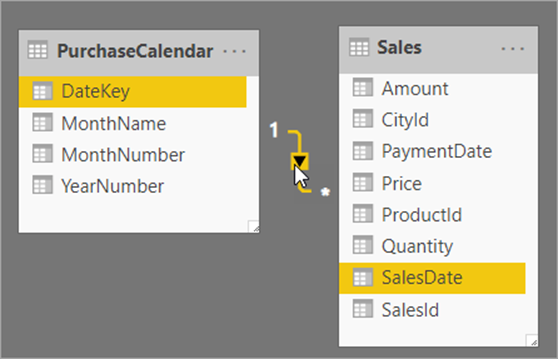
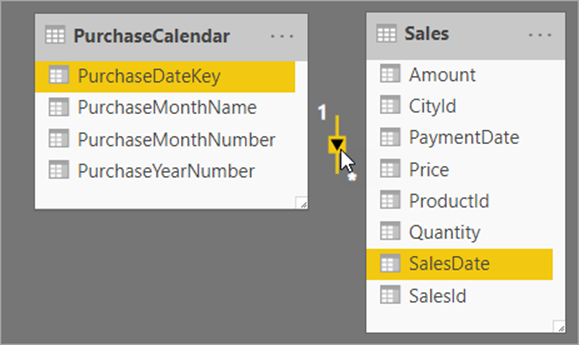
If you have the energy, it would probably be a good idea to rename each of the columns in this table too:
Now choose to load another version of the calendar table using your recent sources (the workbook or database from which you loaded the calendar table will be listed here):
Choose to import another version of the calendar table:
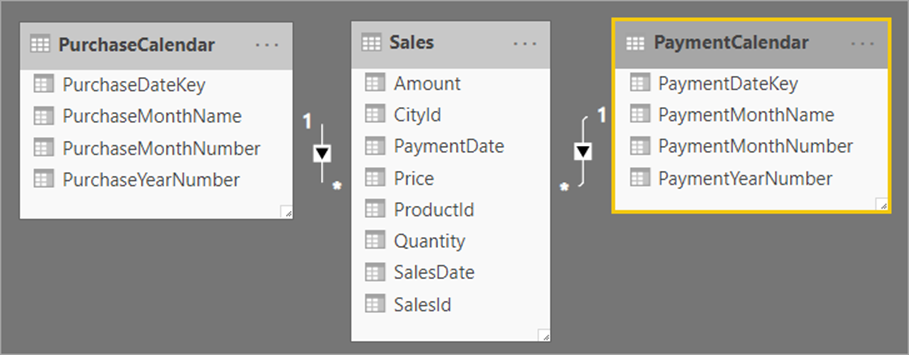
Drag this onto the same layout diagram, and create a relationship between the SalesData table and your recently loaded calendar table, but this time using the PaymentDate column as the link field:
Once again, you could now rename this version of the calendar table (and also rename the columns it contains) to make it clearer what’s what. In this example, I’ve also deleted some columns I don’t want:
There are two arguments you could make against this approach: that it wastes memory, and that it clutters up your model. Both are true. But it doesn’t waste that much memory. Each table stores about 1,000 dates, which is peanuts in today’s memory terms. It doesn’t have to clutter up your model if you use different tabs like this (one tab for each table containing multiple dates):
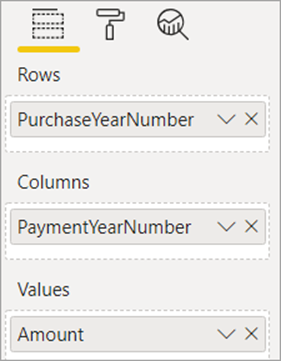
Having loaded all of your calendar tables and created the necessary relationships, you could use your model to create a matrix like this, showing the lag between purchases made and payments received:
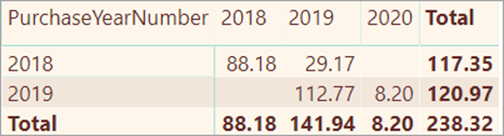
Here’s what the fields for this visual look like:
Although the extra table is a bit messy, it does mean that you don’t have to create any additional measures: you can just drag fields into the field well as usual.
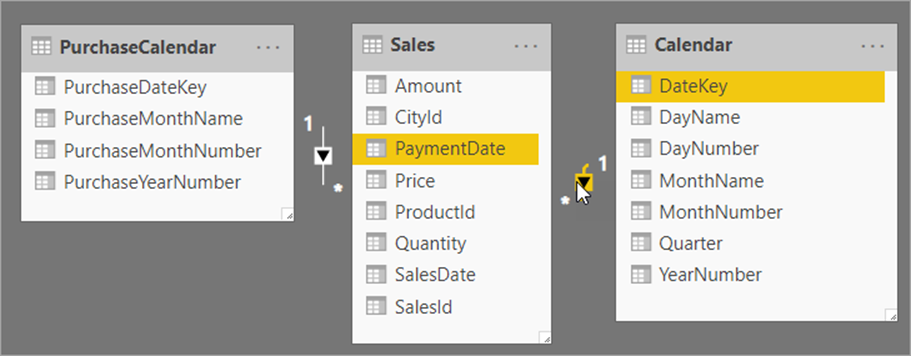
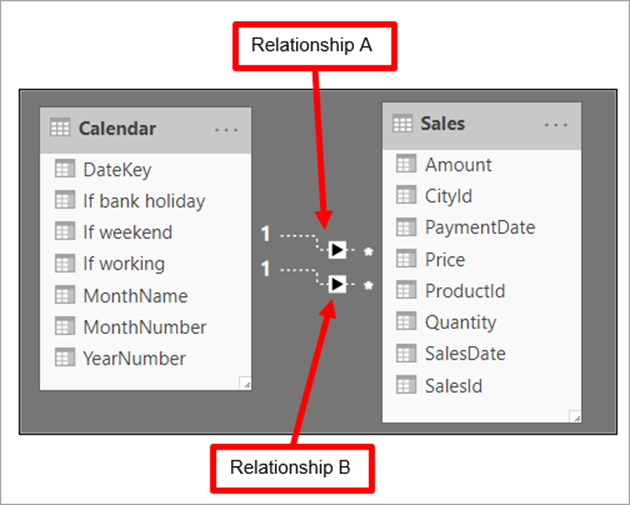
Multiple Relationships for Multiple Dates
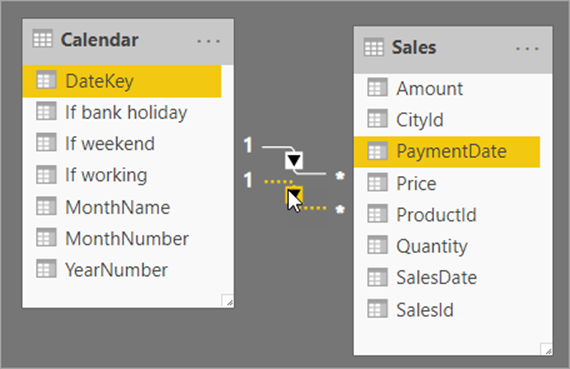
The alternative approach is to load one version of the calendar table, but create a second relationship:
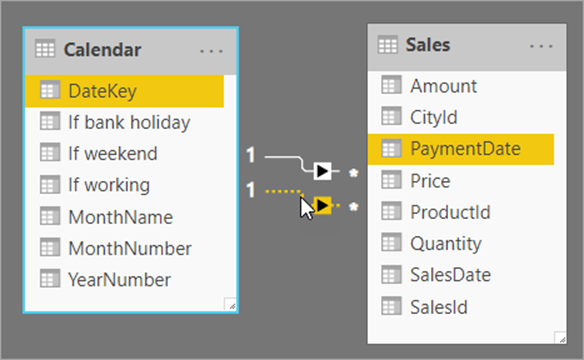
There are now two relationships:
- The active relationship (the one with the solid line) is between the DateKey column in the Calendar table and the SalesDate column in the Sales table
- The selected relationship above (the one with the dotted line) is between the DateKey column in the Calendar table and the PaymentDate column in the Sales table
You can change which is the active relationship by right-clicking on it and choosing to show its properties:
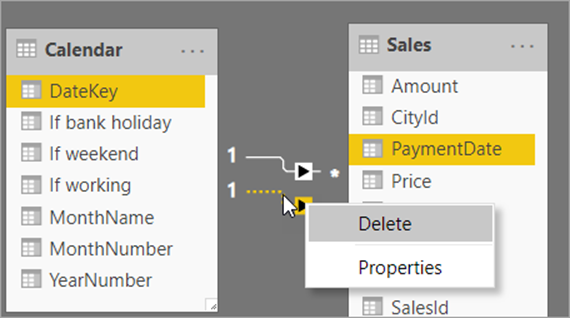
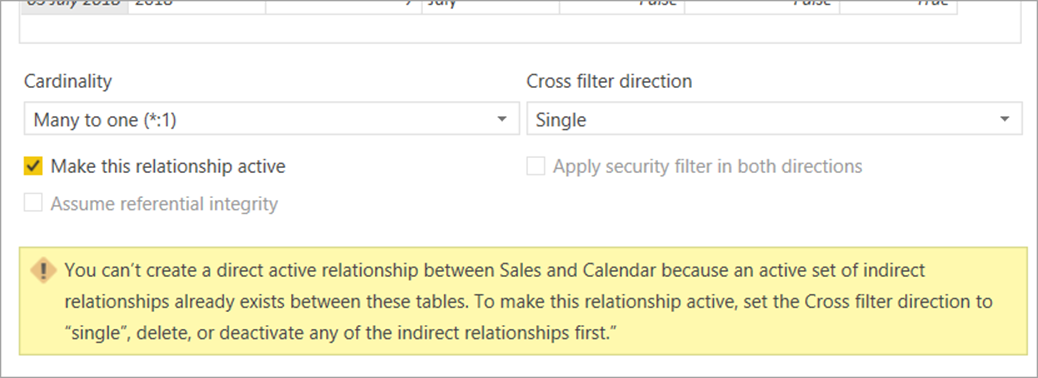
You can then tick the box to make a relationship the active one, but only after making all of the other relationships inactive first, as the following screenshot explains:
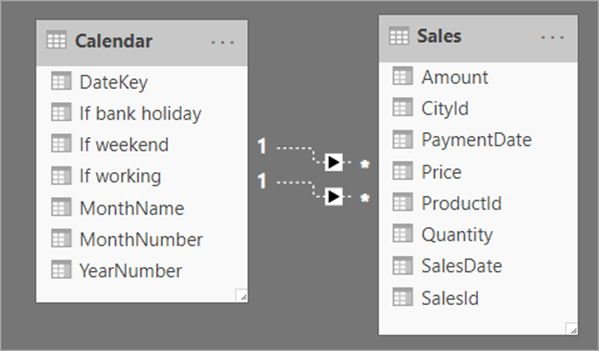
If you’re going to use multiple relationships, it may be a good idea to make all of them inactive. Then you won’t inadvertently create a measure referring to the wrong relationship by mistake:
What you now have to do is to create measures saying for any calculation to which table it should refer. For example, suppose you want to show for each year:
- The total sales made in that year; and
- The total sales paid for in that year.
To do this, create two measures using the USERELATIONSHIP function in each case. Here’s the first one:
|
1 2 3 4 5 6 7 |
Sales by date made = CALCULATE( SUM(Sales[Amount]), USERELATIONSHIP( 'Calendar'[DateKey], Sales[SalesDate] ) ) |
And here’s the second:
|
1 2 3 4 5 6 7 |
Sales by date paid = CALCULATE( SUM(Sales[Amount]), USERELATIONSHIP( 'Calendar'[DateKey], Sales[PaymentDate] ) ) |
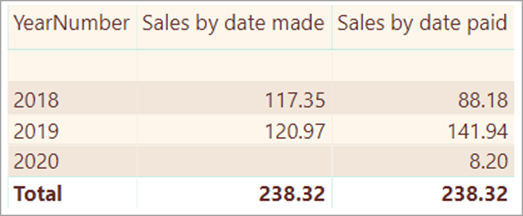
These measures will allow you to show the required figures:
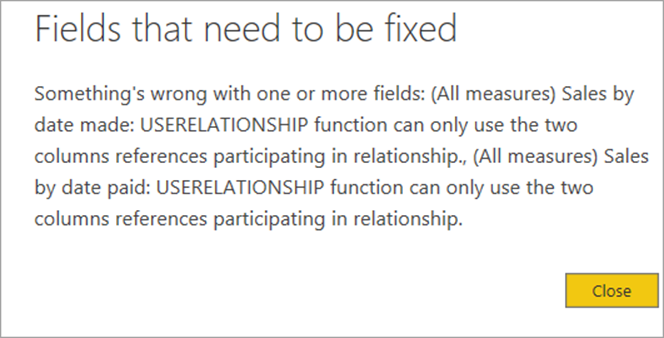
However, there’s no way that I can see to display an aged debtor matrix like the one created for the multiple table approach. It’s also a bit irritating that in the USERELATIONSHIP function that you have to specify the two columns that you’re joining together. It would be better if you could just specify which relationship you’re using. Something like this in fact:
You might also expect that because you are referencing the start column and end column of the relationship, you don’t need the relationship to actually exist, but you’d be wrong, as this error message which appears if you delete the above relationships shows:
And with that mild bit of whingeing, that’s the end of this article!
Conclusion
In this article, you’ve learned how and why you might want to create a calendar table in Power BI, how to use it to report on figures at different levels of granularity, how to add additional aggregator columns to the table and two different ways to cope with the situation where you have more than one date column in the same table. In the next and final article of this series, I’ll show how to use the calendar(s) that you’ve created to show things like year-to-date figures, cross-period comparisons and moving averages.

Load comments