One of the most significant challenges we face when analyzing data is pattern recognition. We seek to find ways in which our data deviates from the norm or conforms to a given norm. The goal is to identify tools that can be used to predict future behavior and make sense out of large volumes of data.
Understanding boundaries and where a pattern begins or ends allows us to draw meaningful conclusions regarding our data. In terms of data, boundaries are more often seen as gaps or islands within any data set. Being able to efficiently locate gaps and islands enables us to use this data to gain meaningful insight into a system. We can identify winning and losing streaks, measure the strength of a system over time, find missing or duplicate data, and a variety of other interesting metrics.
Defining Gaps and Islands
Within a data set, an island of data is any ordered sequence where each row is in close proximity to the rows around it. For some data types and analysis, “close proximity” will mean consecutive. Dates, integers, and letters of the alphabet can be ordered sequentially where two adjacent values will not be able to have additional values in between them.
For example, there are no dates between October 23rd and October 24th. Similarly, there are no integers between 17 and 18 and no English letters between E and F. For these examples, an island of data could be defined as a sequence of consecutive values. A gap can be defined as a sequence of missing values.
Without rounding or data modification, there are many data types for which “consecutive” has no meaning. Decimals can be ordered, but more can always be placed in between. 12.4 comes before 12.5, but the value 12.45 can be inserted in between. 5:25 occurs after 5:24, but there are many more granular times in between.
In theory, we can use the limits of precision on a data type to define what consecutive means, but this is typically impractical. More realistically, we will consider data points that are close together as sequential for the purposes of analysis. For example, two events that occur at 5:24 and 5:25 may be close enough in proximity that we may wish to highlight them as related. With knowledge of our data and how it works, we can easily make and test rules such as these.
A gap is defined as an absence of data in between islands. Gaps require islands and islands require gaps. For example, if we were evaluating a set of letters of the alphabet and found E, M, and P missing, we could structure a set of islands of this data as follows:
- A-D
- F-L
- N-O
- Q-Z
The alphabet has been divided up into 4 islands of data. The gaps (all comprised of single letters) are as follows:
- E
- M
- P
A data set with N islands of data must have N-1 gaps in between them. We will typically ignore the edges of the data set and not consider them gaps, even if there are missing values. Testing for specific missing values is a different exercise and not a part of gaps/islands analysis.
A key component to gaps/islands analysis is that the result set is dynamic. Mathematically, we are applying a clustering algorithm to our data, and for any data set, we may end up with a wide variety of results that range anywhere from:
- One giant island with no gaps.
- Lots of small islands surrounded by gaps.
- No islands, and one giant gap (an empty set).
If the list of gaps or islands is our result set, then its size and contents will vary organically based on the data we apply our analysis to. This provides flexibility and insight that may not be available via more rigid analysis.
Grouping Integers
The simplest example of what gaps and islands are is to create a list of sequential, nonrepeating integers:

When we consider this list, we note the numbers range from 1 to 15 and that there are no missing integers. These fifteen integers comprise one big island with zero gaps. Let’s remove some of the numbers from the data set above:
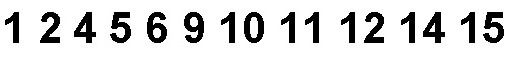
We have removed the numbers 3, 7, 8, and 13 from the list. If we were to perform a gaps/islands analysis on this data, we would find the following islands:
- 1-2
- 4-6
- 9-12
- 14-15
In between those islands would be the following gaps:
- 3
- 7-8
- 13
How do we solve this problem programmatically? We can model this simple data set in SQL Server like this:
|
1 2 3 4 5 6 |
CREATE TABLE dbo.integers (integer_id INT NOT NULL); INSERT INTO dbo.integers (integer_id) VALUES (1), (2), (4), (5), (6), (9), (10), (11), (12), (14), (15); |
One way to identify gaps is to observe the overall row count and compare it to the expected row count, assuming no gaps existed. Consider the following query and results:
|
1 2 3 4 |
SELECT integer_id, ROW_NUMBER() OVER (ORDER BY integer_id) AS rownum FROM dbo.integers; |
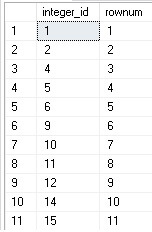
Note that the first column contains what should be an unbroken list of integers, assuming none are missing. The second column contains the row number, also ordered by the integer ID. The result is that we can compare the left column to the right and in any scenario in which the row number falls further behind our ID column, we know another value is missing. The details of what we do with the above numbers as as follows:
- When integer_id increases by more than rownum, that provides the start of an island.
- The prior row to the missing values is the end of the previous island.
- Add 1 to the end of the previous island to obtain the start of the gap.
- Subtract 1 from the start of the next island to obtain the end of the gap.
We can then use T-SQL to demonstrate how we can crunch the data above into a set of gaps or islands:
|
1 2 3 4 5 6 7 8 9 10 11 |
WITH CTE_ISLANDS AS ( SELECT integer_id, integer_id - ROW_NUMBER() OVER (ORDER BY integer_id) AS island_quantity FROM dbo.integers) SELECT MIN(integer_id) AS island_start, MAX(integer_id) AS island_end FROM CTE_ISLANDS GROUP BY island_quantity; |
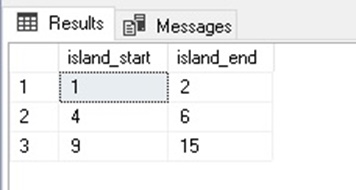
When we execute the above code, we get the following results:
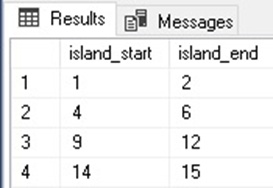
By subtracting the row number from the integer ID, we were able to determine the difference and knew that whenever that number increments, a new gap has been passed in the data set. The ROW_NUMBER window function provides a sequential numbering for our integer list, ranging from 1 to the number of integers in our list (11).
We can calculate gaps using the LEAD window function:
|
1 2 3 4 5 6 7 8 9 10 11 12 |
WITH CTE_GAPS AS ( SELECT integer_id, LEAD(integer_id) OVER (ORDER BY integer_id) as next_integer FROM dbo.integers ) SELECT integer_id + 1 AS gap_start, next_integer - 1 AS gap_end FROM CTE_GAPS WHERE next_integer <> integer_id + 1; |
By comparing the next expected integer ID with the actual next integer ID, we can determine when a gap will start and end. If the current integer is 6 and the next is 9, we immediately know that 7 and 8 are skipped and that there is an upcoming gap comprised of those two numbers.
There are many ways to calculate gaps and islands using a variety of window functions, subqueries, and CTE structures. Our goal in this article is to keep the T-SQL as simple as possible and avoid obfuscated or overly long code.
Managing Duplicates
Consider the following alteration to our data set above:
|
1 2 3 4 |
INSERT INTO dbo.integers (integer_id) VALUES (2), (12), (12), (13); |
If we run our islands query from earlier, we get the following results:
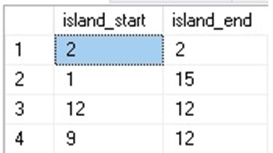
These results are nonsense, and we can see that the discrepancies introduced by duplicate values need to be dealt with in order to get meaningful results. The ROW_NUMBER window function is useful, but it counts each row as a new value, even if they are the same. Ideally, we would see multiple rows for the same integer as one and the same, and be assigned a single row number, rather than multiple.
The DENSE_RANK window function provides exactly what we are looking for. This function will rank each row in a data set based on the number of distinct values prior to the current row. As a result, duplicates will not impact the results. We can adjust our query from earlier by replacing ROW_NUMBER with DENSE_RANK:
|
1 2 3 4 5 6 7 8 9 10 11 12 |
WITH CTE_ISLANDS AS ( SELECT integer_id, integer_id - DENSE_RANK() OVER (ORDER BY integer_id) AS island_quantity FROM dbo.integers) SELECT MIN(integer_id) AS island_start, MAX(integer_id) AS island_end FROM CTE_ISLANDS GROUP BY island_quantity; |
The results are as follows:
After inserting four additional values, the result was to repeat three existing values, as well as introduce a new integer that was previously missing. One less gap means one less island. If we were interested in how many values (duplicate or not) were within each range, we could add that using an added COUNT:
|
1 2 3 4 5 6 7 8 9 10 11 12 13 |
WITH CTE_ISLANDS AS ( SELECT integer_id, integer_id - DENSE_RANK() OVER (ORDER BY integer_id) AS island_quantity FROM dbo.integers) SELECT MIN(integer_id) AS island_start, MAX(integer_id) AS island_end, MAX(integer_id) - MIN(integer_id) + 1 AS island_length, COUNT(*) AS row_count FROM CTE_ISLANDS GROUP BY island_quantity; |
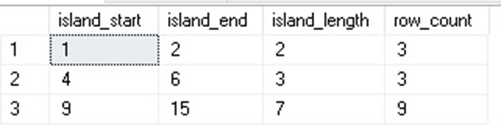
The row_count column tells us how many rows are included within each island, including duplicates, which allows us to better understand how prevalent duplicates are within our data set. Island_length was also added as a measure of how many consecutive and unique values exist within each island.
Finding Islands Within Decimal Data Sets
The world is rarely composed of a nice, neat set of consecutive, nonzero, non-NULL integers. Most real data is large, complicated, and ever-changing. Islands can be found within any data set. The key to doing this is establishing rules as to how data relates and is significant. These rules establish two key parameters for analysis:
- Proximity
- Boundaries
Proximity allows us to correlate data to itself, resulting in groups of data. When data transitions from being correlated to uncorrelated, boundaries are created that represent the ends of each island and the ends of its corresponding gaps.
Let’s create a sample data set similar to earlier, but this time using decimals, rather than integers:
|
1 2 3 4 5 6 7 8 |
CREATE TABLE dbo.decimals (decimal_id DECIMAL(14,8) NOT NULL); INSERT INTO dbo.decimals (decimal_id) VALUES (-9999.9999), (-17.9597), (-17.9596), (-17.953), (-17.825), (-5.6), (-5.2), (-4), (-2.68741), (-0.0000001), (0), (1.00056), (2.6), (2.77777), (26.948), (27.1), (17000.17); |
This data set has a wide variety of values that includes positive, negative, decimal, and whole numbers. To define islands over this data, we need to establish rules that guide adjacency and create correlated data points that comprise those islands. The simplest and most common rule to apply to data like this would be to consider any two rows where the values of decimal_id are within some arbitrary amount.
For testing, let’s define a rule that all rows where decimal_id is within 1 unit of each other are related and comprise an island. Our T-SQL is going to have to evolve to manage data that is no longer consecutive. From this point on, we will use multiple CTEs to accomplish each task needed to crunch this data:
|
1 2 3 4 5 6 7 8 9 10 11 12 13 14 15 16 17 18 19 20 21 22 23 24 25 26 27 28 29 30 31 32 33 34 35 36 37 38 39 |
WITH CTE_DECIMAL_DATA AS ( SELECT decimal_id, LAG(decimal_id) OVER (ORDER BY decimal_id) AS previous_decimal_id, LEAD(decimal_id) OVER (ORDER BY decimal_id) AS next_decimal_id, ROW_NUMBER() OVER (ORDER BY decimals.decimal_id) AS island_location FROM dbo.decimals), CTE_ISLAND_START AS ( SELECT ROW_NUMBER() OVER (ORDER BY decimal_id) AS island_number, decimal_id AS island_start_decimal_id, island_location AS island_start_location FROM CTE_DECIMAL_DATA WHERE decimal_id - previous_decimal_id > 1 OR CTE_DECIMAL_DATA.previous_decimal_id IS NULL), CTE_ISLAND_END AS ( SELECT ROW_NUMBER() OVER (ORDER BY decimal_id) AS island_number, decimal_id AS island_end_decimal_id, island_location AS island_end_location FROM CTE_DECIMAL_DATA WHERE next_decimal_id - decimal_id > 1 OR CTE_DECIMAL_DATA.next_decimal_id IS NULL) SELECT CTE_ISLAND_START.island_start_decimal_id, CTE_ISLAND_END.island_end_decimal_id, (SELECT COUNT(*) FROM CTE_DECIMAL_DATA WHERE CTE_DECIMAL_DATA.decimal_id BETWEEN CTE_ISLAND_START.island_start_decimal_id AND CTE_ISLAND_END.island_end_decimal_id) AS island_row_count FROM CTE_ISLAND_START INNER JOIN CTE_ISLAND_END ON CTE_ISLAND_END.island_number = CTE_ISLAND_START.island_number; |
This T-SQL can be broken into 4 steps:
- Collect the data to be processed. In this example, it is in
CTE_DECIMAL_DATA. - Find all island starting points based on lack of proximity to a previous row. In this example, it is in
CTE_ISLAND_START. - Find all island ending points based on lack of proximity to a next row. In this example, it is in
CTE_ISLAND_END. - Join island starting points to island ending points and report on the results.
Since the number of island starting points is guaranteed to match ending points, we know that we will get a clean join at the end of our T-SQL. The results of this query are as follows:
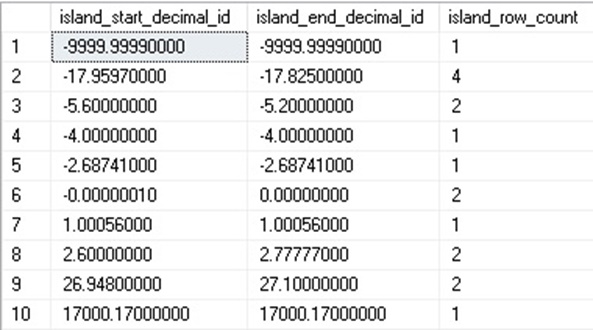
Our set of 17 decimals has been crunched down into ten islands containing anywhere from one to four rows. An island can span more than 1 unit if each consecutive row happens to fall within one unit of the next. For example, consider the following number sequence:
1…1.5…2.25…3…4…5…6
Apply our algorithm to these numbers, and we will get a single island with all seven numbers in it as each decimal is within one unit of the next one. What if we add some duplicate values into our table:
|
1 2 3 4 |
INSERT INTO dbo.decimals (decimal_id) VALUES (-9999.9999), (-17.825), (0), (27.1); |
When we run our analysis query, we get the following results:
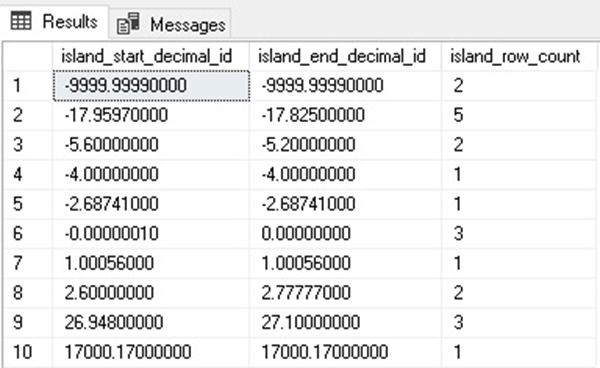
Our new algorithm protects us against bad/nonsensical data resulting from duplicate values. Either a decimal has a value within one unit of it, or it does not. The count at the end of the query will include any number of contained values, regardless of their frequency. While this T-SQL is longer than what we used previously, we will use it going forward in our analysis for several reasons:
- Each CTE is relatively simple and easy to understand and modify.
- We can copy and paste the syntax for other types of data with few modifications.
- The final join will always be the same for any data type.
- Adding metrics via subselects, CTEs, or other added queries is easy.
This is a scenario where longer and more explicit code is beneficial and will buy us scalability for future queries we write.
The benefit of this sort of analysis, in general, is that it allows us to crunch together rows of data into groupings based on any metric. While we started with integers and expanded into decimals, we could very easily apply the latest query to any other data type that we dream up.
Finding Islands in Date/Time Data
The most practical application of gaps/islands analysis is to apply it to dates and times. We often want to know if events are related to each other, and one of the top ways they may be related is if they occur near each other in time. Consider some of these scenarios:
- Marketing campaigns send our advertisements regularly. People view and may click on these ads. Were clicks and purchases based on the ads or not?
- A development team manages a variety of servers that support an application. If apps, services, or hardware fails in sequence, were those outages related?
- The CDC tracks search terms, looking for internet searches that involve medical symptoms, such as a runny nose, headache, or muscle pain. The CDC also tracks occurrences of infectious diseases. When are symptom searches and disease incidences close enough to be related?
- When is a stock investment team on a winning streak? How many consecutive trades resulted in more than a specified amount of gains?
- In sports, what qualifies as a winning streak? Can we measure streaks in other metrics, such as ice time in hockey, at-bats in baseball, or shots in basketball? What if we filter by metrics to look for patterns based on details, such as handedness, time of day, location, temperature, and more…?
This is a rabbit hole that can take us down a significant analytics journey. Let’s take our previous query and extend it to time data:
|
1 2 3 4 5 6 7 8 9 10 11 12 13 |
CREATE TABLE dbo.datetimes (datetime_data DATETIME2(3) NOT NULL); INSERT INTO dbo.datetimes (datetime_data) VALUES ('7/17/2019 00:05:00.157'), ('7/17/2019 00:07:25.000'), ('7/17/2019 00:30:00.777'), ('7/18/2019 12:00:00.565'), ('7/19/2019 12:00:00.980'), ('7/20/2019 12:00:00.098'), ('7/21/2019 12:00:00.332'), ('7/15/2019 21:46:15.197'), ('7/15/2019 21:42:00.000'), ('7/1/2019 14:12:06.674'), ('7/1/2019 14:12:06.986'), ('7/3/2019 01:11:02.001'), ('7/6/2019 09:58:58.840'), ('7/10/2019 16:33:00.702'), ('7/12/2019 23:19:00.411'); |
This table contains fifteen datetime values with precision up to 3 decimal places. Let’s say we are looking at software exceptions and want to group together any events that occur close together as potentially related. We decide that any events that occur within 5 minutes of another event are related. Using this single rule, we can modify our T-SQL used for decimals to analyze this data as well:
|
1 2 3 4 5 6 7 8 9 10 11 12 13 14 15 16 17 18 19 20 21 22 23 24 25 26 27 28 29 30 31 32 33 34 35 36 37 38 39 |
WITH CTE_DATETIME_DATA AS ( SELECT datetime_data, LAG(datetime_data) OVER (ORDER BY datetime_data) AS previous_datetime, LEAD(datetime_data) OVER (ORDER BY datetime_data) AS next_datetime, ROW_NUMBER() OVER (ORDER BY datetimes.datetime_data) AS island_location FROM dbo.datetimes), CTE_ISLAND_START AS ( SELECT ROW_NUMBER() OVER (ORDER BY datetime_data) AS island_number, datetime_data AS island_start_datetime, island_location AS island_start_location FROM CTE_DATETIME_DATA WHERE DATEDIFF(MINUTE, previous_datetime, datetime_data) > 5 OR CTE_DATETIME_DATA.previous_datetime IS NULL), CTE_ISLAND_END AS ( SELECT ROW_NUMBER() OVER (ORDER BY datetime_data) AS island_number, datetime_data AS island_end_datetime, island_location AS island_end_location FROM CTE_DATETIME_DATA WHERE DATEDIFF(MINUTE, datetime_data, next_datetime) > 5 OR CTE_DATETIME_DATA.next_datetime IS NULL) SELECT CTE_ISLAND_START.island_start_datetime, CTE_ISLAND_END.island_end_datetime, (SELECT COUNT(*) FROM CTE_DATETIME_DATA WHERE CTE_DATETIME_DATA.datetime_data BETWEEN CTE_ISLAND_START.island_start_datetime AND CTE_ISLAND_END.island_end_datetime) AS island_row_count FROM CTE_ISLAND_START INNER JOIN CTE_ISLAND_END ON CTE_ISLAND_END.island_number = CTE_ISLAND_START.island_number; |
Our syntax is identical to earlier with the sole exception of our island definition. Here, an island boundary is defined by a row in which the previous or next datetime value is more than five minutes away from it. The results are as follows:
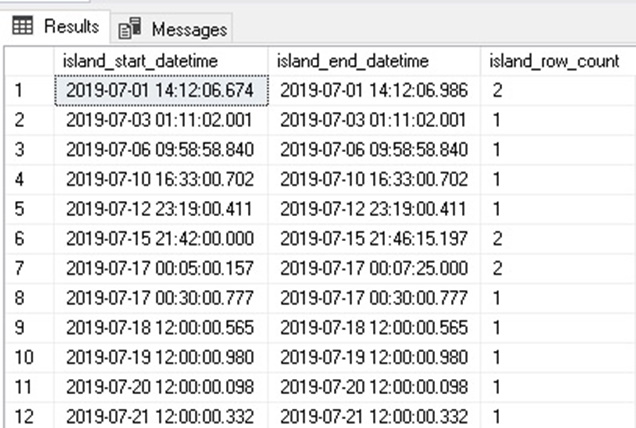
The results show pairs of related events, with the rest appearing farther apart than the allotted window of 5 minutes. We note in the results that some times were repeated often, for example, there were four days in a row with events at about 12:00.
Islands analysis specifically is not built to capture these, though if we knew with certainty that these were singular events daily, we could adjust our query to look at islands as defined by events that are a day apart, but at similar times of the day (within a 5 minute rolling window):
|
1 2 3 4 5 6 7 8 9 10 11 12 13 14 15 16 17 18 19 20 21 22 23 24 25 26 27 28 29 30 31 32 33 34 35 36 37 38 39 40 41 |
WITH CTE_DATETIME_DATA AS ( SELECT datetime_data, LAG(datetime_data) OVER (ORDER BY datetime_data) AS previous_datetime, LEAD(datetime_data) OVER (ORDER BY datetime_data) AS next_datetime, ROW_NUMBER() OVER (ORDER BY datetimes.datetime_data) AS island_location FROM dbo.datetimes), CTE_ISLAND_START AS ( SELECT ROW_NUMBER() OVER (ORDER BY datetime_data) AS island_number, datetime_data AS island_start_datetime, island_location AS island_start_location FROM CTE_DATETIME_DATA WHERE DATEDIFF(MINUTE, previous_datetime, datetime_data) > 5 AND DATEDIFF(DAY, previous_datetime, datetime_data) <> 1 OR CTE_DATETIME_DATA.previous_datetime IS NULL), CTE_ISLAND_END AS ( SELECT ROW_NUMBER() OVER (ORDER BY datetime_data) AS island_number, datetime_data AS island_end_datetime, island_location AS island_end_location FROM CTE_DATETIME_DATA WHERE DATEDIFF(MINUTE, datetime_data, next_datetime) > 5 AND DATEDIFF(DAY, datetime_data, next_datetime) <> 1 OR CTE_DATETIME_DATA.next_datetime IS NULL) SELECT CTE_ISLAND_START.island_start_datetime, CTE_ISLAND_END.island_end_datetime, (SELECT COUNT(*) FROM CTE_DATETIME_DATA WHERE CTE_DATETIME_DATA.datetime_data BETWEEN CTE_ISLAND_START.island_start_datetime AND CTE_ISLAND_END.island_end_datetime) AS island_row_count FROM CTE_ISLAND_START INNER JOIN CTE_ISLAND_END ON CTE_ISLAND_END.island_number = CTE_ISLAND_START.island_number; |
This is a far more customized query that will group either by events that are within 5 minutes of each other or those that are a day apart and also within 5 minutes:
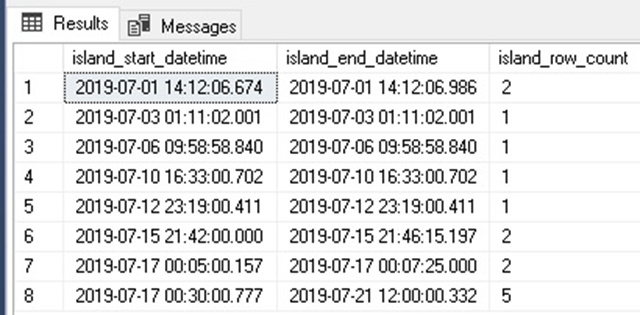
The results allow us to focus also on those scenarios where the same alerts occurred day after day at similar times. A query like this shows that we can easily tailor our analysis to unusual scenarios. An island of data is defined by the filters used to determine the starting points and endpoints. These filters can be simple or wildly complex, depending on how detailed our use-cases are.
Conclusion
Gaps and islands analysis allows us to crunch data based on proximity rather than fixed groupings. This provides greater flexibility and the ability to generate result sets that otherwise could be exceptionally challenging to create.
The basic concept of a data island can be extended from integers to other data types, such as strings, decimals, dates, and times. The T-SQL syntax used can be reused for each iteration of our work with only minimal changes to the details of how it works. This allows for maintainable code that can be reliably implemented and reused as needed.
Ultimately, these analytics allow us to group data organically to identify patterns or related events. These insights can be used for monitoring, alerting, or further analytics and decision-making processes.

Load comments