You’re here, dear reader, because you weren’t “classically trained” as a database administrator. You didn’t graduate from the University of Sciencing Computerses with a Master’s of Transactional Processing.
You probably got your start as a developer or sysadmin, and gradually fumbled your way here. You’re used to monitoring stuff from the OUTSIDE using things like perfmon counters or CPU graphs.
SQL Server has a way, way, way better tool: wait stats. Whenever your queries need to wait on something – storage, locks, memory, whatever – SQL Server tracks what it’s waiting on, and for how long. It’s like you’re seeing INSIDE the server, with all kinds of possible debug points being tracked.
All you have to do is ask SQL Server, “What have you been waiting on?” by running this:
|
1 |
SELECT * FROM sys.dm_os_wait_stats ORDER BY wait_time_ms DESC; |
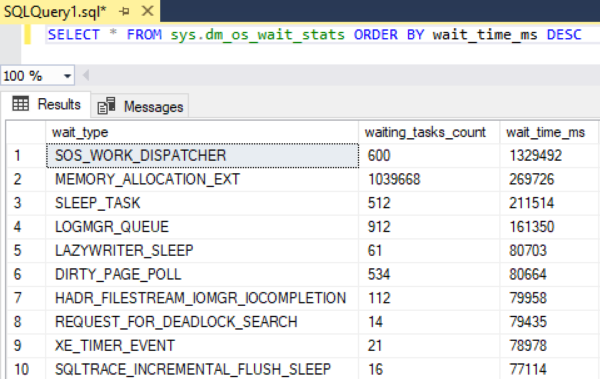
And presto, you get back something that looks like this:
And, uh, it’s…confusing. It’s hard to understand, filled with misleading harmless stuff, and it includes all wait time since startup – which includes overnight jobs, backups, checking for corruption, etc. So I wrote something better.
The better way: sp_BlitzFirst
Go get sp_BlitzFirst from our free First Responder Kit, and run it like this:
|
1 |
sp_BlitzFirst @ExpertMode = 1; |
Here’s what it does:
- Takes a snapshot of a bunch of system data (including sys.dm_os_wait_stats)
- Waits 5 seconds
- Takes another snapshot
- Compares the difference between those 2 snapshots to tell you what’s happening on the server (without starting anything expensive and slow like a trace or XE session)
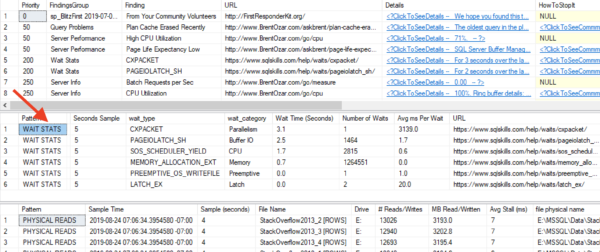
Here’s what the output looks like – and focus in on the area where I’m pointing at with the spiffy red arrow:
The “WAIT STATS” section lists what your server was waiting on during that 5 seconds:
- Wait_type: cryptic name from Microsoft
- wait_category: more human-friendly description
- Wait Time: how long we spent waiting on that thing. Generally, the top couple of things should get most of your focus, and this is what I’m sorting the results by.
- Number of Waits, Avg ms Per Wait: helps you understand if this is something that’s not happening often (but sucks when it happens), or if it’s a death-by-a-thousand-cuts scenario
- URL: a link to SQLskills’ wait types library so you can learn more about each particular wait type
Now, the trick you just learned only shows you performance right now. Your next question is going to be, “How can I track this stuff over time?” You can set up an Agent job to run sp_BlitzFirst every 15 minutes and log this data to table so you can trend it over time:
|
1 2 3 4 5 6 7 8 |
EXEC sp_BlitzFirst @OutputDatabaseName = 'DBAtools', @OutputSchemaName = 'dbo', @OutputTableName = 'BlitzFirst', @OutputTableNameFileStats = 'BlitzFirst_FileStats', @OutputTableNamePerfmonStats = 'BlitzFirst_PerfmonStats', @OutputTableNameWaitStats = 'BlitzFirst_WaitStats', @OutputTableNameBlitzCache = 'BlitzCache'; |
You can learn more about doing that, and how to use Power BI to read the data, in my post on the free Power BI Dashboard for DBAs.
The modern method of SQL Server performance tuning
I can’t emphasize this enough: screw CPU %, page life expectancy, disk queue length, or any of those other metrics your grandpa told you to watch. If you’re only looking at a few metrics at a time, you’re looking at SQL Server from the outside.
It’s time to get inside the server:
- Ask SQL Server, “What have you been waiting on?”
- Find the top queries & issues causing that wait
- Focus your tuning efforts on those to give you the biggest bang for the buck
Obviously, I can’t teach you about every possible wait type bottleneck on your server in this DBA Training Plan series, but I can get you started on the right steps on the journey. Here are your next steps for learning:
- Run sp_BlitzFirst @SinceStartup = 1, and look at the top wait types on your servers. Read the SQLskills wait library data for your top waits, and search the blog here too.
- Free Troubleshooting SQL Server book – once you know your top wait types, pop this book open and turn to the relevant chapter for techniques on how to mitigate it. (It’s also got chapters on typical production outage issues, too.)
- Fundamentals of Server Tuning class – where I teach you how to use sp_BlitzFirst to measure your server, and we talk through the top wait types on your server together.
- Mastering Server Tuning class – 3-day hands-on class where you’re given tough workload challenges and you have to fix ’em fast.


6 Comments. Leave new
Great article, Brent. Could you please fix the query code: “SELECT * FROM sys_dm_os_wait_stats ORDER BY wait_time_ms DESC;” to “SELECT * FROM sys.dm_os_wait_stats ORDER BY wait_time_ms DESC;”
The screenshot below the code shows the correct name with sys. instead of sys_.
Thanks, fixed! It’s funny – in SQL ConstantCare’s databases, we store the DMVs with an underscore instead of a period (because you wouldn’t want the table names to have periods in them), and I’ve now got muscle memory from querying those, hahaha.
Brent Ozar, You rock!
I use to sing “last day a DBA saved my life” under my cold shower” since I discovered your work.
Very kind regards
Christophe Tielles, French DBA
PS: I will surely call soon to reward you with a more depth analysis of my SQL Server instances.
Cool, glad I could help!
Solarwinds Database Performance Analyzer is a nice tool to capture this information and show what happened historically. Been using it for years now to do a post mortem on issues on our servers.
Thanks very much for Sharing.