

Remember those standardized tests you took in school? They compared how you performed to others in your region, the ranking, not the actual percentage of correct answers.
Microsoft released several window function features with SQL Server 2012 including two that compare items in a list like those standardized test results. These two functions are PERCENT_RANK and CUME_DIST. They are similar to the RANK function but return a percent over the group instead of just a ranking number.
For a list of scores, PERCENT_RANK returns the percent of values less than the current score. CUME_DIST, which stands for cumulative distribution, returns the actual position of the score. If there are 100 scores and the PERCENT_RANK is 90, that means that the score is higher than 90 scores. If the CUME_DIST is 90, that means that the score is the 90th one in the list.
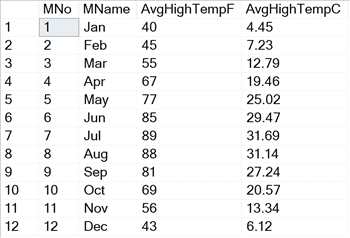
Here is an example using the monthly average high temperature for the St. Louis, MO, area. First, create a table containing a row for each month and the temp.
CREATE TABLE #MonthlyTempsStl(MNo Int,
    MName varchar(15),
    AvgHighTempF INT,
    AvgHighTempC DECIMAL(4,2))
INSERT INTO #MonthlyTempsStl(Mno, MName, AvgHighTempF)
VALUES(1,'Jan',40),(2,'Feb',45),(3,'Mar',55),
      (4,'Apr',67),(5,'May',77),(6,'Jun',85),
      (7,'Jul',89),(8,'Aug',88),(9,'Sep',81),
      (10,'Oct',69),(11,'Nov',56),(12,'Dec',43)
UPDATE #MonthlyTempsStl
SET AvgHighTempC = (AvgHighTempF - 32)/1.8;
SELECT * FROM #MonthlyTempsStl;
Now take a look at how the temperatures rank using RANK, PERCENT_RANK, and CUME_DIST.
SELECT MName, AvgHighTempF, AvgHighTempC,
RANK() OVER(ORDER BY AvgHighTempf) AS Rnk,
PERCENT_RANK() OVER(ORDER BY AvgHighTempF) * 100.0 AS PR,
CUME_DIST() OVER(ORDER BY AvgHighTempF) * 100.0 AS CD
FROM #MonthlyTempsStl;
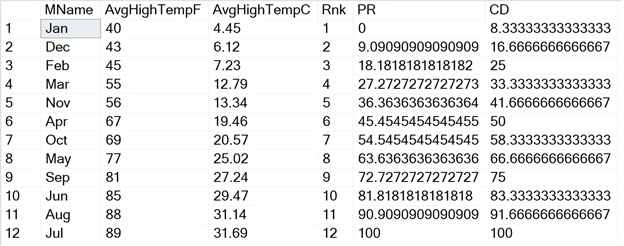
January is the coldest month. No other months are colder than January, so the temperature has a PERCENT_RANK of 0. It has a CUME_DIST of 8.33% (the values have been multiplied by 100 to return percentages) because the temperature is at 8.33% in the list.
July is the hottest month. Both PERCENT_RANK and CUME_DIST return 100 because it’s hotter than all the other months and at the top of the list. When you use these functions, you’ll always see 1 or 100% returned for the highest item in the list.
You might be wondering how these values are calculated, especially since I said that they are based on the rank. Here are the formulas:
PERCENT_RANK = (RANK – 1)/(COUNT -1)
CUME_DIST = RANK/COUNT
To show that this really works, run this query:
SELECT MName, AvgHighTempF, AvgHighTempC,
RANK() OVER(ORDER BY AvgHighTempf) AS Rnk,
(RANK() OVER(ORDER BY AvgHighTempF) -1)*100.0/(COUNT(*) OVER() -1) AS PR,
RANK()OVER(ORDER BY AvgHighTempF)*100.0/(COUNT(*) OVER()) AS CD
FROM #MonthlyTempsStl;
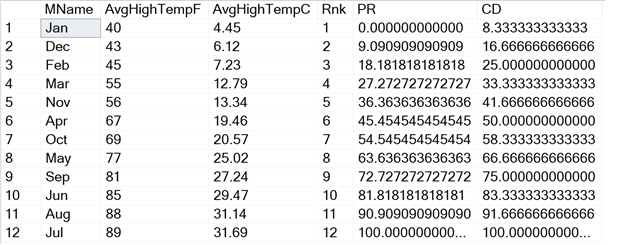
Except for returning the zeros to the right of the decimal place, the results look the same. There is one issue with using the formulas. If a partition has just one item, then you’ll get a divide by zero error with the PERCENT_RANK formula.
The next thing you might wonder about is performance. Is there a performance difference between using the calculations and the much simpler functions? My intuition tells me that there would be no difference since the functions are based on the calculations, but that is not the case. The formulas are somewhat more efficient than the functions for a large number of rows. To see this, run this code to create a large temp table in AdventureWorks.
CREATE TABLE #SOD(SalesOrderID INT, SalesOrderDetailID INT, LineTotal Money);
INSERT INTO #SOD(SalesOrderID, SalesOrderDetailID, LineTotal)
SELECT SalesOrderID, SalesOrderDetailID, LineTotal
FROM Sales.SalesOrderDetail
UNION ALL
SELECT SalesOrderID + MAX(SalesOrderID) OVER(), SalesOrderDetailID, LineTotal
FROM Sales.SalesOrderDetail;
CREATE INDEX SalesOrderID_SOD ON #SOD
(SalesOrderID, SalesOrderDetailID) INCLUDE(LineTotal);
To see the difference, use STATISTICS IO. Run these queries and take a look at the Messages tab.
SET STATISTICS IO ON;
SET NOCOUNT ON;
GO
PRINT 'Cume_dist'
SELECT SalesOrderID, SalesOrderDetailID, LineTotal,
   CUME_DIST() OVER(PARTITION BY SalesOrderID ORDER BY LineTotal) * 100 AS Ranking
FROM #SOD
ORDER BY SalesOrderID, Ranking;
PRINT 'Formula'
SELECT SalesOrderID, SalesOrderDetailID, LineTotal,
  RANK() OVER(PARTITION BY SalesOrderID ORDER BY LineTotal) * 100.0/COUNT(*) OVER(PARTITION BY SalesOrderID) AS Ranking
FROM #SOD
ORDER BY SalesOrderID, Ranking;
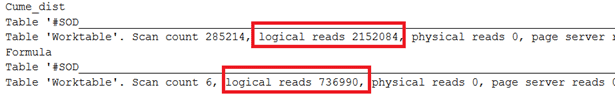
The query using the CUME_DIST function took over 2 million logical reads from the worktable while the formula took over 700 thousand. In each case, that’s a lot of logical reads! Hopefully, when these functions are used on an actual problem, they are applied to a much smaller number of rows, so the performance doesn’t matter so much.
SQL Server 2019 solves this issue starting with CTP3, the most recent available at the time of this writing. In this version, a new method called Batch Mode on Rowstore is used when a big difference can be made in performance. It’s up to the engine to figure out when that is, but in earlier experiments, I found it’s about 130 thousand rows when a window aggregate is part of the query.
When switching the database compatibility mode to SQL Server2019 (150) and running the queries again, the logical reads for the worktables have decreased to zero.
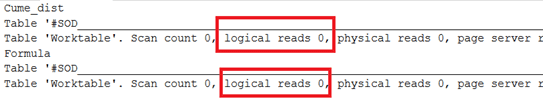
Of course, you’ll need SQL Server 2019 to see this performance boost.
For many projects, either function may work just as well for you. In case it does affect your results, you now know the difference between them and will be able to choose which one will work the best for your situation.
