This is the second in a series on setting up a Data Science Laboratory server – the first is located here.
My plan is to set up a system that allows me to install and test various methods to store, process and deliver data. These systems range from simple text manipulation to Relational Databases and distributed file and compute environments. Where possible, I plan to install and configure the platforms and code locally.
This article covers Instrumentation – the way that you can measure the time that processes take, and evaluate resource allocation, on the laboratory system.
The laboratory system’s first function is to serve as a place to load, learn and test software that deals with data; it is important to be able to measure what you do. Some of these tools and processes you’ll be familiar with, others may be new or updated significantly. As always, it’s best to test these tools out yourself as you read along.
The Story So Far
My goal is to work with the following types of data systems:
- Text Systems
- Instrumentation (This article)
- Interactive Data Tools
- Programming and Scripting Languages
- Relational Database Management Systems
- Key/Value Pair Systems
- Document Store Databases
- Graph Databases
- Object-Oriented Databases
- Distributed File and Compute Data Handling Systems
I’ll repeat a disclaimer I made in the previous articles:
Note: This information is not an endorsement or recommendation to use any particular vendor, software or platform; it is an explanation of the factors that influenced my choices. You can choose any other platform, cloud provider or other software that you like – the only requirement is that it fits your needs. As I always say – use what works for you. You can examine the choices I’ve made here, change the decisions to fit your needs and come up with your own system. The choices here are illustrative only, and not meant to sell you on a software package or vendor.
The first article in this series explains my choices for the platform and the operating system, and details a few tools for text-based data interaction. The second article deals with a few examples for those text tools. Even with a few examples however, there is no substitute for studying and reading up on the tools – this series isn’t meant to be an exhaustive examination of each one. Hopefully the examples give you an idea of what the tool can do, and then you can decide how much further you want to investigate it.
The Monitoring Process
Performance monitoring isn’t a major objective of the instrumentation for the laboratory, since the system isn’t designed to have adequate hardware for that type of testing. In fact, you normally wouldn’t test a process for performance using a Virtual Machine, unless the production system is also a virtualized environment. There’s actually quite an established scientific method to proper performance tuning: Even if you have identical environments, it’s almost impossible to completely simulate the load on the production system.
In any scientific process, measurement is of paramount importance. The experimenter aims to change one of the many factors that together determine the behavior of whatever he is observing, whilst keeping the others constant, or at least ensuring that they exert a consistent influence across the changes in the factor being observed. One factor is changed and all others are ‘controlled’ to try to ensure that the consequences of the deliberate changes are causing the observed effects.
The process for measurement is very important. In order to rely on the numbers you obtain from the monitoring you’ll need to ‘control’ factors other than the one you’re experimenting with to ensure that you follow the same process under the same conditions each time you run your experiment, and carefully document as many factors that as you can that could distort the results. Any note-taking tool is sufficient. You should record narration and numbers of your test, and include graphics and screenshots where appropriate. Formats vary, depending on the type of test run, and this is where an electronic note-taking utility such as OneNote is useful, because it allows for graphics and embedded objects.
Reference: Monitoring .NET Applications is a great primer on the monitoring process, and something you can use to develop your notebook layout.
Measuring Time
I’ve already mentioned that it isn’t a good idea to use the lab system for formal performance tuning. The lab system by definition has more software loaded and is configured in a different way than a production system. Production systems should have no more software than is absolutely necessary to perform a task, and should be configured for that task with the most optimal settings possible. The lab system has lots of extraneous tools for testing and isn’t configured the same for any length of time.
That being said, there are generalizations you can make about the time it takes for a process to run. Having that number at least provides a starting point and you can use it to make comparisons between processes, the software tool for the run, and the impact of configuration changes.
Most data software packages have built-in measurement tools and commands. I’ll defer the discussion of each of those and instead focus on the operating system tools that show the time aspects of a given process.
At the most general, to get the time of a process the outline looks like this:
- Record current time t1
- Run process
- Record current time t2
- Show elapsed time between t1and t2: t2-t1 = complete process time
This is a common practice in software development, but in some cases you don’t have access to the source code in a process. You can use operating system commands and third-party utilities to get the time that a process takes. For instance, as a simple test of duration, you could use the following batch-file in Windows to get the time for simple directory search for files created in the last article:
|
1 2 3 4 5 6 |
copy con c:\users\Administrator\Documents\testtime.cmd time /t > c:\users\administrator\documents\testtime.txt dir c:\*.tsv /s time /t >> c:\users\administrator\documents\testtime.txt type c:\users\administrator\documents\testtime.txt <<Press CTRL-Z to close the file>> |
This creates a cmd batch file that first uses the time command in Windows with the /t switch, recording the current time. Using the > pipe, the value is placed in a file called testime.txt. Following that, the batch runs whatever commands or processes desired, and then the same time command is run, but this time using the >> pipe to append to the text file rather than creating it. After the run, the start and end time is displayed.
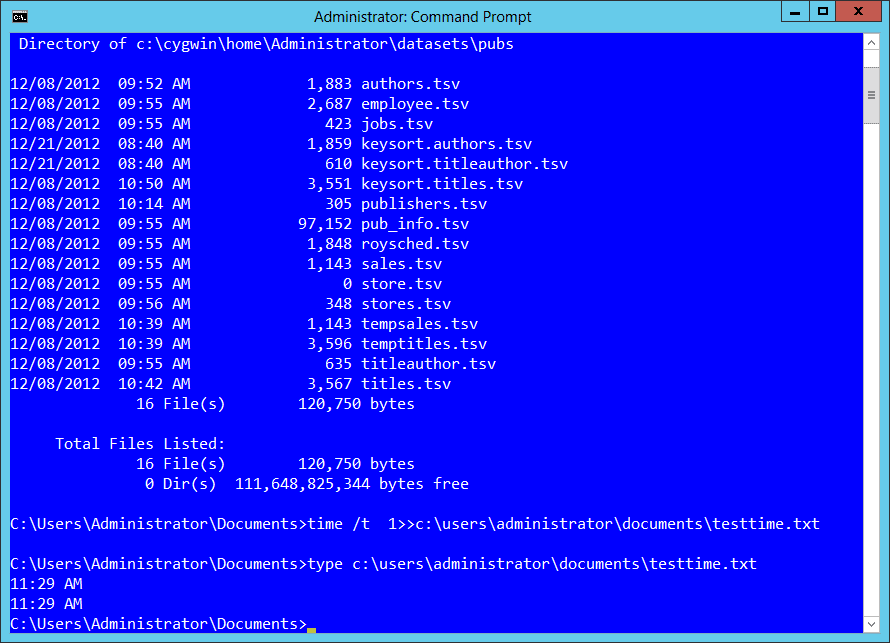
If your process involves more than one step, this is actually a good way to show the complete elapsed time, since it measures the start and completion of all commands in the batch, and you could also append more than one time-check throughout the run to measure each part.
There are some drawbacks, however. The time command in Windows doesn’t show seconds or milliseconds, and you may want that level of precision for the smaller workloads that you’ll test on your system. Also, while it’s miniscule, the time it takes to open and write the information in the testtime.txt file is included in the measurements. That isn’t exactly what you’re after.
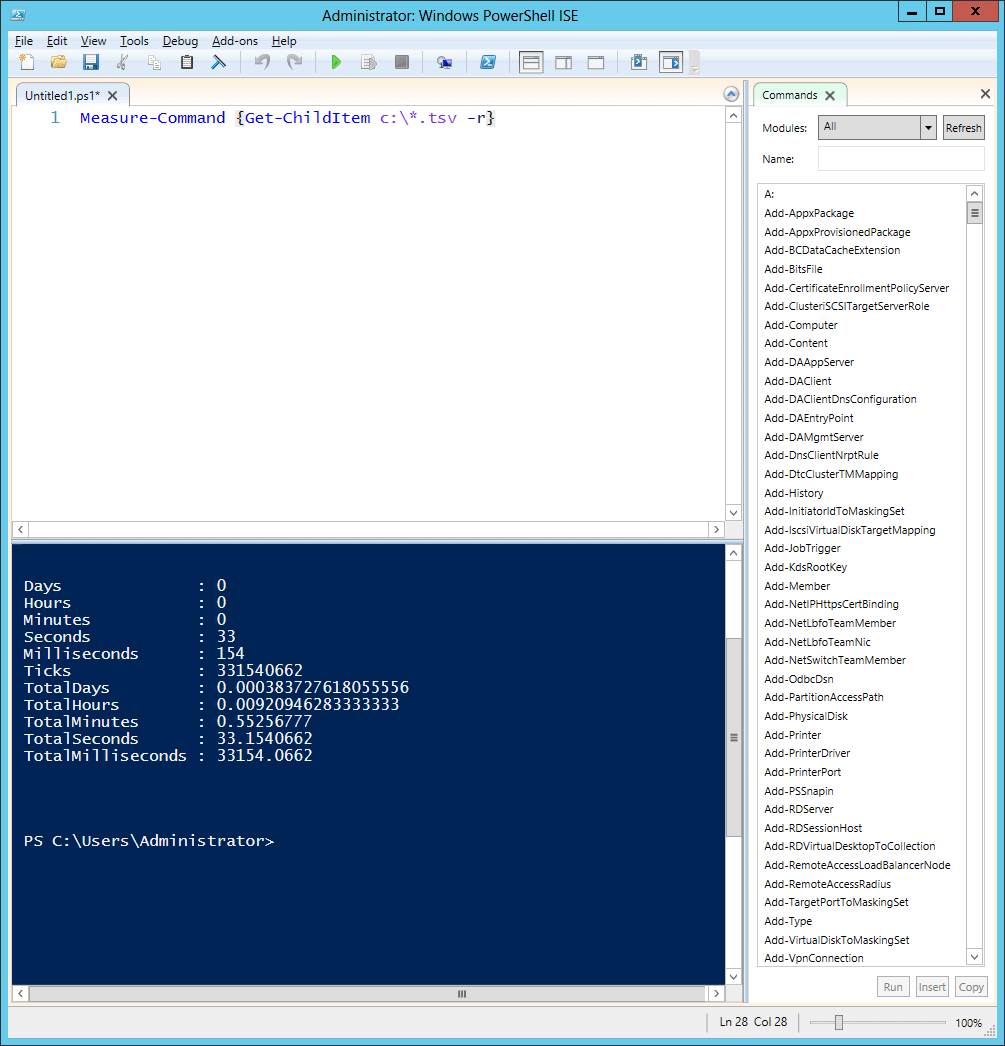
Using PowerShell you’ll get far more information and granularity, and you won’t have to write out the information into a file. Here’s the same process using PowerShell’s measure-Command cmd-let:
|
1 |
measure-Command {Get-ChildItem c:\*.tsv -r} |
The {} in PowerShell is a “block” of code, so much more than just a simple DIR command applies. You’ll get far more information, and you can combine that with other commands to output the data to a file, e-mail, Excel, or anything else PowerShell supports.
In a POSIX-compliant system, and in UNIX variants like Linux, you normally use a set of tools built-in at the shell level to monitor a process. Using the Cygwin tools from the last tutorial, I’ll demonstrate testing one of the first text-based tools from the last article: the Cygwin tool “wc“.
The wc tool is a simple, albeit powerful, utility. It counts the lines, words and bytes in a file. It can even work on very large files – and I wanted to find out how it does that. Does it read the entire file into memory, or stream it through and perform some calculation? Of course, I could look this information up, but this is an example of discovering how a tool works, a practice I’ll use in the data systems that follow.
The command for wc is quite simple – it’s wc and then the name of the file. If you’re ever unsure about the syntax, use and format for a Cygwin command you can type “man” and the name of the command for more information.
Using the largest of my sample data files from the last article I started the monitoring tools and then opened the Cygwin terminal, navigated to the directory where I stored that file, and then ran the following command:
|
1 |
time wc long_abstracts_en.nq |
I received the following output a few seconds later:
|
1 2 3 4 5 |
3769928 362732492 2801266780 long_abstracts_en.nq real 2m17.558s user 1m32.171s sys 0m2.312s |
This shows the actual elapsed time (real), the time spent calling from the CPU for system functions (user) and the amount of system time used during the process (sys). Note that the format returned varies from POSIX to POSIX implementation, and I’m showing the Cygwin format here. Your Unix system may show another format, but they all normally contain this same information.
Measuring Resources
Measuring the time a process takes is usually the first step, followed by measuring the resources consumed by a process. Excepting specific object monitoring, most technical professionals focus on the “big four” components in a computing system: CPU, Memory, I/O (usually the storage subsystem) and Networking. Showing the use of each of these components throughout an experiment informs you about the areas to tune, which areas cannot be tuned and more.
There is an extremely rich set of tools that are designed to monitor a Windows-based system, from broad to very specific levels. The most useful for the “big four” monitoring are the built-in Task Manager, Resource Monitor, and Performance Monitor.
If you’re writing your own code on the laboratory system you may want to take a look at this article which covers stacks and trace monitoring using a new suite of tools from Microsoft: http://blogs.microsoft.co.il/sasha/2013/02/06/windows-performance-analyzer/
You should take the time to read up further on each of these tools, since they are useful not only in the laboratory system but in your day-to-day job as a technical professional – regardless of the data technology you use on Windows. This article focuses on a general overview.
My process is to start with the broadest measurements, and then focus in on the components that show the highest pressure. This allows me to focus my efforts on what part of a process uses the most resources.
Task Manager
One of the most basic tools in Windows to analyze a process is Task Manager. This tool has been installed in the Windows operating system since the earliest releases of Windows NT 4.0, and if you haven’t evaluated it in the latest releases you’ll find significant changes in the interface and what you can collect with the tool. Start with this tool to gain the broadest set of information about resource utilization on the system as you run a process. You can pivot off to other performance tools from the same window.
To start Task Manager you have several options:
- Press CTRL+ALT+DELETE, and then click Task Manager.
- Press CTRL+SHIFT+ESC.
- Right-click an empty area of the taskbar, and then click Task Manager
Once you start the tool, you can see the main process sheets: Processes, Performance, Users, Details and Services.
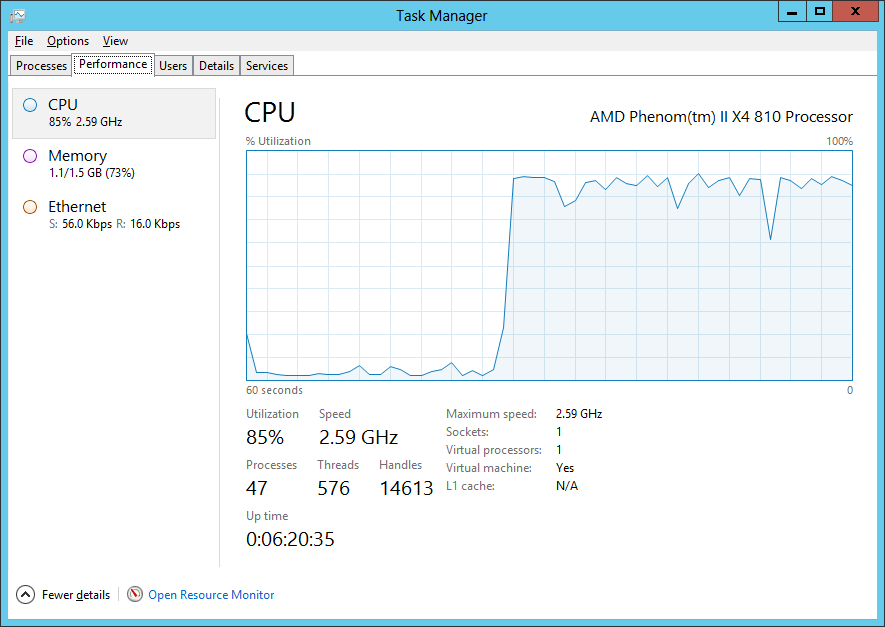
You’ll notice from the graphic that you have access to information on the CPU, Memory and Network components, but not the I/O subsystem. Right-clicking in this tab allows you to show a smaller version of the graphs for the components on the system, or expand the components to show individual graphs rather than red-yellow-blue health indicators.
Selecting the Details panel allows you to see individual processes, which can lead to the resources used by those processes.
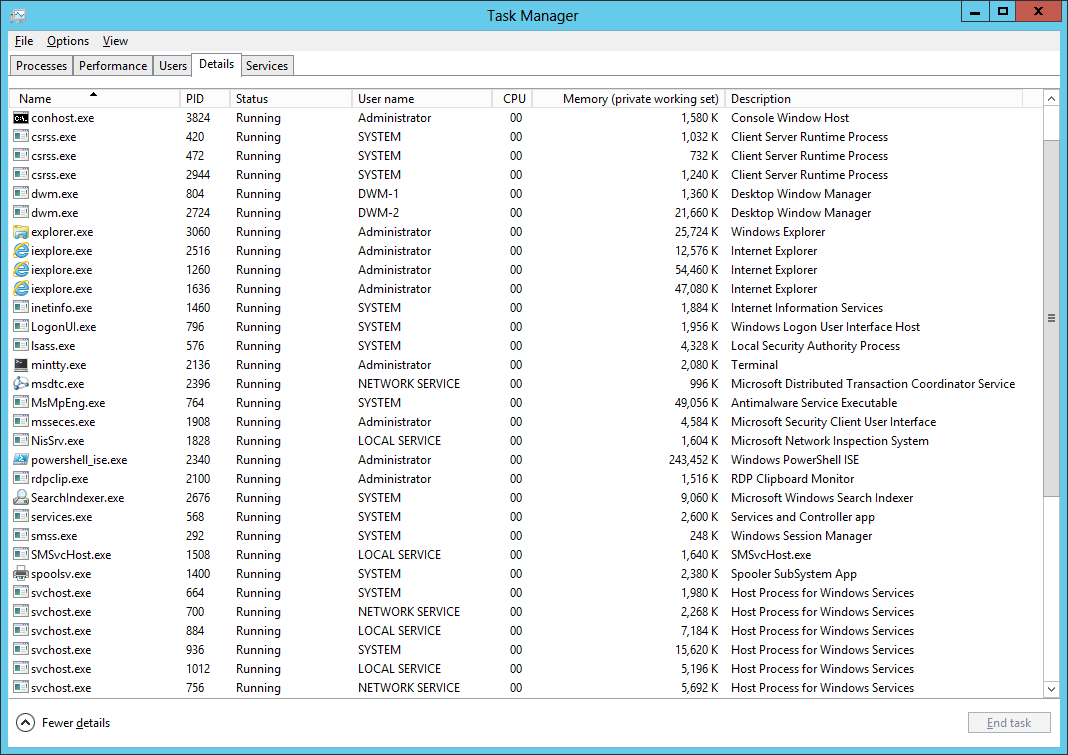
Right-clicking the headers in the details pane allows you to add more details about a process, such as CPU time, I/O time and more.
You can learn more about this tool here:
- http://blogs.technet.com/b/askperf/archive/2012/10/27/windows-8-windows-server-2012-the-new-task-manager.aspx
- http://4sysops.com/archives/overview-of-the-task-manager-in-windows-server-2012/
Resource Monitor
The next level of detail is available in the Resource Monitor tool. You can get to this tool from the Task Manager, or:
- Press the Windows key and type “Resource Monitor“
- The Command: %windir%\system32\perfmon.exe /res
- The Command: %windir%\system32\resmon.exe
Resource Monitor focuses on the big four, specifically more real-time monitoring as a process runs.
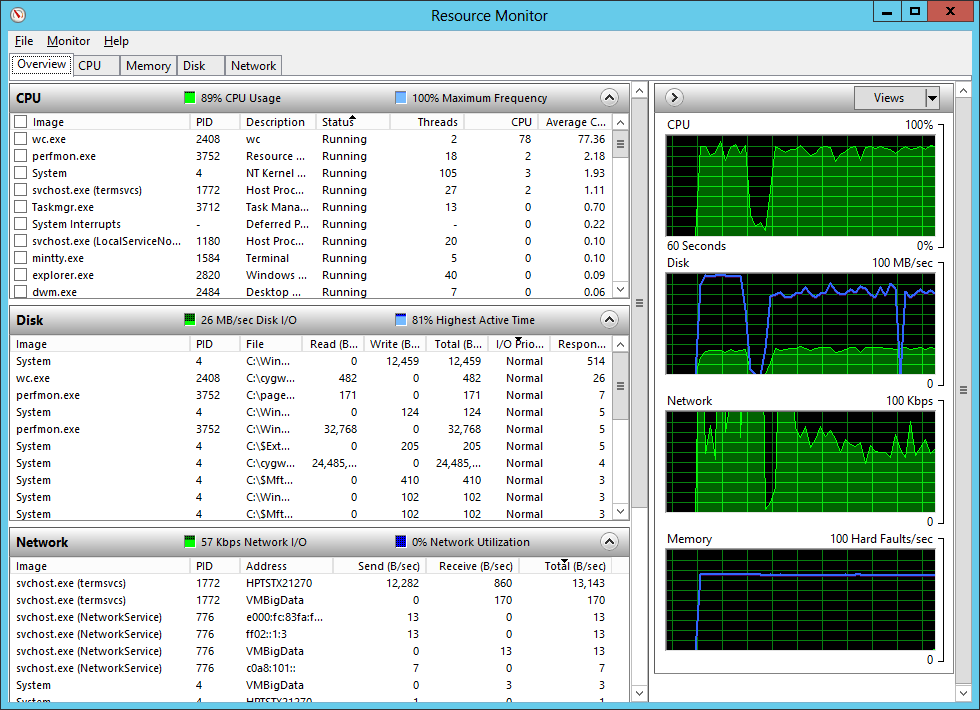
It’s a different view than the Task Manager, starting with the four main components listed on the first panel, along with graphs and small health monitors next to each component. From there you can drill in to a specific component by selecting the appropriate tab.
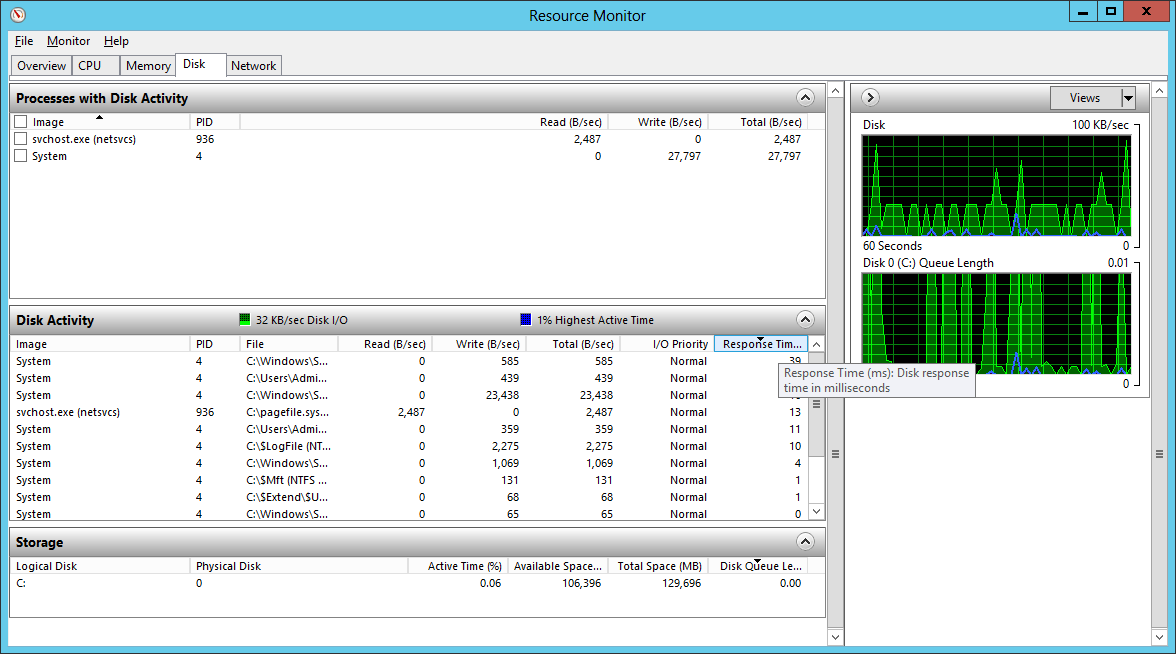
I use this tool to start with the Disk and Network components. I can quickly locate which processes are taking the most time on the disk, and start identifying a chain of processes that are affected by opening the Disk tab and sorting the columns by Response time.
You can read more about Resource Monitor and how to use it here:
- http://www.makeuseof.com/tag/closer-windows-resource-monitor/
- http://blogs.technet.com/b/askperf/archive/2012/02/01/using-resource-monitor-to-troubleshoot-windows-performance-issues-part-1.aspx
Performance Monitor
So far the tools shown use real-time, which means you’re sitting at the console watching a particular sequence run. While that’s common in a laboratory system, there are times that the process will take longer than you’re willing to sit and watch the screen.
Most of the time you’re also going to want to record the performance and big four impacts on your system. To do that, you’ll need to a way to record the results of your measurements, and for that one of the best tools is the Windows Performance Monitor. This tool has been around since the earliest versions of Windows Server, and is the primary tool for monitoring not only the operating system, but software that plugs into this architecture. It’s been upgraded significantly in the latest releases of Windows Server, so it deserves another look if you’ve used it before.
I’ll provide some resources that show you examples and practical uses of this tool, since there are so many references available for that. Rather than focus on each specific use-case for Performance Monitor, I’ll explain generally how it works, and then how you can use it with your laboratory system. I’ll also explain a command-line tool that allows you to create monitoring sessions, start them, and record their output, all without having to use the graphical interface.
You can start the Performance Monitor by pressing the Windows key and typing “Performance Monitor“, or you can type “perfmon” at the command-line in CMD or PowerShell.
Once inside, you’ll see there are three primary areas you have access to:
- Monitoring Tools
- Data Collector Sets
- Reports
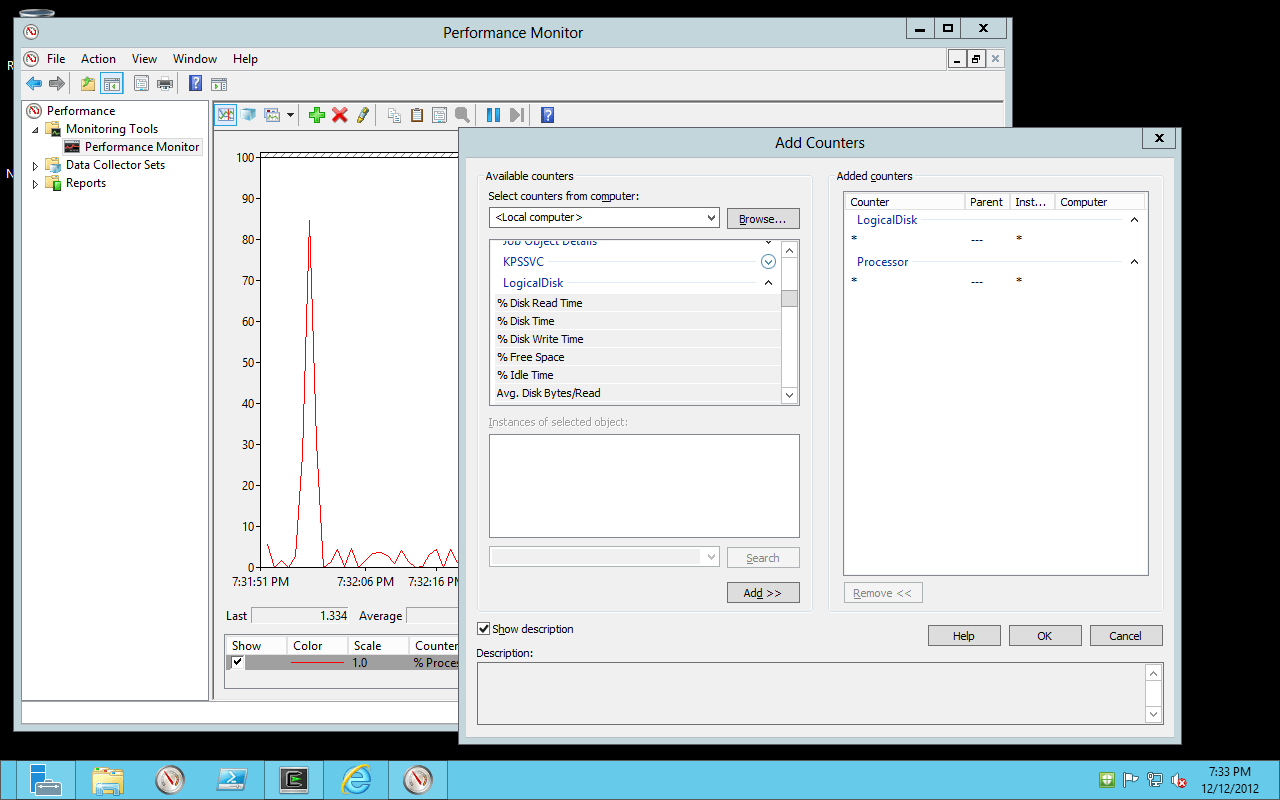
Performance Monitor works using Objects, such as the CPU, Counters on those Objects, such as %Processor Time, and displaying Values for those Counters as time goes by. Each Object/Counter pair determines the time interval they will present for monitoring, and the Values are collected based on that interval and then whatever granularity on that interval you want.
A monitoring session involves picking Objects and Counters and examining the Values they present. You could, for instance, select various Counters from the Memory, CPU, Network Interface and I/O subsystem Objects at one time to form a picture of the activity on the system. Think of it as a manual selection of the Objects shown in Task Manager or the Resource Monitor. By default, the values are collected and displayed in a graphical line chart on the screen as they occur.
You can, however, change the behavior and have Performance Monitor record the values to a file, either Binary or Text, and examine them later. My process is to set up the monitoring to a text file and then allow it to run for a short period of time. I then fire off my experiments, allow them to complete, and wait a few moments after completion to stop the collection. I then open the text file in Excel or R and study and graph the results. I allow the “white space” at the beginning and end of the run to ensure I catch the background noise of the normal system operation. I will repeat the process during subsequent runs of my experiment as I change variables to see which components are exercised during the various test runs.
Just below the Performance Tools item are Data Collectors (my apologies to the SQL Server experts, at Microsoft we do tend to re-use terms sometimes). These are System Event Traces (ETW) events that can be collected and analyzed and shown in the Reports item just below Data Collectors. There are two default Data Collectors you can run to show the system configuration and health and a 60-second performance collection. The reports are quite valuable, and you can also create your own.
You can also create, schedule, run and collect ETW traces using the Logman command-line tool. I’ll reference the documentation to that tool in a moment.
One word of caution when using the Performance Monitor tool – it’s not to be blindly trusted. You must carefully understand how the numbers for each counter are presented, since some of them are written by Microsoft and others by third-party vendors, if you are using Performance Monitor Counters with their products. Also, it’s important to consider the granularity and other equality conditions when combining Objects and Counters.
Here are a few references you should read, and experiment with on your system:
- General Documentation on Windows Performance Monitor: http://technet.microsoft.com/en-us/library/cc749249.aspx
- A “Using Windows Performance Monitor” Guide: http://technet.microsoft.com/en-us/library/cc771692.aspx (For Windows 2008 but holds for Windows 2012 as well)
- Logman reference page: http://technet.microsoft.com/en-us/library/cc753820%28v=WS.10%29.aspx
- Practical example of Logman: http://blogs.technet.com/b/askperf/archive/2008/05/13/two-minute-drill-logman-exe.aspx
Sysinternals
Another common set of tools to monitor very specific areas of your system is the Sysinternals suite of software, formerly its own company and now part of Microsoft. The entire set of tools are listed here: http://technet.microsoft.com/en-us/sysinternals/bb545027 and there are many utilities you can use to monitor your system. I downloaded the entire suite (http://technet.microsoft.com/en-us/sysinternals/bb842062) since I’ll use many of these tools to evaluate my system.
I focus primarily on the following tools from this suite:
- Process Monitor – Show the file system, Registry, process, thread and DLL activity
- PsList – Shows Processes and Threads
- ListDLLs – Information on currently loaded DLLs. This is more useful than you may think.
- Handle – Files opened by process
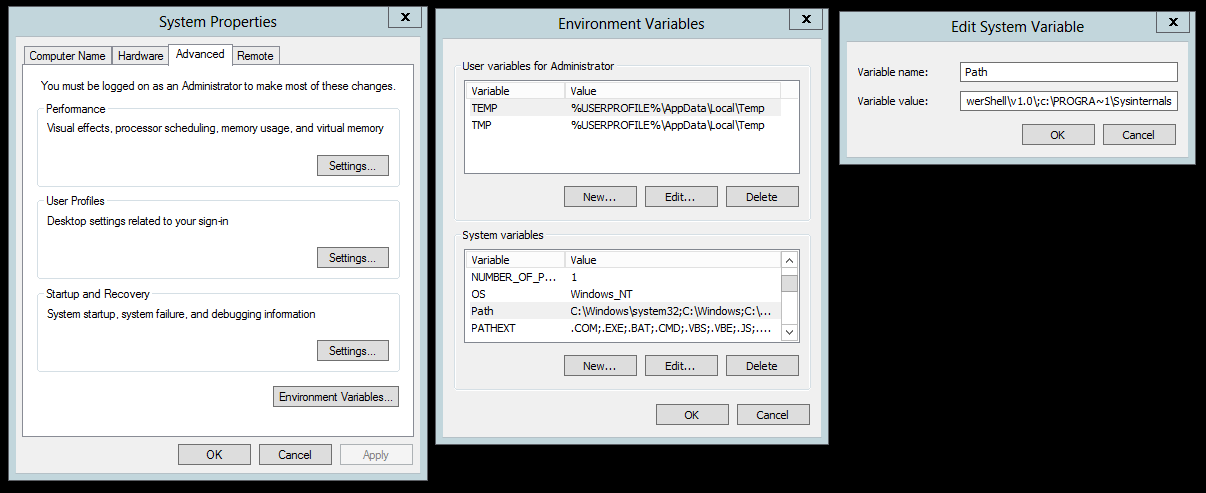
This is a short list, but I find all of the tools useful from time to time. When you download these utilities as a complete package, they come in a “zipped” file, so you’ll need to expand them into whatever directory you like, and add them to the path if you want them to be available directly from the command line. I copied mine to a c:\Program Files\Sysinternals directory, and the used the following process to set the path:
- Open Control Panel \System and Security\System
- Click on Change Settings
- Open Advanced tab
- Click on Environment Variables
- Click the Path variable in the bottom part of the panel and then Edit
- Add ;c:\PROGRA~1\Sysinternals
- Close all panels
Note that you don’t have to add these utilities to that path of your system; it just makes things simpler to type at the command line.
The “Help” files in these utilities are quite good – start there for the most information, and then at the download links above for more specifics on each. Note – if you use the process described, you’ll need to open the rights in that directory so that the help files can launch. You could also place the tools in another directory to avoid this concern.
In the next article in this series, I’ll cover tools you can use to interact directly with data, meant to be used (although not exclusively) at the terminal.

Load comments