Traces are defined and managed using sp_trace* stored procedures, regardless of whether one uses the Profiler graphical interface or a T-SQL script to accomplish the task. The same trace system stored procedures that Profiler calls internally can be executed directly from a T-SQL script to create a server-side trace that runs independently of Profiler.
SQL Trace is one of my favorite SQL Server features. Tracing in SQL server allows one to selectively capture and record valuable details of SQL Server Database Engine events that would otherwise be discarded. Information captured with these events is useful for a variety of purposes, such as performance analysis, troubleshooting, forensics, establishing baselines and proactively identifying problem areas.
Tracing is a powerful tool but must be used prudently, in order to avoid burdening SQL Server with unnecessary work and degrading database server performance. In this Stairway, I’ll show how to create server-side traces to gather useful information while minimizing tracing overhead, and how to manage those traces efficiently. This first level reviews SQL Server Tracing architecture, concepts, and terminology and illustrates important differences between Profiler and server-side tracing.
For this Stairway Series, I’ll assume that you are at least familiar with SQL Server Profiler, and perhaps have even used it extensively. See Brad McGehee’s book, Mastering SQL Server Profiler, for a detailed discussion of Profiler features and usage.
Let me first make it clear that Profiler is just a client tool that provides a graphical interface for setting up, managing and monitoring traces; tracing itself always occurs on the back end, i.e. inside of the database engine, regardless of whether you run the trace directly from Profiler or use a T-SQL script. I will show why server-side tracing incurs much less overhead and is a better method than tracing through the Profiler GUI, in many situations. This Stairway series, as a whole, will explore details of what happens with tracing inside of the database engine, and describe the differences between how trace data are processed with either client or server tracing, so that you can choose the right tool for the task at hand.
SQL Trace Overview
The SQL Server Database Engine performs many actions while processing your data, such as acquiring locks, executing batches and so on. Many of these actions can be captured as events, which SQL Trace can record directly to a file, or return to a client application like Profiler, for subsequent processing. Note that no special action is needed to generate Database Engine events; these events occur naturally, and simply reflect the actions SQL Server performs during processing. Although events provide important insight into SQL Server operation, this event data it is not visible unless explicitly collected. In short, the SQL Trace facility provides infrastructure that allows you to capture and record event information that would otherwise be lost.
A trace event class is an event plus all of its available data columns. When defining a trace, you'll need to specify each desired event class plus the specific data columns you want to collect – in effect, defining specific instances of each event class.
The data columns available with an event vary depending on the event that occurred. For example, when you execute a simple query from SQL Server Management Studio (SSMS), the Database Engine generates several events of various classes, such as SQL:BatchStarting, SQL:StmtStarting, Lock:Acquired, Lock:Released, SQL:StmtCompleted and SQL:BatchCompleted. The SQL:BatchCompleted event will include a Duration value, indicating how long the batch ran, but SQL:BatchStarting will not include Duration because it not applicable to that event class. Both of these events will however include a StartTime value, which is common to all events, indicating the time the event occurred.
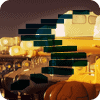
Related event classes are organized by event category, to facilitate locating specific events in Profiler and T-SQL, and the easiest way to see the relationship between trace event categories, classes and columns is via the Events Selection tab in the SQL Server Profiler GUI.
Figure 1.1 shows the Events Selection tab in SQL Server Profiler for the standard template trace. Event Columns with no checkbox (e.g. the CPU column of Security Audit category, Audit Login class) indicate that the column is not applicable to that event class while checkboxes (e.g. the Duration column of Security Audit category, Audit Logout class) indicate that the column may be included.
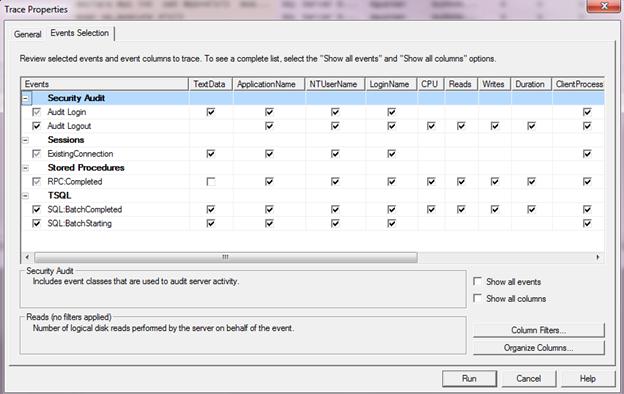
Figure 1.1: Event Selection tab of Trace Properties dialog in Profiler
You might be surprised to learn that you have a trace running on all of your SQL Servers right now, which collects interesting events like Object Deletedand Data/Log File Auto Grow. SQL Server ships with a default server-side trace that is enabled unless you explicitly disable it using sp_configure.
Run the query in code listing 1.1 on any server with a default trace enabled to list all of the event classes and columns collected by the trace, as well as the current file destination. I will discuss the default trace and trace catalog views and functions in detail in a later level.
 --list current file path, events and columns of the default trace
 SELECT  t.id AS TraceId ,
        path AS TraceFilePath ,
        tcat.name AS EventCategory ,
        tevent.name AS EventClassName ,
        tcolumn.name AS ColumnName
 FROM   sys.tracesAS t
        CROSS APPLYFN_TRACE_GETEVENTINFO(t.id) AS tdef
        JOIN sys.trace_events AS tevent ON tdef.eventid = tevent.trace_event_id
        JOIN sys.trace_categories AS tcat ON tcat.category_id = tevent.category_id
        JOIN sys.trace_columns AS tcolumn ON tcolumn.trace_column_id = tdef.columnid
 WHERE   t.is_default = 1 --default trace
        AND t.status= 1 --running
 ORDER BY TraceFilePath ,
        EventCategory ,
        EventClassName ,
        ColumnName ;
Code Listing 1.1: List default trace event classes and columns
Architecture
SQL Trace architecture is fairly straightforward. As illustrated in figure 1.2, instances of a Database Engine event class are captured only when one or more running traces include the event class; other event classes are ignored by SQL Trace and not captured. SQL Trace passes the captured event to each running trace that includes the event class.
The event is then filtered according to the trace definition to include only the specified records and data columns. A filter is a simple condition applied to a trace data column that must be satisfied in order for the event to be included. For example, a filter might specify a particular SPID in order to eliminate noise of other database server activity.
These filtered events are queued in an in-memory buffer for delivery. Finally, the trace process either writes event data directly to a file (server-side trace) or returns event data back to an external client application (client-side trace). Client-side trace applications, like Profiler, interact with SQL Trace through the SMO (SQL Server Management Objects) API classes.
Figure 1.2 - SQL Server with 3 running traces
A trace definition specifies which event classes and data columns are collected, the trace data destination and optional event data filter(s). Defining traces with only pertinent columns helps improve performance and reduce storage requirements. Filters similarly lessen overhead by reducing the number of events that are collected and stored.
Server-Side Tracing versus Profiler
Traces are defined and managed using a set of sp_trace* stored procedures regardless of whether one uses the Profiler graphical interface or a T-SQL script to accomplish the task. The same trace system stored procedures that Profiler calls internally can be executed directly from a T-SQL script to create a server-side trace that runs independently of Profiler. I will discuss these SQL Trace stored procedures in detail in the next level.
Client-side and server-side trace definitions are essentially the same within the database engine, except for the trace data destination. As figure 1.2 shows, a server-side trace always includes a file destination that SQL Server writes to directly. In contrast, a client-side trace definition does not specify a file destination because SQL Server returns filtered trace data back to the client on the same database connection that started the trace; it is up to the client application (e.g. Profiler) to process, display and record data as desired. Profiler extends trace data collection by adding the functionality to display trace data in near real-time and optionally write data to a SQL Server table during collection.
Profiler can also write trace data to a file like a server-side trace but, again, this is done by the Profiler application rather than the database engine in a client-side trace. Table 1.1 summarizes differences between server-side and Profiler client-side tracing functionality.
| Server Side Trace | Profiler Trace | |
| File destination | Yes (required) Written to by database engine | Yes (optional) Written to by client application |
| Display data during collection in near real time | No | Yes (required) |
| Table destination | No | Yes (optional) Written to by client application |
| Unattended collection | Yes | No |
| Trace Definition | T-SQL (sp_trace* stored procedures) | SMO (executes sp_trace* stored procedures internally) |
Table 1.1 - Server-side versus Profiler summary
I should add that you can write a custom SMO SQL Trace application that can do virtually anything with collected trace data. For example, Profiler requires you to display data during collection but your custom SMO app does not need to do so. You could even implement a custom SMO application as a Windows service so that it can run unattended but, like all client-side trace applications, the application must run continuously to process trace data. Such a custom SMO application can process and deliver trace data by any means. The example in Figure 1.2 indicates that Trace 3 sends an email alert when a login failed event occurs.
Tracing Performance
Although server-side and client-side trace definitions are roughly the same, what happens during trace execution has significant performance ramifications. SQL Trace returns data directly to the client application with a client-side trace. Not only must Profiler run continuously in order to process trace data, Profiler incurs the additional overhead of a graphical interface, client-side processing, and streaming trace data across processes or the network. Furthermore, Profiler processes one row at a time on the client side. In contrast, a server-side trace writes large blocks of data directly to a file. The performance differential between client-side and server-side traces can be profound as I will illustrate in a subsequent level.
I often run ad-hoc traces directly from Profiler in development and QA environments where performance isn’t normally a major concern. But I never run Profiler traces against a busy production OLTP server unless I’m certain the impact will be negligible. In fact, I’ve seen DBAs inadvertently cause SQL Server to become completely unresponsive by running a Profiler trace against a busy OLTP database server without adequate attention to event classes and filters. I’ve never seen a server-side trace cause such a problem, though. See http://support.microsoft.com/kb/929728 for a detailed description of this behavior.
Summary
SQL Trace is an invaluable SQL Server feature that provides indispensible information about query execution and database engine events. Server-side SQL Traces are especially useful for traces that run continuously or that might affect database performance when run from Profiler. Profiler is an excellent tool with features not available in server-side traces but is not always the right tool for the job.
In the next topic, How to Create a SQL Trace Using T-SQL, I’ll provide an introduction to the core SQL Server trace stored procedures and catalog views. The topic includes a walkthrough of creating and managing a server-side trace using stored procedures while discussing key parameters.