Many years ago, when I first started working with SQL Server, there were a number of performance counters that were on the radar of all conscientious DBAs, and were used to track SQL Server performance and assess the general health of a server. One of those counters was SQLServer:Buffer Manager\Buffer Cache Hit Ratio, described as follows in the Books Online topic for the SQL Server:Buffer Manager Object:
“Percentage of pages found in the buffer cache without having to read from disk. The ratio is the total number of cache hits divided by the total number of cache lookups over the last few thousand page accesses. After a long period of time, the ratio moves very little. Because reading from the cache is much less expensive than reading from disk, you want this ratio to be high. Generally, you can increase the buffer cache hit ratio by increasing the amount of memory available to SQL Server.”
Commonly, this definition is interpreted like this: if the value of the Buffer Cache Hit Ratio (BCHR) counter is “high”, then SQL Server is efficiently caching the data pages in memory, reads from disk are relatively low, and so there is no memory bottleneck. Conversely, if the BCHR value is “low”, then this is a sure sign sign that SQL Server is under memory pressure and doing lots of physical disk reads to retrieve the required data. Prevailing wisdom suggests that “low” is less than 95% for OLTP systems, or less than 90% for OLAP or data warehouse systems.
This article will, I hope, convince you that this interpretation of the BCHR counter value is completely incorrect and very misleading. In fact, I will prove that it’s entirely possible for SQL Server to be under significant memory pressure while displaying a value for BCHR that, viewed in isolation, would lead a DBA to assume that SQL Server was in fine heath. At the same time, I’ll demonstrate that there are far better counters for tracing memory usage patterns in SQL Server and for diagnosing potential memory issues.
As a consultant, the BCHR is one performance counter that I never use in my work, and I stopped using it as soon as I discovered exactly why its value can be so misleading, and how misguided were the prevailing ideas about its meaning.
Necessary memory-related counters
In my recent book on Troubleshooting SQL Server, I stress time and again that no single piece of information should be relied on to accurately diagnose a SQL Server problem. Unfortunately, many DBAs still do regard the BCHR counter value, viewed in isolation, as a useful indicator of the heath of a SQL Server. Not only does this lead people to misdiagnose SQL Server performance, it also means that they are ignoring counters that could give vital supporting evidence, and in fact are often much more effective at tracking down memory issues. These memory counters, all belonging to the SQLServer:Buffer Manager object, include the following (definitions extracted from the previous Books Online link):
- Page reads/sec – Number of physical database page reads that are issued per second. This statistic displays the total number of physical page reads across all databases. Because physical I/O is expensive, you may be able to minimize the cost, either by using a larger data cache, intelligent indexes, and more efficient queries, or by changing the database design
- Free Pages – Total number of pages on all free lists (free lists track all of the pages in the buffer pool that are not currently allocate to a data page, and are therefore available for usage immediately)
- Page Life Expectancy – Number of seconds a page will stay in the buffer pool without references
- Free List Stalls/sec – Number of requests per second that had to wait for a free page
Consider, for example, the SQLServer:Buffer Manager\Page reads/sec counter. Without full knowledge of what the BCHR counter value really means, it seems reasonable to assume that if the BCHR value is high, then the Page reads/sec counter value should be low, since the high BCHR means that we don’t have to hit disk to retrieve the required data, right? Let’s find out!
Set up: databases, tables, memory counters and a load generator
To investigate the true nature of the BCHR, we’ll need to perform some tests on an isolated instance of SQL Server. In my tests, I used a dedicated VM, with SQL Server Agent in a stopped state, and no other activity on at all on the instance, aside from the tests themselves.
To follow along with this demo, you’ll need to install on your test instance the AdventureWorks and AdventureWorks2008R2 databases, both downloadable from Codeplex. In addition, you’ll need to run the script in Listing 1 to create the LowBCHR test database, and in it a sample table, TestTable, of a known size.
|
1 2 3 4 5 6 7 8 9 10 11 12 13 14 15 16 17 18 19 20 21 22 23 24 25 26 27 28 29 |
CREATE DATABASE [LowBCHR] GO ALTER DATABASE [LowBCHR] SET RECOVERY SIMPLE GO USE LowBCHR GO CREATE TABLE TestTable ( RowID BIGINT IDENTITY PRIMARY KEY , JoinVal BIGINT DEFAULT ( 0 ) NOT NULL , DateChange DATETIME2 DEFAULT ( CURRENT_TIMESTAMP ) NOT NULL , DataCol NCHAR ( 500 ) DEFAULT ( 'BCHR' ) ) GO BEGIN TRANSACTION DECLARE @i INT = 1 WHILE @i <= 30000 BEGIN INSERT INTO TestTable ( JoinVal ) VALUES ( @i % 10 ) SET @i = @i + 1 END COMMIT TRANSACTION CHECKPOINT GO 40 |
Listing 1: Creating the sample LowBCHR database and TestTable table
This TestTable table is larger than 1GB in size, as confirmed in Listing 2, using the sp_spaceused built-in stored procedure.
|
1 2 3 |
-- Get table space usage EXEC sp_spaceused 'TestTable' GO |
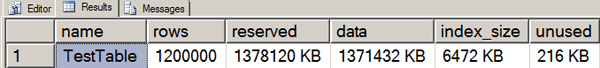
Listing 2: TestTable is over 1GB in size
In Listing 3, we set ‘max server memory‘ option on the instance to 1024 MB, a value lower than the size of the table, meaning that SQL Server can’t cache the whole table in memory. We then clear all the caches on the instance so that we have a cold system against which to run our tests.
|
1 2 3 4 5 6 7 8 9 10 11 12 13 14 15 16 17 18 19 20 21 22 23 |
-- Save this value to reset it after testing SELECT value_in_use AS original_max_server_memory FROM sys.configurations WHERE name = 'max server memory (MB)' GO -- Reduce BPool to 1GB, smaller than our table EXEC sys. sp_configure N'show advanced options' , N'1' RECONFIGURE WITH OVERRIDE GO EXEC sys. sp_configure N'max server memory (MB)' , N'1024' GO RECONFIGURE WITH OVERRIDE GO EXEC sys. sp_configure N'show advanced options' , N'0' RECONFIGURE WITH OVERRIDE GO -- Clear all caches on the server DBCC FREEPROCCACHE DBCC DROPCLEANBUFFERS DBCC FREESYSTEMCACHE ( 'ALL' ) GO |
Listing 3: Setting max server memory to 1024 MB and clearing the caches
Next, we need to generate our performance counter collection set in Windows, in order to capture the BCHR values, along with the Page reads/sec counter values, and those of Free Pages, Page Life Expectancy, and Free List Stalls/sec, all from the SQLServer: Buffer Manager object.
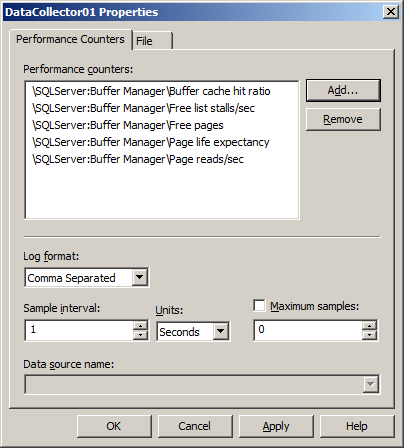
Figure 1: Setting up the performance counter collection set in Windows
With the collection set created we are ready to begin logging the counter values, as we execute various SQL loads against the instance. In my test, I generated this load using a tool called SQL Load Generator, which is freely downloadable from Codeplex. If you wish to follow along, you’ll need to download this tool, or something similar (if you don’t want to install a tool you may be able to achieve similar effects using the GO x trick and lots of SSMS tabs!)
Testing the behavior of BCHR
We’ll run a series of tests to investigate the behavior of BCHR, under various workloads and conditions. A variable query load, comprising three queries, will be executed against three different databases. In these tests, the load was generated using the previously-referenced SQL Load Generator tool. The query in Listing 4 will be executed against both the AdventureWorks and AdventureWorks2008R2 databases.
|
1 2 3 4 |
SELECT * FROM Sales.SalesOrderHeader AS soh JOIN Sales.SalesOrderDetail AS sod ON soh.SalesOrderID = sod.SalesOrderID ; |
Listing 4: The query against AdventureWorks and AdventureWorks2008R2
This will be the “base” workload in our tests. When we need create some memory pressure, we’ll introduce to the workload the query in Listing 5, which executes against TestTable in our LowBCHR database.
|
1 2 3 4 |
SELECT SUM ( t1.RowID ) , SUM ( t2.JoinVal ) FROM TestTable AS t1 JOIN TestTable AS t2 ON t1.RowID = t2.JoinVal ; |
Listing 5: The query against the LowBCHR database
Test 1: Behavior under base test load
With the system still idle, start the performance counter data collection; the counter values should be stable at this point.
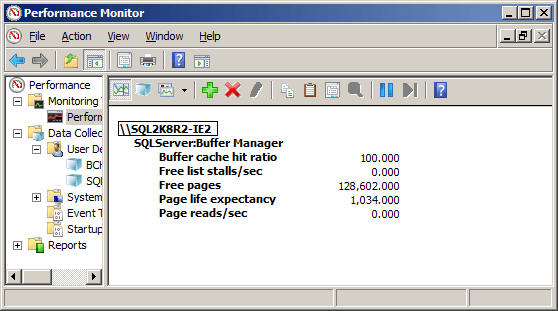
Figure 2: Initial, stable values of the performance counters
BCHR will be at 100%, Free Pages will be high (it depends on your specific system, but on the test system it was in the 128,602 range after freeing the caches), and Page Life Expectancy will increase by one for each second that passes (the starting value on my test system was 1034).
To create our initial workload, the query in Listing 4 will be run against AdventureWorks and AdventureWorks2008R2. This will cause roughly 20MB per database to be read from disk into the buffer pool.
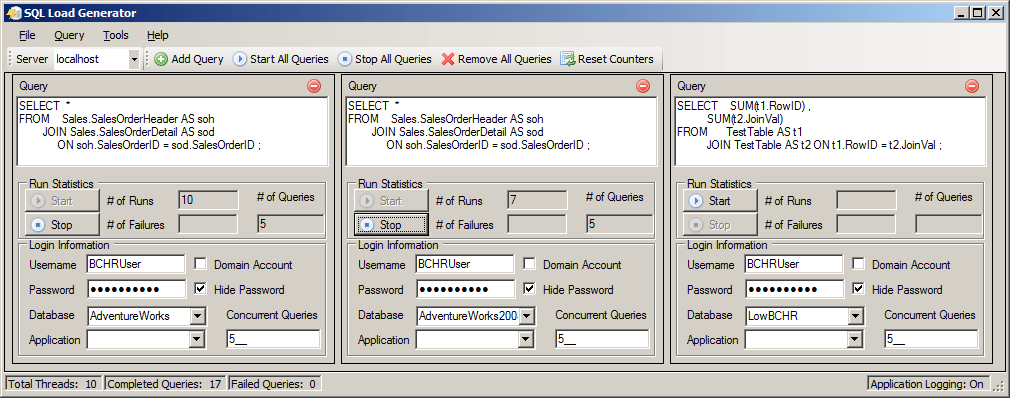
Figure 3: Starting the initial data load (click through for detail)
When the queries begin execution, you should see an initial dip in the BCHR value, on the instance, and a corresponding spike in page reads/sec, as the required pages are read from disk, into the buffer cache, as shown in the data collected by Performance Monitor (Figure 4).
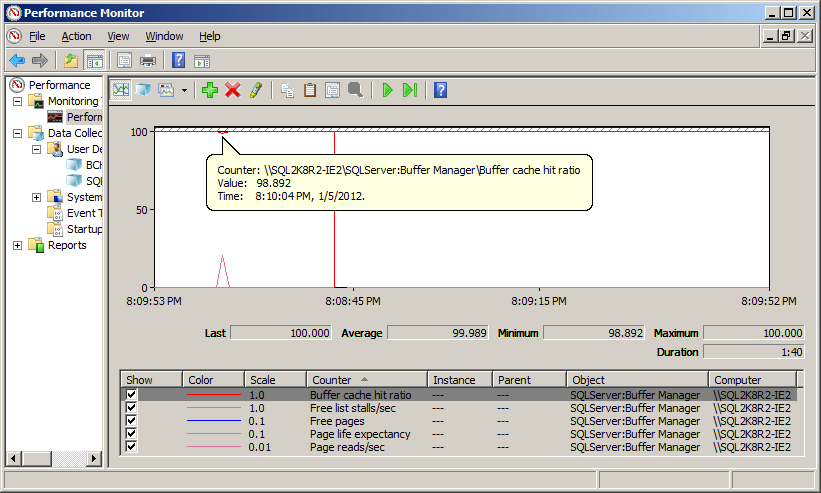
Figure 4: Memory counter behavior under initial load
However, the Page Life Expectancy continues to increase by a value of one every second and, even though the two queries continue to execute against the databases, the system shows near-zero impact aside from that initial drop in BCHR.
Test 2: Behavior under maximum test load
The behavior observed in the initial test is what people generally expect with regards to BCHR value, and it shapes many people’s understanding of what the value is telling them. If this is the case with you, then prepare for a shock as, alongside our other two queries, we start up the third query against our LowBCHR database, and generate some serious memory pressure!
The TestTable query (Listing 5) is going to require a full scan of the table, and the table is larger than the available buffer pool size, because we constrained ‘max server memory‘ to 1GB. Bear in mind that the queries against the AdventureWorks and AdventureWorks2008R2 tables will also be competing for this 1 GB of buffer pool memory.
With the other queries still running, introduce to the load the TestTable query, simulating five concurrent sessions executing the query. The impact on our counter values is shown in Figure 5.
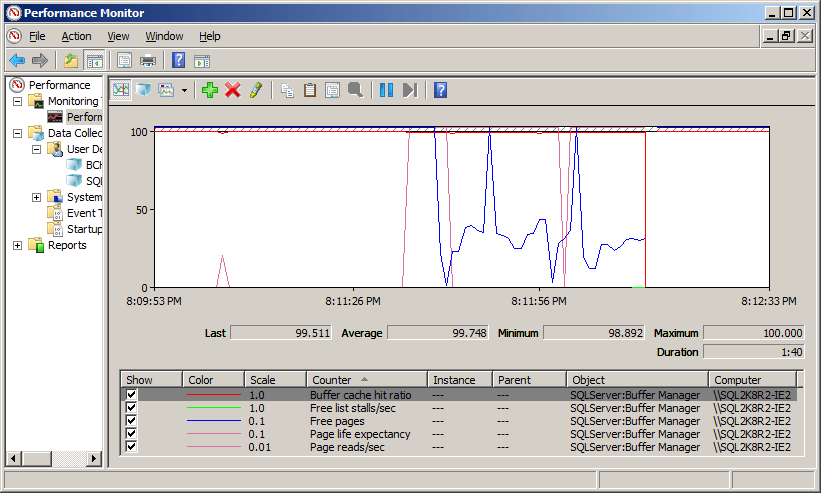
Figure 5: Memory counter behavior under memory pressure
Imagine for a second that we were only monitoring the BCHR value; as you can see, it shows barely a blip, staying comfortably above the “recommended” 95% value the entire time. According to this, our server is just fine.
The other counters, however, reveal the true story: our server is under significant memory pressure and experiencing constant data cache churn, as evidenced by the fact that Page Life Expectancy bottoms out at 0 to 1, the number of page reads/sec skyrockets, and the number of Free Pages fluctuates but is generally below 200 for the duration of the test. Figure 6 shows a snapshot report of each counter value, at some point during the test.
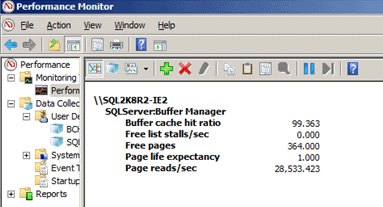
Figure 6: Snapshot counter values during Test 2
So why does the BCHR counter value fail to respond to the memory pressure? The reason is that the read-ahead mechanism in SQL Server, is keeping our buffer cache populated with the required pages. As long as the disk array can keep up with the I/O demands of the query workload, and the read-ahead I/Os can read the data in large enough blocks to keep the data churning in cache, then the required data will continue to be found in cache, rather than on disk, at the point that it is needed during the query’s execution by the query processor. As such, the BCHR will remain above 95%.
Test 3: Behavior under base test load with read-ahead disabled
The results of the previous test demonstrates that all the BCHR value really tells us is whether or not the read-ahead mechanism is operating efficiently; it tells us nothing of the memory pressure, and buffer cache churn, that the server may be experiencing.
To prove this, we can disable the read-ahead mechanism in SQL Server using Trace Flag 652, and then rerun our tests. Alternatively, we could also place our LowBCHR database on an incredibly slow disk array, for example a USB thumb drive, instead of the internal SSDs in my laptop, to significantly reduce the I/O throughput available for read-ahead operations.
To prepare for this test, flush the data caches once again using the relevant code from Listing 3, and then capture another initial counter baseline for the instance, as shown in Figure 7, which was taken after waiting a few minutes to allow the Page Life Expectancy to recover.

Figure 7: Initial counter baseline for Test 3
As soon as we enable Trace Flag 652 for the entire instance, using DBCC TRACEON(652, -1), we take a hit on the BCHR that is higher than any of the previous hits taken during our tests, as shown in Figure 8. The cause of this dip isn’t entirely clear (since there is no activity on the server at this stage) but it is reproducible.
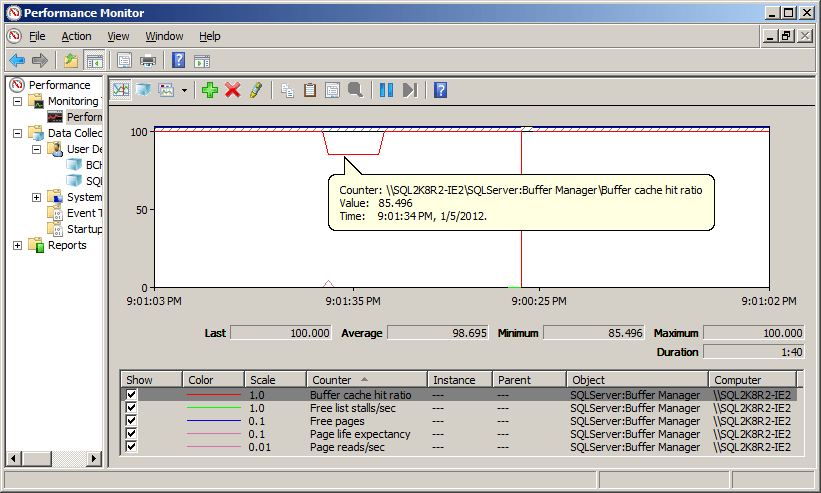
Figure 8: Perform counter value variation upon enabling Trace Flag 652
Wait a few minutes to allow the BCHR value to recover and then, in SQL Load Generator, start the two queries against AdventureWorks and AdventureWorks2008R2, as per Test 1 (Figure 3).
The dip in the BCHR value is bigger than we observed in Test 1, but it recovers quickly, as shown in Figure 9.
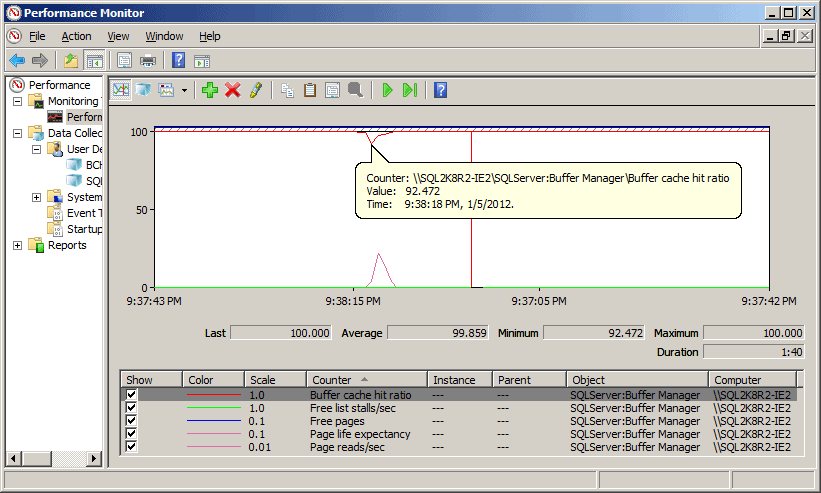
Figure 9: Memory counter values: behavior under base load, with read-ahead disabled
Test 4: Behavior under increased load (read-ahead disabled)
With the two queries still running, start the third query against TestTable, but using only a single session, as shown in Figure 10.

Figure 10: Introducing the TestTable query to the workload (1 session)
This time, with page read-ahead disabled, the BCHR value for the instance drops below the accepted value (to a value of around 90-91% in my tests), and remains there for the duration of the test. Figure 11 was taken after running the three queries for nearly 20 minutes.
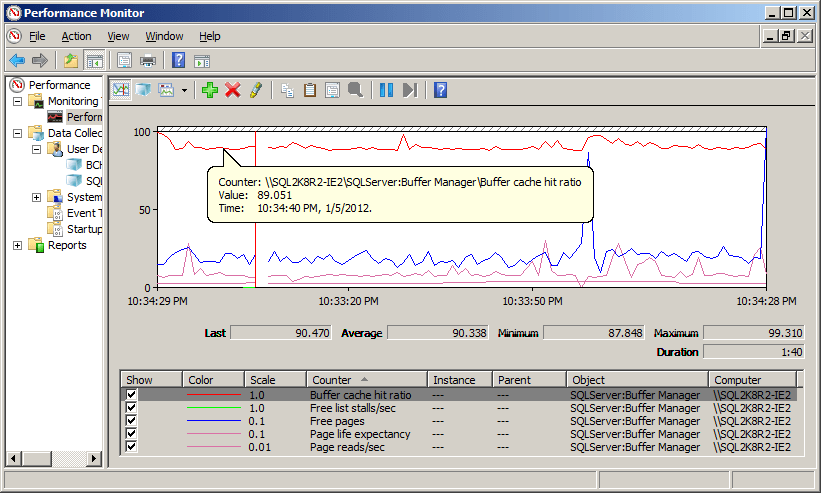
Figure 11: Memory counter values after 20 mins increased load, with read-ahead disabled
Test 5: Behavior under maximum test load (read-ahead disabled)
Finally, let’s up the memory pressure one more notch, by changing the setup of the SQL Load Generator to use five concurrent sessions for the TestTable query, replicating the conditions of our “maximum load” in Test 2.
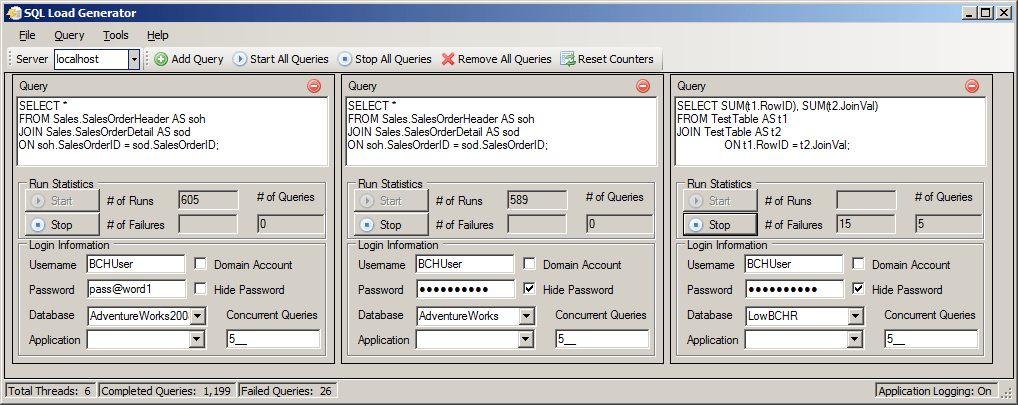
Figure 12: Maximum TestTable workload (5 concurrent sessions)
Remember that under this same load, with read-ahead enabled, we saw almost no impact on the values of the BCH counter. Performing the same test with read-ahead disabled, the impact on the BCHR value is very significant. As soon as multiple copies of the TestTable query are running concurrently, without read ahead enabled, the BCHR value bottoms out and never recovers completely. As shown in Figure 13, it is consistently low and has multiple near zero values that occur for long durations. In conjunction with the behavior of the other counter values (very high page reads/sec, zero page life expectancy) this indicates, that for certain periods, the query processor is having to wait entirely on the pages to be read from disk and into cache, in order to execute any of the 15 concurrent requests in the test workload.
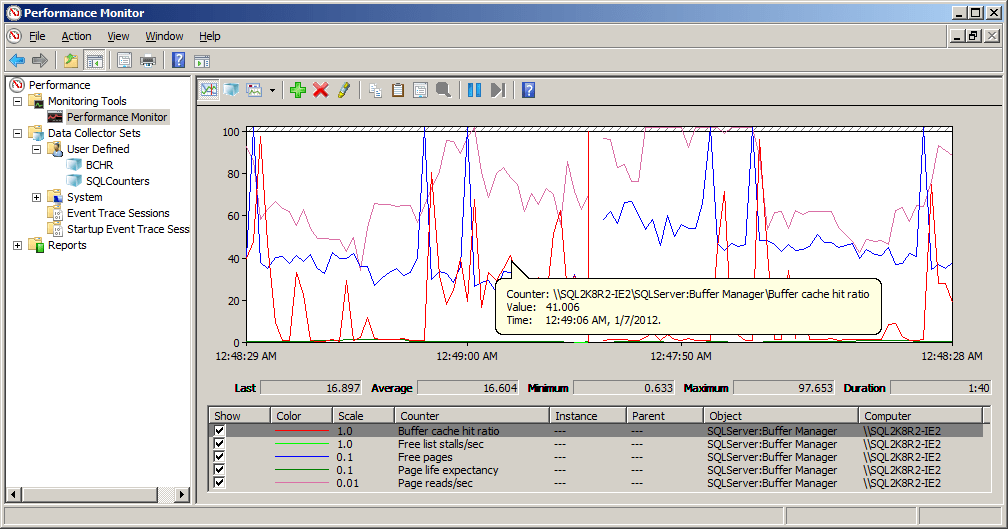
Figure 13: Memory counter values under maximum test load (read-ahead disabled)
My laptop test machine has a quad core i7 processor and dual solid state drives, with very low latency I/O response, but even so, as a result of the memory pressure and without the benefits of read ahead I/O operations, the pages generally weren’t in memory before they were required by the query processor for execution. In these tests, the I/O for the LowBCHR database was consistently 8K average per read (although this isn’t to suggest that there might not be conditions where it is still possible to get to get multi-page I/O or extent based I/O).
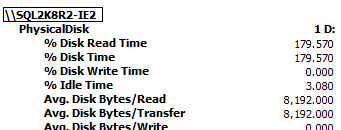
Figure 14: With read-ahead disabled we see 8K average per read
If we re-enable read ahead with DBCC TRACEOFF(652, -1), the BCHR value once again returns to the ‘acceptable’ range.
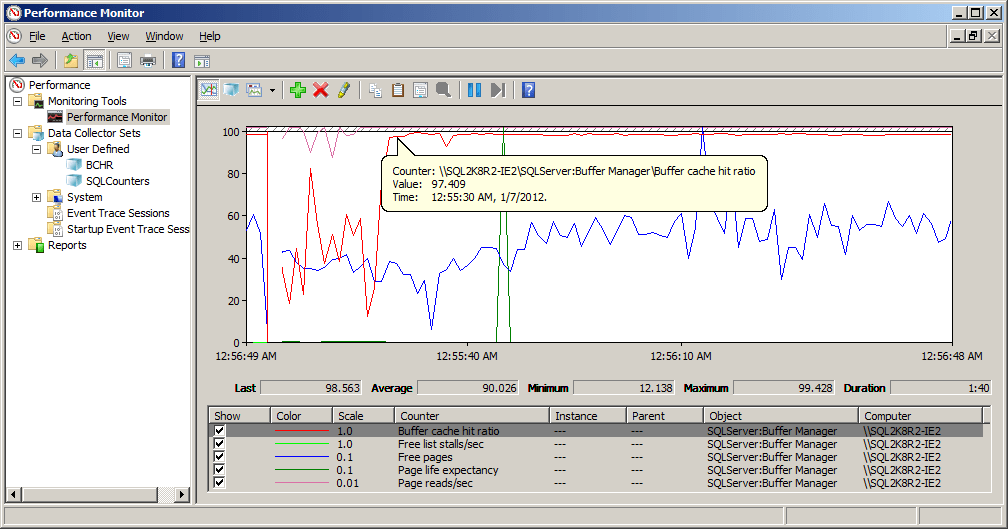
Figure 15: Recovery of counter values, upon re-enabling read-ahead
Conclusions
Many people continue to track the value of Buffer Cache Hit Ratio, as an “early-warning” of any potential memory issues on a SQL Server instance. What these tests prove, I hope, is that, in this regard, the value of BCHR is more or less meaningless. BCHR only responds to significant memory pressure in conjunction with I/O subsystem pressure, or possibly fragmentation i.e. under conditions that impedes page read-ahead to the point that SQL Server becomes much less effective at populating the data cache with the required pages, before the query processor actually requires them for use.
To put it another way, the BCHR early warning alert is only raised once the house is already burning down. At the point that the BCHR has sustained values below 95 for an OLTP workload, the server has been experiencing significant performance problems for a long time, and the use of the other counters on the system would have yielded better results for diagnosing the problem.

Load comments