It’s not enough that your code is readable: it must perform well too.
There are three very basic rules for writing T-SQL that performs. They are cumulative. Doing all of these will have a positive impact. Skipping or changing any of these is likely to have a negative impact on your code’s performance.
- Write to your data structures: If you are storing a datetime data type, use that, not a varchar or something else. Also take advantage of the foreign key constraints and other structures that you have in place when you’re writing your T-SQL code
- Write for your indexes: If there are indexes on your tables, and there should be, write your code so that it can take advantage of those indexes. Make sure that your clustered index, you only get one, is working well to help drive your queries to your data in an efficient manner.
- Write for the optimizer: The query optimizer is an amazing piece of software. But, you can overwhelm it by writing code that isn’t configured best to support it, such as nesting views within views within views, etc. Take the time to understand how the optimizer works and write your code in such a way that you help it, not hurt it.
Then, there are some very specific and common mistakes that people make in their T-SQL code. Just don’t do these and you’ll be much better off.
Using the wrong data types
This is surprisingly simple in concept, but seems to be incredibly difficult in practice. Here you go… use the data type that is in your database. Use it in your parameters and in your variables. I know that SQL Server can implicitly convert from one to another. But when you get implicit conversions, or you have to put in explicit conversions, you’re performing a function on your columns. When you perform a function on your columns in any of the filtering scenarios, that’s a WHERE clause or JOIN criteria, you’re looking at generating table scans. You may have a perfectly good index, but because you’re doing a CAST on the column in order to compare to a character type that you passed in instead of a date, that index won’t get used.
Don’t believe me? Check this query:
|
1 2 3 4 |
SELECT e.BusinessEntityID, e.NationalIDNumber FROM HumanResources.Employee AS e WHERE e.NationalIDNumber = 112457891; |
Nice & simple. Should be covered by an index on the table. But here’s the execution plan:
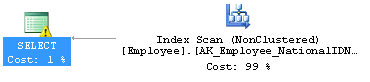
This query ran fast enough, and the table is small, so there were only 4 reads to scan the entire thing. Notice that little exclamation point on the SELECT operator though. What do the properties tell us:
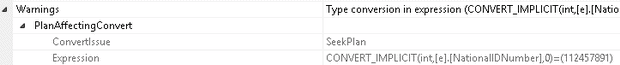
That’s right. It’s a warning (new in SQL Server 2012) that you have a “PlanAffectingConvert.” In short, because I didn’t use the correct data type:
|
1 2 3 4 |
SELECT e.BusinessEntityID, e.NationalIDNumber FROM HumanResources.Employee AS e WHERE e.NationalIDNumber = '112457891'; |
I didn’t get a plan that looked like this:
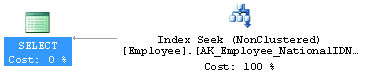
And there were only 2 reads this time instead of 4. And yes, I realize I only cut performance from a little to a very little, but what if that table had millions of rows instead of only a few? Ah, now I’m suddenly a hero.
Use the correct data types.
Using Functions in Comparisons within the ON or WHERE Clause
Speaking of functions, many, most, of the functions that you run against your columns in WHERE and ON clauses will prevent the proper use of indexes. You will see slower performance since SQL Server has to perform scans against the data in order to take into account your function. For example this:
|
1 2 3 4 5 6 |
SELECT a.AddressLine1, a.AddressLine2, a.City, a.StateProvinceID FROM Person.Address AS a WHERE '4444' = LEFT(a.AddressLine1, 4) ; |
That function, the LEFT operation on the column, results in this execution plan:

This took 316 reads to find the correct data over about 9ms (I have very fast disks), all because it must process each and every row to determine where the information matches the function. It can’t simply scan within the existing data. But, not all functions are created equal. You can do something like this:
|
1 2 3 4 5 6 |
SELECT a.AddressLine1, a.AddressLine2, a.City, a.StateProvinceID FROM Person.Address AS a WHERE a.AddressLine1 LIKE '4444%' ; |
Which results in a very different execution plan:
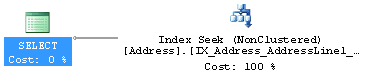
This resulted in 3 reads and 0ms. Let’s call it 1ms just to be fair. That’s a huge performance increase. All because I used a function that could work with search arguments. The old term for this, not used much any more, is sargeable. Either don’t use functions in comparisons, or use ones that are sargeable.
Employing Multi-Statement User Defined Functions (UDFs)
These things are a trap. It appears, at first blush, like this marvelous mechanism that’s going to allow you to use T-SQL like a real programming language, not just a scripting language. You can build these functions and then have them call each other and your code will be very reusable, unlike those nasty old stored procedures. It’ll be a glory… Until you try to run your code with more than a few rows.
The problem here is that the multi-statement user defined function (UDF) is designed around the table variable. Table variables are very cool things for what they’re meant to do. They have one distinct difference from temporary tables, table variables have no statistics. This can be a time saving, even a life-saving difference… or… it can kill you. If you don’t have statistics, the optimizer assumes that any query run against the table variable, or UDF, will result in a single row. One (1) row. That’s great if you’re only returning a few rows. But once you start returning hundreds, or thousands, and you’ve decided to join one UDF to another… performance drops very, very quickly and very, very far.
The examples here are somewhat long. Here are a series of UDFs:
|
1 2 3 4 5 6 7 8 9 10 11 12 13 14 15 16 17 18 19 20 21 22 23 24 25 26 27 28 29 30 31 32 33 34 35 36 37 38 39 40 41 42 43 44 45 46 47 48 49 50 51 52 53 54 55 56 57 58 59 60 61 62 63 64 65 66 67 68 69 70 71 72 73 74 75 76 77 78 79 80 81 82 83 84 85 86 87 88 89 90 91 92 93 94 |
CREATE FUNCTION dbo.SalesInfo () RETURNS @return_variable TABLE ( SalesOrderID INT, OrderDate DATETIME, SalesPersonID INT, PurchaseOrderNumber dbo.OrderNumber, AccountNumber dbo.AccountNumber, ShippingCity NVARCHAR(30) ) AS BEGIN; INSERT INTO @return_variable (SalesOrderID, OrderDate, SalesPersonID, PurchaseOrderNumber, AccountNumber, ShippingCity ) SELECT soh.SalesOrderID, soh.OrderDate, soh.SalesPersonID, soh.PurchaseOrderNumber, soh.AccountNumber, a.City FROM Sales.SalesOrderHeader AS soh JOIN Person.Address AS a ON soh.ShipToAddressID = a.AddressID ; RETURN ; END ; GO CREATE FUNCTION dbo.SalesDetails () RETURNS @return_variable TABLE ( SalesOrderID INT, SalesOrderDetailID INT, OrderQty SMALLINT, UnitPrice MONEY ) AS BEGIN; INSERT INTO @return_variable (SalesOrderID, SalesOrderDetailId, OrderQty, UnitPrice ) SELECT sod.SalesOrderID, sod.SalesOrderDetailID, sod.OrderQty, sod.UnitPrice FROM Sales.SalesOrderDetail AS sod ; RETURN ; END ; GO CREATE FUNCTION dbo.CombinedSalesInfo () RETURNS @return_variable TABLE ( SalesPersonID INT, ShippingCity NVARCHAR(30), OrderDate DATETIME, PurchaseOrderNumber dbo.OrderNumber, AccountNumber dbo.AccountNumber, OrderQty SMALLINT, UnitPrice MONEY ) AS BEGIN; INSERT INTO @return_variable (SalesPersonId, ShippingCity, OrderDate, PurchaseOrderNumber, AccountNumber, OrderQty, UnitPrice ) SELECT si.SalesPersonID, si.ShippingCity, si.OrderDate, si.PurchaseOrderNumber, si.AccountNumber, sd.OrderQty, sd.UnitPrice FROM dbo.SalesInfo() AS si JOIN dbo.SalesDetails() AS sd ON si.SalesOrderID = sd.SalesOrderID ; RETURN ; END ; GO |
This is a great structure. It makes putting together queries very simple. Here’s an example:
|
1 2 3 4 5 6 7 8 |
SELECT csi.OrderDate, csi.PurchaseOrderNumber, csi.AccountNumber, csi.OrderQty, csi.UnitPrice FROM dbo.CombinedSalesInfo() AS csi WHERE csi.SalesPersonID = 277 AND csi.ShippingCity = 'Odessa' ; |
That is one very simple query. Here’s the execution plan, also very simple:
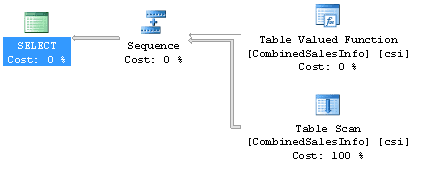
It only took 2170ms to run, returning 148 rows with 1456 reads. Note, that the function is listed as having zero cost and it’s just the scan of the table, a table variable, that is paid for in the query. Or is it? Here’s a little query that will let me get a look at what’s going on behind that zero cost function operator. This pulls the plan for the function from the cache:
|
1 2 3 4 5 6 7 8 9 |
SELECT deqp.query_plan, dest.text, SUBSTRING(dest.text, (deqs.statement_start_offset / 2) + 1, (deqs.statement_end_offset - deqs.statement_start_offset) / 2 + 1) AS actualstatement FROM sys.dm_exec_query_stats AS deqs CROSS APPLY sys.dm_exec_query_plan(deqs.plan_handle) AS deqp CROSS APPLY sys.dm_exec_sql_text(deqs.sql_handle) AS dest WHERE deqp.objectid = OBJECT_ID('dbo.CombinedSalesInfo'); |
And here is what is actually going on:
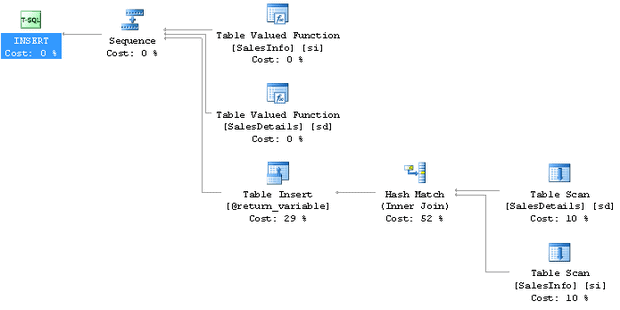
Oops, looks like even more of those little functions and scans that are almost, but not quite, free. Plus a Hash Match operation, which writes out to tempdb and has actual real costs for the SQL engine. Let’s look at one more of those UDF execution plans:
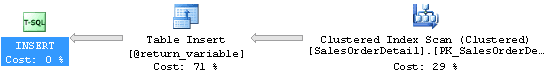
Whoops! Now we’re getting a Clustered Index Scan and quite a large number of rows being scanned. This is not pretty. And there is more than one of these processes occurring. Suddenly, the UDF looks a lot less attractive. What if we were to, oh, I don’t know, just query the tables directly like this:
|
1 2 3 4 5 6 7 8 9 10 11 12 13 14 |
SELECT soh.OrderDate, soh.PurchaseOrderNumber, soh.AccountNumber, sod.OrderQty, sod.UnitPrice FROM Sales.SalesOrderHeader AS soh JOIN Sales.SalesOrderDetail AS sod ON soh.SalesOrderID = sod.SalesOrderID JOIN Person.Address AS ba ON soh.BillToAddressID = ba.AddressID JOIN Person.Address AS sa ON soh.ShipToAddressID = sa.AddressID WHERE soh.SalesPersonID = 277 AND sa.City = 'Odessa' ; |
Now, running this query returns exactly the same rows, but it does it in 310ms instead of 2170ms. We also end up with only about 911 reads instead of the 1456. Clearing, it’s not very hard to have problems with table valued user-defined functions.
The “Run Faster” Switch: Allowing ‘Dirty Reads’
Back in the old days of computing, for some reason, our 286 units came with a button on the front called the Turbo button. If you accidently hit it, suddenly your machine was running extremely slowly. So you made sure that silly thing was always switched on so that you received maximum throughput. Well, a lot of people look up on READ_UNCOMMITTED isolation level and the NO_LOCK query hint as the turbo button for SQL Server. Make sure they’re on every query and your system will run faster. This is because these commands make it so that no locks are taken out by shared reads. Fewer locks mean faster processing, easy. But…
When you run this, you will end up with dirty reads. Everyone assumes this means that ‘dog’ will read ‘cat’ until it gets updated, which is true. But, you’ll also get extra rows, fewer rows, duplicated rows, as the pages are rearranged underneath your query where you have no locks to prevent it. I don’t know about you, but most of the businesses I’ve worked for expect that the most of the queries on most of the systems will return consistent data. Same set of inputs against the same set of values and you get the same results. Not with NO_LOCK. For testing this, I strongly recommend you read this blog post from Jason Strate. He illustrates the issue in perfect clarity
Applying Query Hints indiscriminately
People are just a little too quick to pull the trigger on query hints. The most common situation I’ve seen is when a hint is used to fix one, very distinct problem on one query. But, when the database professionals involved see the improvement in speed, they immediately apply that hint… everywhere.
For example, a lot of people are under the impression that the LOOP JOIN operator is the best for joins. This is because it’s most frequently seen in small, fast queries. So, people will try to force it. It’s not hard:
|
1 2 3 4 5 6 7 8 9 10 |
SELECT s.[Name] AS StoreName, p.LastName + ', ' + p.FirstName FROM Sales.Store AS s JOIN sales.SalesPerson AS sp ON s.SalesPersonID = sp.BusinessEntityID JOIN HumanResources.Employee AS e ON sp.BusinessEntityID = e.BusinessEntityID JOIN Person.Person AS p ON e.BusinessEntityID = p.BusinessEntityID OPTION (LOOP JOIN); |
This query will run in about 101ms.It has 4115 reads. Not bad performance, but if we drop the hint, the same query runs in about 90ms, but it only has 2370 reads. As the system gets under more & more load, this is going to show itself as the much more efficient query.
Here’s another example. This one is slightly contrived, but it gets the point across. People often put an index on their table, expecting it to solve the problem. Here we have a query:
|
1 2 3 |
SELECT * FROM Purchasing.PurchaseOrderHeader AS poh WHERE poh.PurchaseOrderID * 2 = 3400; |
The problem is that you’re running a function against the column, not that any index that has been created is not adequate. The performance stinks because it’s doing a full scan of the clustered index. But when people see that the index they just created is not getting used, they do this:
|
1 2 3 |
SELECT * FROM Purchasing.PurchaseOrderHeader AS poh WITH (INDEX (PK_PurchaseOrderHeader_PurchaseOrderID)) WHERE poh.PurchaseOrderID * 2 = 3400; |
Now, they’re getting an index scan instead of a clustered index scan, so the index is being “used” now right? But performance changed, going from 11 reads to 44 reads (time was both near 0ms, I have fast disks). Used is the term, but not the way that was meant. The solution of course is to restructure the query:
|
1 2 3 |
SELECT * FROM Purchasing.PurchaseOrderHeader poh WHERE PurchaseOrderID = 3400 / 2; |
Now the number of reads drops to 2 because the index is being used in a seek, as it was meant to be.
Query hints need to be considered a last resort after all other choices have been eliminated.
Allowing ‘Row By Agonizing Row’ processing
The phrase, Row By Agonizing Row, is shortened to RBAR (pronounced rebar). This comes from using cursors or WHILE loops instead of set-based operations. This leads to extremely slow performance. The use of cursors comes from two sources. Either developers who, appropriately so, are used to row by row processing in their code, or Oracle people, who think that cursors are a good thing (guys, SQL Server cursors are hidden in the execution plan). Either way, cursors are quick performance death.
The example is pretty straight-forward. We’re going to update the color of products where they match a certain criteria. Is this contrived? No, actually, it’s based on real code that I had to tune:
|
1 2 3 4 5 6 7 8 9 10 11 12 13 14 15 16 17 18 19 20 21 22 23 24 25 26 27 28 29 30 31 32 33 |
BEGIN TRANSACTION DECLARE @Name NVARCHAR(50) , @Color NVARCHAR(15) , @Weight DECIMAL(8, 2) DECLARE BigUpdate CURSOR FOR SELECT p.[Name] ,p.Color ,p.[Weight] FROM Production.Product AS p ; OPEN BigUpdate ; FETCH NEXT FROM BigUpdate INTO @Name, @Color, @Weight ; WHILE @@FETCH_STATUS = 0 BEGIN IF @Weight < 3 BEGIN UPDATE Production.Product SET Color = 'Blue' WHERE CURRENT OF BigUpdate END FETCH NEXT FROM BigUpdate INTO @Name, @Color, @Weight ; END CLOSE BigUpdate ; DEALLOCATE BigUpdate ; SELECT * FROM Production.Product AS p WHERE Color = 'Blue' ; ROLLBACK TRANSACTION |
Not only is there no real possibility of code reuse, but we’re doing 2 reads on every single loop of this operation, for all the rows in the system for a total in the hundreds. Execution time on my machine with no other load in place is well over a second. It’s insane. The set-based operation is pretty simple:
|
1 2 3 4 5 6 7 |
BEGIN TRANSACTION UPDATE Production.Product SET Color = 'BLUE' WHERE [Weight] < 3 ; ROLLBACK TRANSACTION |
Here you get 15 reads and 1ms execution. Don’t laugh. People really do stuff like this, and worse. Cursors are just something to be avoided outside of areas where you have no choice, like maintenance routines that have walk tables or databases.
Indulging in Nested Views
Views which call views that join to views which are calling other views… A view is nothing but a query. But, because they appear to act like tables, people can come to think of them as tables. They’re not. What happens when you combine a view with a view and then nest them inside each other, etc., is that you’ve just created an incredibly complex execution plan. The optimizer will attempt to simplify things. It will try to come up with plans that don’t use every table referenced. But, it will only attempt to clean up your plans so many times. The more complex they get, the less likely that you’ll get a cleaned up plan. Then, performance becomes extremely problematic and inconsistent.
Here are a series of fairly simple queries defined as views:
|
1 2 3 4 5 6 7 8 9 10 11 12 13 14 15 16 17 18 19 20 21 22 23 24 25 26 27 28 29 30 31 32 33 34 |
CREATE VIEW dbo.SalesInfoView AS SELECT soh.SalesOrderID, soh.OrderDate, soh.SalesPersonID, soh.PurchaseOrderNumber, soh.AccountNumber, a.City AS ShippingCity FROM Sales.SalesOrderHeader AS soh JOIN Person.Address AS a ON soh.ShipToAddressID = a.AddressID ; CREATE VIEW dbo.SalesDetailsView AS SELECT sod.SalesOrderID, sod.SalesOrderDetailID, sod.OrderQty, sod.UnitPrice FROM Sales.SalesOrderDetail AS sod ; CREATE VIEW dbo.CombinedSalesInfoView AS SELECT si.SalesPersonID, si.ShippingCity, si.OrderDate, si.PurchaseOrderNumber, si.AccountNumber, sd.OrderQty, sd.UnitPrice FROM dbo.SalesInfoView AS si JOIN dbo.SalesDetailsView AS sd ON si.SalesOrderID = sd.SalesOrderID ; |
You get a query that runs in about 155ms and does 965 reads against two tables. Here’s the execution plan:
Looks pretty benign really. You’re returning 7000 rows, so this is not completely out to lunch. But what if we just ran this query instead:
|
1 2 3 |
SELECT soh.OrderDate FROM Sales.SalesOrderHeader AS soh WHERE soh.SalesPersonID = 277 ; |
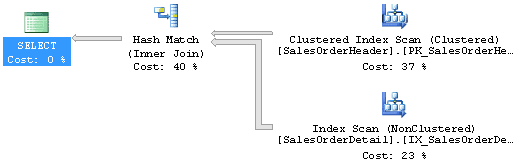
Now we’re looking at 3ms and 685 reads. That’s radically different. Here’s the execution plan:
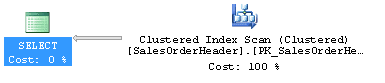
What you’re seeing is the fact that, try though it might, the optimizer couldn’t eliminate every table from the query as part of it’s simplification process. So you have two extra operations in your query, the Index Scan and the Hash Match join that puts it all together. You’d be so much better off avoiding that work by writing your queries directly rather than using views. And remember, this example is very simple. Most examples I see of this are much more complex, resulting in much worse performance.
If you have enjoyed this article, we suggest you take a look at Grant’s humorous video on the importance of verifying your backups.

Load comments