A common problem when looking at execution plans is attributing too much meaning and value of the costs of operators.
The percentages shown for operators in query plans are based on costs generated by the query optimiser. They are not times, they are not CPU usage, they are not IO.
The bigger problem is that they can be completely incorrect.
Before digging into the why of incorrect percentages, let’s take a step back and look at why those costs exist.
The SQL query optimiser is a cost-based optimiser. It generates good plans by estimating costs for each query operator and then trying to minimise the total cost of the plan. These costs are based on estimated row counts and heuristics.
The costs we see in the query plan are these compilation time cost estimates. They’re compilation-time estimations, which means that they won’t change between one execution of a query using a particular plan and another query using the same plan, even if the parameter values are different, even if the row counts through the operators are different.
Since the estimations are partially based on those row counts, that means that any time the query runs with row counts different to what were estimated, the costs will be wrong.
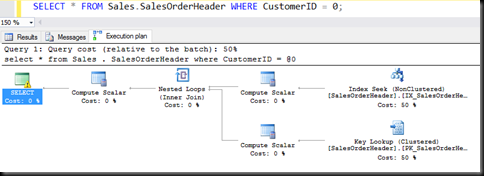
Let’s look at a quick example of that.
There are no customers with an ID of 0, so the plan is generated with an estimation of one row being returned by the index seek, and one row looked up to the clustered index. Those are the only two operators that do any real work in that plan, and each is estimated to read and fetch just one row, so each gets an estimation of 50% of the cost of the entire query (0.0033 it be specific)
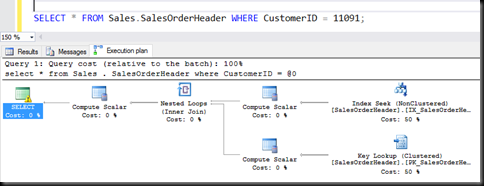
Run the same query with a different parameter value, plans are reused and so the costs are the same.
That parameter returns 28 rows, the index seek is probably much the same cost, because one row or 28 continuous rows aren’t that different in work needed. The key lookup is a different matter. It’s a single-row seek always, so to look up 28 rows it has to execute 28 times, and hence do 28 times the work. It’s definitely no longer 50% of the work of executing the query.
The costs still show 50%, because they were generated for the 0-row case and displayed here. They’re not run-time costs, they’re compile time, tied to the plan.
Another thing can make the cost estimations inaccurate, and that’s incorrect costing calculations by the optimiser. Scalar user-defined functions are the easiest example there.
The first query there, the one that’s apparently 15% of the cost of the batch, runs in 3.2 seconds. The second runs in 270 ms.
The optimiser gives scalar UDFs a very low cost (they have their own plans, with costs in them though) and so the costs for the rest of the query and batch are meaningless.
The costs in a plan may give some idea what’s going on, but they’re not always correct, and should not be obsessed over, especially not when the plan’s a simple one with only a couple of operators. After all, the cost percentages add to 100% (usually).


