

One of the things I enjoy about my job is when I have to develop or review some T-SQL code, for my own projects or reviewing someones else code. In both cases, you often have to tune some queries or review them to see if there is room for some performance improvement.
An Execution plan is the method SQL Server engine will choose to execute (or would use if is an estimated plan) any given query based on the object indexes and statistics, server load, parameters, tables involved, operators, conversions, to provide the optimal execution time and the minimum resource usage. For human analysis, these are stored on .sqlplan or .xml extensions so you can save and analyze them later or on another machine from where it was generated.
For this type of analysis, you need to check execution plans, and it is important that you know how to generate and save them to be shared or for later analysis. On this post, we will discuss a wide range of the options you have to generate and save an execution plan.
1. Using SSMS
Just select the Include Actual Execution Plan (Ctrl +M) on the toolbar as follows:
To save the execution plan
Right Click on the execution plan and select Save Execution Plan As...
2. Using SQL Server Operations Studio
When executing a query select the Explain option at the right:
3. Using T-SQL: SHOWPLAN_TEXT
This method represents the execution plan in a text format, using rows in a hierarchical tree representation.
Useful when you don't want a graphical interface or you are using a command line tool.
To enable it, just execute the following statement at the beginning of your code, and set if off once done:
SET SHOWPLAN_TEXT ON;
GO

-- YOUR QUERY GOES HERE!
GO

SET SHOWPLAN_TEXT OFF;
GO
Please note that using this option, the query is not executed, only the execution plan is generated.
The results look something like this:

4. Using T-SQL: SHOWPLAN_ALL
Similar to the previous method, this one displays the execution plan in a text format, using rows in a hierarchical tree representation.
This option also does not execute the query and provide us with more detailed information than the showplan_text, also useful when using a command-line tool.
To use it, just use the following T-SQL code:
SET SHOWPLAN_ALL ON;
GO

-- Your query goes here!
GO

SET SHOWPLAN_ALL OFF;
GO
And these are the results:
5. Using T-SQL: SHOWPLAN_XML
This method generates the execution plan in an XML format (the .sqlplan files are stored as XML) and when generated from a graphical interface, like SSMS, if you click on it, it will display it graphically.
As with SHOWPLAN_TEXT and SHOWPLAN_ALL, this option does not execute the query, only generates the estimated execution plan.
To use it, just use the following T-SQL:
SET SHOWPLAN_XML ON;
GO

-- Your query goes here!
GO

SET SHOWPLAN_XML OFF;
GO
And the output looks like this:

The previous options are more suited when you have access to the actual query, and you are developing/tuning a particular statement, but if you need to generate plans for previous queries executed on the servers you have 3 options: DMVs, Extended Events, and QueryStore:
6. Using Dynamic Management Objects
Using the DMF: sys.dm_exec_query_plan, you can generate execution plans for any active session or sessions in the cache for your SQL Server instance, the output is given in an XML format that you can use in SSMS or save for later analysis.
This is a sample usage of the DMF using info from the cached plan with the DMV sys.dm_exec_query_stats, you can use another object if you want:
SELECT
 ph.query_plan,
 qs.*
FROM sys.dm_exec_query_stats AS qs
CROSS APPLY sys.dm_exec_query_plan(qs.plan_handle) ph;
This is the output of the query:
7. Using Extended Events
In this post, I explain how to create an Extended Event, just create your session and select any event you want to track.
In the global fields to capture, just select the event Plan Handle:
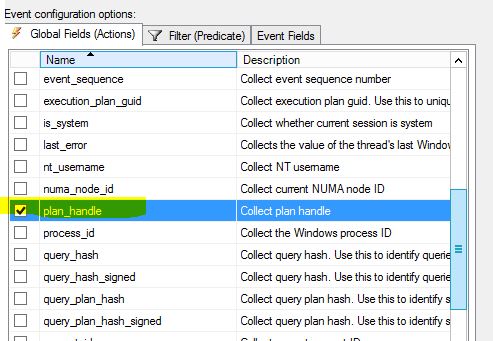
With this field, you can use the DMF sys.dm_exec_query_plan to obtain the execution plan.
Note: this method only works for cached execution plans, otherwise the DMF will return NULL.
even when you can capture and persist execution plans out of the cache with extended events, this is a very resource intensive task that I don't recommend to do, that is why that method is out of scope on this post.
8. Using Query Store
Since this option is not available in all SQL Servers, it was introduced in SQL Server 2016 and also you have to enable Query Store, I left this option as the last one, but it is also important to know how to obtain an execution plan from it.
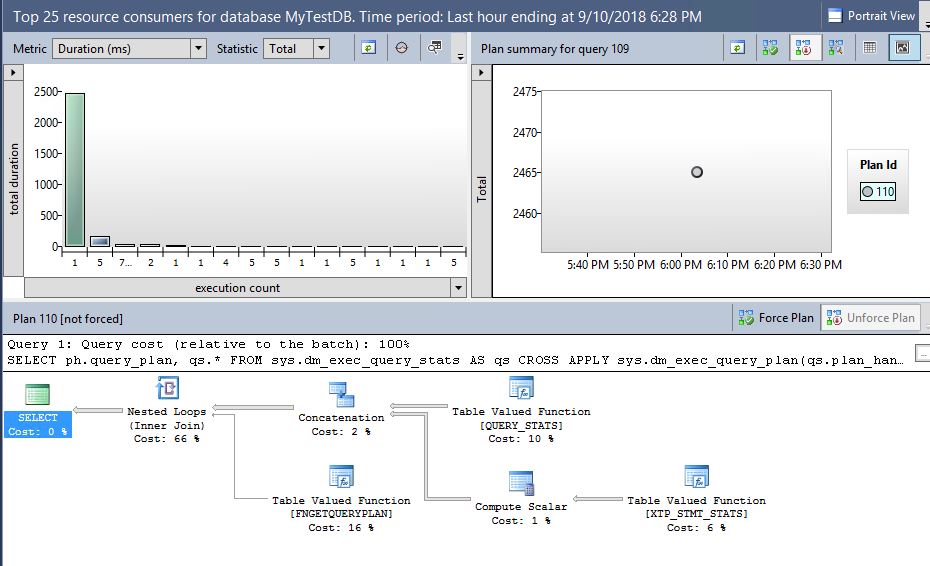
If you have Query Store already enabled on your database, just navigate to your database and select the Query Store folder, in there expand it and select any of the reports you want to analyze, for this example we will use Top Resource Consuming Queries:
The bars will show you the most resource-intensive queries in descending order, so just select any bar and you will see the current execution plan used at the bottom.
We will not discuss all the capabilities of Query Store on this post, but if you have more than one execution plan for a query, the different execution plans can be selected on the circles at the right side:
We have discussed a lot of different options you have to generate execution plans. In some later posts, we will use the info obtained to tune queries.
For further reading about execution plans, you can access this link:
https://www.red-gate.com/simple-talk/sql/performance/execution-plan-basics/
