

Last week I introduced WorkloadTools and promised additional posts to describe what it can do in more detail. So, here we go: in this post I will show you how to use WorkloadTools to capture a workload and analyze it, in order to find things like the most resource-intensive queries or discover how the application behaves over time.
Capturing the workload
First of all, you need to capture the workload using SqlWorkload. As stated in the documentation, you need to provide a .json file that contains all the parameters needed to configure the Listener and the Consumers.
Configuring the Listener
You have two types of listeners to choose from in this case, and the choice will be determined mainly by the version of SQLServer that you’re working on: with older versions (up to SQLServer 2008 R2), you will have no choice but to use a SqlTraceWorkloadListener, because Extended Events do not provide the required events (sql_batch_completed in particular).
With newer versions (from SQLServer 2012 onwards), you can use an ExtendedEventsWorkloadListener.
Regardless of the type of Listener that you choose, there is not much information that you need to provide: the name of the server to connect to and the credentials are usually more than enough. The following json fragment shows a sample Listener configuration:
"Listener":
{
    // This line decides which type of Listener to use
    // Put the name of the class of your choice in this param
    "__type": "ExtendedEventsWorkloadListener",
    "ConnectionInfo":
    {
        // Server name and credentials
        "ServerName": "SQLDEMO\\SQL2014",
        "DatabaseName": "master",
        // Omit UserName and Password to use
        // Windows Authentication
        "UserName": "sa",
        "Password": "P4$$w0rd!"
    },
    // If you want to reduce the workload,
    // put some filters here
    "DatabaseFilter": "DS3"
}
Some things to note:
- The .json file accepts comments, even if the JSON standard does not allow comments. The file gets minified before reading, so all comments get stripped away. Comments are useful for describing what the file does and why it configures things in that particular way.
- Each Listener type accepts a different set of parameters. See the documentation for more details. Not all parameters are mandatory (optional parameters and their default value are described in square brackets).
- You do not need to configure, start and stop a particular trace or Extended Events session: SqlWorkload takes care of everything for you. If you really wanted to, you could override the default trace/session script (but most of the times you don’t want to do that)
- Filtering the source events is a good idea in several situations: it helps breaking down complex workloads by database, application, login or host.
Regardless of the type of Listener in use, the workload does not need to get completely written to a SqlTrace or Extended Events file before it can be used by the Listener, but the events are read from the Listener source incrementally, using different techniques, that depend on the Listener type.
For instance, for an ExtendedEventsWorkloadListener, the Listener uses the XE streaming API to read the events without having to save them to a file target first. For a SqlTraceWorkloadListener, the events need to go to a trace file first, but SqlWorkload makes sure to use small rollover files and always reads the tail of the last available file. The same happens with ExtendedEventsWorkloadListener when the FileTargetPath property is specified (this is mandatory for Azure SqlDatabase and must point to a blog storage URL).
Configuring the Consumers
All the events captured by the Listener are forwarded to all the Consumers registered on the Listener itself. You could have multiple Consumers for the same Listener, but in this example one Consumer is sufficient.
Your goal is to capture the workload on the source server and extract some information about the shape of the workload itself, looking for resource-intensive queries, long-running queries or queries that have a high number of executions. The correct Consumer type for this is the AnalysisConsumer.
This Consumer type can be configured in many aspects, but in its simplest form, it just needs to receive the name of the server, database and schema where the workload analysis tables will be created and populated. The schema name is important, because you may want to compare different benchmarks and the easiest way to do this is to save each benchmark to a different schema.
// Consumers are contained in a list
"Consumers":
[
    {
        // Choose the appropriate type of Consumer
        "__type": "AnalysisConsumer",
        // Fill in connection information
        "ConnectionInfo":
        {
            "ServerName": "SQLDEMO\\SQL2016",
            "DatabaseName": "SqlWorkload01",
            "SchemaName": "capture",
            "UserName": "sa",
            "Password": "P4$$w0rd!"
        },
        // This parameter controls how often the consumer
        // aggregates performance data and writes to the
        // analysis database
        "UploadIntervalSeconds": 60
    }
]
UploadIntervalSeconds is another important parameter, because it controls how often the workload analysis data is written to the destination database. AnalysisConsumer uses this parameter to time the creation of “intervals”: inside each interval, the performance data is aggregated by query, application, database, host name and login name.
The queries also get normalized during the analysis process: each constant or literal inside the query text gets replaced by a placeholder, which allows to aggregate together queries that differ only by the constant values. During the normalization process, SqlWorkload also calculates a 64 bit query hash, that can be used to retrieve the normalized query text and a sample query text captured before the normalization occurs.
Please note that, at the time of writing, the destination database does not get created automatically and needs to be created upfront. I am planning to remove this limitation, so keep an eye on this issue.
Putting it all together and starting SqlWorkload
Now that Listener and Consumer are configured, you just need to put it all together in a single .json file and pass it to SqlWorkload.
Here is the complete sqlworkload.json:
{
    "Controller": {
        "Listener":
        {
            "__type": "ExtendedEventsWorkloadListener",
            "ConnectionInfo":
            {
                "ServerName": "SQLDEMO\\SQL2014",
                "DatabaseName": "master",
                "UserName": "sa",
                "Password": "P4$$w0rd!"
            },
            "DatabaseFilter": "DS3"
        },
        "Consumers":
        [
            {
                "__type": "AnalysisConsumer",
                "ConnectionInfo":
                {
                    "ServerName": "SQLDEMO\\SQL2016",
                    "DatabaseName": "SqlWorkload01",
                    "SchemaName": "capture",
                    "UserName": "sa",
                    "Password": "P4$$w0rd!"
                },
                "UploadIntervalSeconds": 60
            }
        ]
    }
}
Now that file is ready, save it (e.g. analyze.json) and use it to run SqlWorkload:
"%programfiles%\workloadtools\sqlworkload.exe" --File "%cd%\analyze.json"
If everything is ok, SqlWorkload will start to print messages to the standard output of your cmd window:

SqlWorkload also writes to a log file (SqlWorkload.log), that you will find in the working directory. You can control the log level and other logging parameters by editing NLog.config in the installation folder.
Every “UploadIntervalSeconds”, SqlWorkload will create a new interval, aggregate the performance data and upload everything to the analysis databases. You will see a message similar to this when the upload occurs:

When you think that the capture has lasted long enough, you can stop SqlWorkload by pressing CTRL+C. If you close the command window, it will not clean up the objects created for the capture, like Extended Events sessions or SqlTrace captures.
Another option is to specify a value for the optional parameter TimeoutMinutes on the Listener configuration: when the timeout expires, the capture will stop automatically.
Visualizing performance data with WorkloadViewer
Now that the analysis database contains the performance data, you can use WorkloadViewer to visualize it and draw your conclusions.
WorkloadViewer is a GUI tool that reads performance data from the analysis database and gives a graphical representation using charts and grids. It accepts a number of command line arguments that allow to automate its behavior, but it can be also opened without specifying any arguments: in this case, WorkloadViewer will present a form to fill the missing information.
WorkloadViewer can be used to visualize information about a single benchmark (analysis mode) or two benchmarks (comparison mode). In this case, you just need to work with a single benchmark, so it is enough to enter the connection info on the left, including the schema name where the tables are. When using Windows Authentication, you can leave UserName and Password blank.

WorkloadViewer shows data in three tabs:
- Workload
- Queries
- Query Details
The “Workload” tab shows three charts for total CPU, total duration and batches per second for each interval. This is useful to see how the workload evolves over time and identify any correlation between the three metrics.
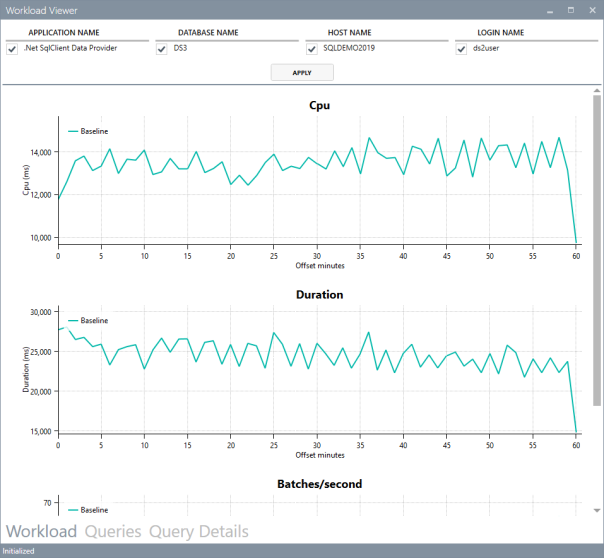
The charts support panning (click and drag with the right mouse button) and zooming (mouse wheel) as well as zooming to a particular area (click and drag with the middle mouse button). To reset zoom and pan, double click with the middle mouse button.
The “Queries” tab contains a grid that displays important metrics about the individual queries: avg/sum CPU, avg/sum Duration, avg/sum reads, total number of executions. These metrics are calculated over the entire workload.
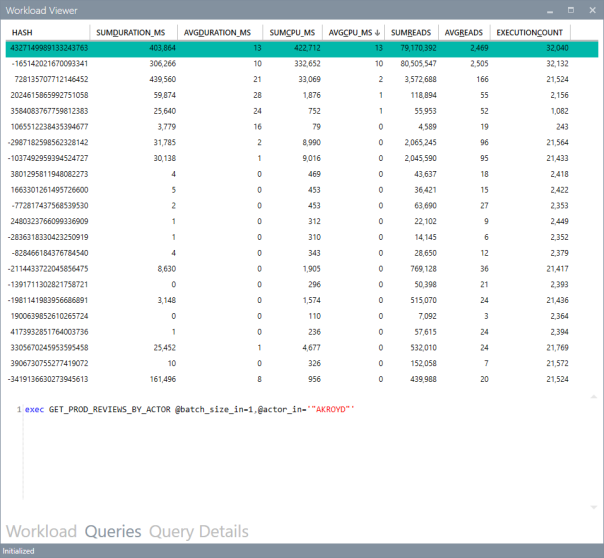
You can sort by a particular column by clicking the header: this allows you to rank queries by one of the metrics and identify immediately the top queries by that metric.
Clicking on one of the rows displays the query text on the bottom panel. Double clicking one of the rows takes you to the “Query Details” tab.
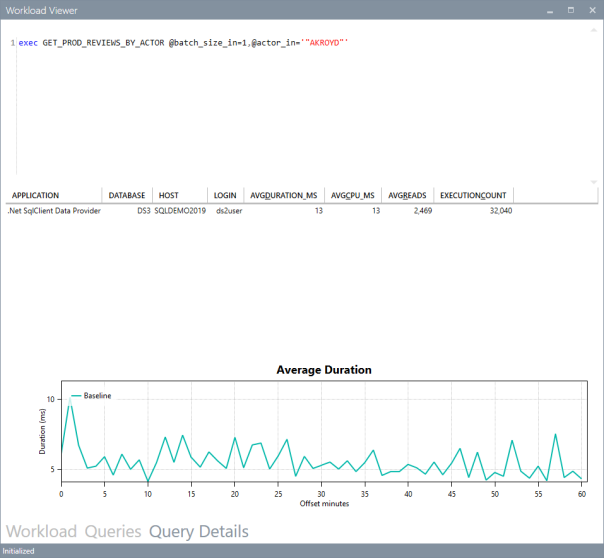
This tab displays information about the individual query: it contains the query text and the overall performance metrics, broken down by application name, database name, host name and login name.
The chart displays the average CPU usage over time.
WorkloadViewer is still heavily being worked on and it is not showing all the data available in the analysis database, but I hope to include more information in the future. If you feel adventurous enough, you can point PowerBI to the analysis database and produce a dashboard designed on your specific needs.
Conclusions
As you can see, WorkloadTools can be a valuable help when you need to analyze a workload. SqlWorkload allows you to capture all the data that you need with extreme ease, without having to configure anything other than basic connection information.
WorkloadViewer allows you to visualize the data in a convenient way and can give you an immediate overview of your workload, ranking queries by the most important performance metrics.
But this is only one of the many tasks that you can accomplish with WorkloadTools: in the weeks to come I will continue to write on this topic and I will show you how to unleash the full potential of WorkloadTools.
Stay tuned!
