

If you ever tried to capture a benchmark on your SQL Server, you probably know that it is a complex operation. Not an impossible task, but definitely something that needs to be planned, timed and studied very thoroughly.
The main idea is that you capture a workload from production, you extract some performance information, then you replay the same workload to one or more environments that you want to put to test, while capturing the same performance information. At the end of the process, you can compare performance under different conditions, identify regressions, avoid unwanted situations and rate your tuning efforts.
A big part of the complexity, let’s face it, comes from the fact that the tools that we have had in our toolbelt so far are complex and suffer from a number of limitations that make this exercise very similar to a hurdle race.
If you want to replay a workload from production to test, you need to be able to capture the workload first. Even before you start, you’re already confronted with a myriad of questions:
- What do you use for this? A server-side trace? Extended events? Profiler maybe?
- Which events do you capture? Which fields?
- How long do you need to run the capture? How much is enough? One hour? One day? One week? One month?
- Can you apply some filters?
- Will you have enough disk space to store the captured data?
Throughout the years, you’ve had multiple tools for capturing workloads, each with its own strengths and limitations:
- Profiler
- GOOD: extremely easy to use
- BAD: non-negligible impact on the server
- Extended Events
- GOOD: lightweight
- BAD: not compatible with older versions of SQLServer
- SQL Trace
- GOOD: less impactful than profiler
- BAD: deprecated
However, capturing the workload is not enough: you need to be able to replay it and analyze/compare the performance data.
But fear not! You have some tools that can help you here:
- RML Utilities
- SQL Nexus
- Distributed Replay
- Database Experimentation Assistant (DEA)
The bad news is that (again) each of these tools has its limitations and hurdles, even if the tin says that any monkey could do it. There is nothing like running ReadTrace.exe or Dreplay.exe against a huge set of trace files, only to have it fail after two hours, without a meaningful error message (true story). Moreover, of all these tools, only Distributed Replay (and DEA, which is built on top of it) support Azure SqlDatabase and Azure Managed instances: if you’re working with Azure, be prepared to forget everything you know about traces and RML Utilities.
Introducing WorkloadTools
Throughout my career, I had to go through the pain of benchmarking often enough to get fed up with all the existing tools and decide to code my own. The result of this endeavor is WorkloadTools: a collection of tools to collect, analyze and replay SQL Server workloads, on premises and in the cloud.
At the moment, the project includes 3 tools:
- SqlWorkload – a command line tool to capture, replay and analyze a workload
- ConvertWorkload – a command line tool to convert existing workloads (traces and extended events) to the format used by SqlWorkload
- WorkloadViewer – a GUI tool to visualize and analyze workload data
SqlWorkload is different from the traditional tools, because it lets you choose the technology for the capture: SqlTrace, Extended Events or a pre-recorded workload file. SqlWorkload also lets you choose the platform that you prefer: it works with older versions of SqlServer (tested from 2008 onwards, but nothing prevents it from running on SqlServer 2000) and newer versions, like 2017 or 2019. But the groundbreaking feature of SqlWorkload is its ability to work with Azure Sql Database Managed Instances and Azure Sql Database, by capturing Extended Events on Azure blob storage.
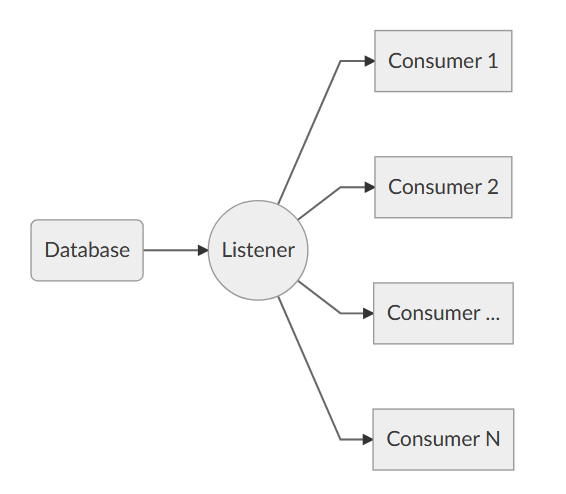
The capture is performed by a “Listener”, that reads the workload events from the source and forwards them immediately to a collection of “Consumers”, each specialized for performing a particular task on the events that it receives. You have a consumer for replaying the workload, a consumer for saving the workload to a file and a consumer for analyzing the workload to a database.
This flexible architecture allows you to do things differently from the existing tools. The traditional approach to benchmarking has always been:
- capture to one or more files
- analyze the files
- replay and capture
- analyze the files
- compare
SqlWorkload does not force you to save your workload to disk completely before you can start working with it, but it lets you forward the events to any type of consumer as soon as it is captured, thus enabling new types of workflows for your benchmarking activities. With SqlWorkload you are free to analyze the events while capturing, but you can also replay to a target database in real-time, while a second instance of SqlWorkload analyzes the events on the target.
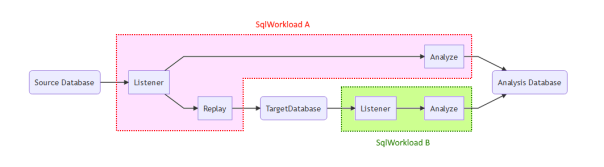
If you’re used to a more traditional approach to benchmarking, you can certainly do things the usual way: you can capture a workload to a file, then use that file as a source for both the workload analysis and the replay. While replaying, you can capture the workload to a second set of files, that you can analyze to extract performance data. Another possibility is to analyze the workload directly while you capture it, writing to a workload file that you can use only for the replay.
As you can see, you have many possibilities and you are free to choose the solution that makes sense the most in your scenario. You may think that all this flexibility comes at the price of simplicity, but you’d be surprised by how easy it is to get started with WorkloadTools. SqlWorkload was designed to be as simple as possible, without having to learn and remember countless command line switches. Instead, it can be controlled by providing parameters in .JSON files, that can be saved, kept around and used as templates for the next benchmark.
For instance, the .JSON configuration file for “SqlWorkload A” in the picture above would look like this:
{
    "Controller": {
        "Listener":
        {
            "__type": "ExtendedEventsWorkloadListener",
            "ConnectionInfo":
            {
                "ServerName": "SourceServer",
                "DatabaseName": "SourceDatabase",
                "UserName": "sa",
                "Password": "P4$$w0rd!"
            },
            "DatabaseFilter": "SourceDatabase"
        },
        "Consumers":
        [
            {
                "__type": "ReplayConsumer",
                "ConnectionInfo":
                {
                    "ServerName": "TargetServer",
                    "DatabaseName": "TargetDatabase",
                    "UserName": "sa",
                    "Password": "Pa$$w0rd!"
                }
            },
            {
                "__type": "AnalysisConsumer",
                "ConnectionInfo":
                {
                    "ServerName": "AnalysisServer",
                    "DatabaseName": "AnalysisDatabase",
                    "SchemaName": "baseline",
                    "UserName": "sa",
                    "Password": "P4$$w0rd!"
                },
                "UploadIntervalSeconds": 60
            }
        ]
    }
}
As you can see, SqlWorkload expects very basic information and does not need to set up complex traces or XE sessions: all you have to do is configure what type of Listener to use and its parameters, then you need to specify which Consumers to use and their parameters (mainly connection details and credentials) and SqlWorkload will take care of the rest.
If you need to do control the process in more detail, you can certainly do so: the full list of parameters that you can specify in .JSON files is available in the documentation of SqlWorkload at GitHub.
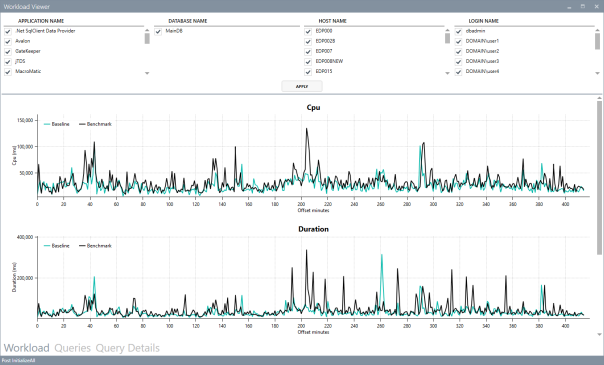
Once the capture is over and you completely persisted the workload analysis to a database, you can use WorkloadViewer to visualize it. WorkloadViewer will show you charts for Cpu, Duration and Batches/sec, comparing how the two benchmarks performed. You can also use the filters at the top to focus the analysis on a subset of the data or you can zoom and pan on the horizontal axis to select a portion of the workload to analyze.
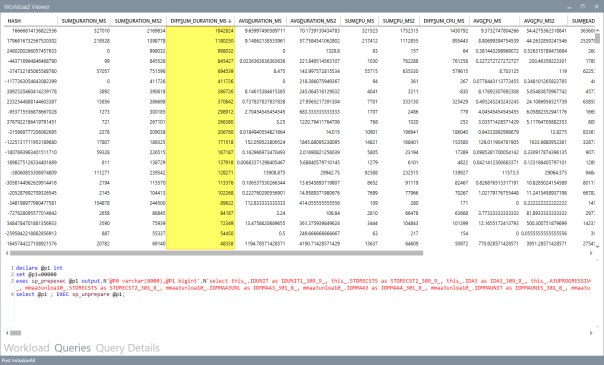
You can also use the “Queries” tab to see an overview of the individual batches captured in the workload. For each of those batches, you’ll be able to see the text of the queries and you will see stats for cpu, duration, reads, writes and number of executions. Sorting by any of these columns will let you spot immediately the regressions between the baseline and the benchmark and you will know exactly where to start tuning.
If you double click one of the queries, you will go to the Query Details tab, which will show you additional data about the selected query, along with its performance over time:
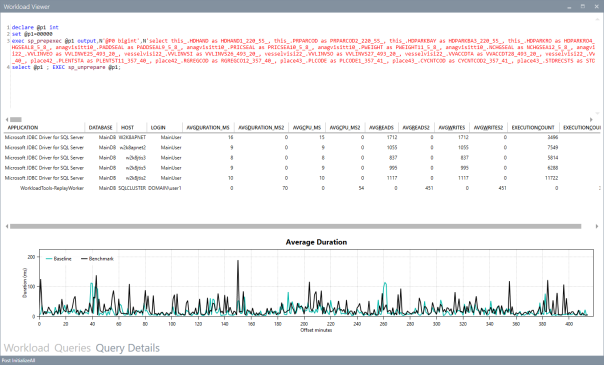
If WorkloadViewer is not enough for you, the project also includes a PowerBI dashboard that you can use to analyze the data from every angle. Does it look exciting enough? Wait, there’s more…
If you already have a pre-captured workload in any format (SqlTrace or Extended Events) you can use the command line tool ConvertWorkload to create a new workload file in the intermediate format used and understood by SqlWorkload (spoiler: it’s a SqLite database), in order to use it as the source for a WorkloadFileListener. This means that you can feed your existing trace data to the WorkloadTools analysis database, or replay it to a test database, even if the workload was not captured with WorkloadTools in the first place.
We have barely scratched the surface of what WorkloadTools can do: in the next weeks I will post detailed information on how to perform specific tasks with WorkloadTools, like capturing to a workload file or performing a real-time replay. In the meantime, you can read the documentation or you can join me at SqlBits, where I will introduce WorkloadTools during my session.
Stay tuned!
