

Based on the number of times I see this question on forums, it must be occurring all the time. You have two different servers that, as far as you know, are identical in terms of their options and setup (although not necessarily in terms of power, think a test or pre-production system versus production). On these servers you have a database on each that, as far as you know, is the same as the other in terms of options, objects, maybe even data (although, this does mean that you have unmasked production information in your QA environment, which potentially means you’re going to jail, might want to address this, especially now that I’ve told you about it, mens rea, you’re welcome). On each database you run, as far as you know, the exact same query (whether a straight up ad hoc query, stored procedure, parameterized query, whatever). On your production server, let’s call it PROD, the query runs for 3 hours before it returns, but on the test server, let’s call it TEST, it returns in about 3 seconds.
What. The. Hell.
This is especially troubling because PROD has 8 processors that are much more powerful than TEST, which has only 2 (either can go parallel, so this is the same). TEST only has 16GB of RAM and PROD has 64GB. Further, you know that the databases, data, and statistics are the same because you restored the TEST database from PROD (although, see that jail thing above). However, you’re on top of things. You capture the query metrics so you know exactly the amount of time and the reads or writes from each query and you even do this using extended events so you’re minimizing observer effects. You also have monitoring in place, so you know that there is no blocking in PROD. The query is just a pig there, but not on TEST. You’ve even gone so far as to get an estimated execution plan from each server and they are absolutely different.
Now what?
Well obviously something somewhere is different. Start by comparing everything on both servers and both databases down to… hang on, here, we’ll write a PowerShell script and then….
Wait, wait, wait!
You have the execution plans? Before we start digging through all the properties everywhere and comparing everything to everything, updating statistics 14 times, and all the rest, what if we look at the execution plans. They’re different, so we should start looking at scans & indexes & statistics &….
Wait!
Let’s start simple and clear. Let’s take a look at the properties of the first operator:

This contains a ton of information about the settings of the systems where each plan was generated. Let’s assume that, probably, the databases are the same, as is the data and the statistics, but the problem is a system or database setting. These differences can result in different execution plans and therefore different execution times. If we are dealing with two different servers and we are fairly sure the data, structure and the statistics are the same, the properties of the first operator are a great starting point for understanding what went wrong.
Oh, and the first operator is this one with the red square around it:

Let’s use the new SSMS Compare Showplan to see the differences between our two execution plans that we captured:
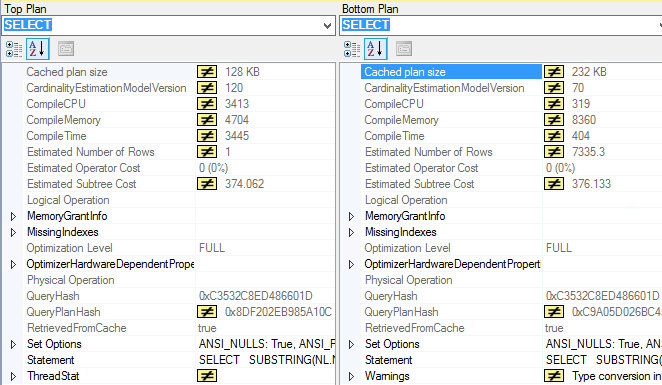
(clicking on that will make it bigger)
There are a bunch of differences highlighted, but one ought to jump out pretty quick. That’s right, these two databases have different compatibility levels which resulted in one of them using the new optimizer and one using the old optimizer as evidenced by the CardinalityEstimatorModelVersion. Fun point, both have identical query hash values. Not surprising, but additional, quick, validation that we really are talking about the same query on each server (and one of them isn’t using a trace flag to change the cardinality estimator). You now have enough information to go and make some changes to your system without lots of further fumbling and work.
When dealing with the same query from two servers that ought to result in similar behavior, but doesn’t, get the execution plans (estimated plans are fine here) and compare the the properties of the first operator. That’s the quickest way to identify the issues that could be leading to the differences between the servers.
Want to talk more about execution plans and query tuning? Let’s do it.
In August, I’ll be doing an all day pre-con at SQLServer Geeks Annual Summit in Bangalore India.
I’m also going to be in Oslo Norway for a pre-con before SQL Saturday Oslo in September.
The post Same Query, Different Servers, Different Performance. Now What? appeared first on Home Of The Scary DBA.
![]()
