

By Steve Bolton
…………This long-delayed series of amateur self-tutorials has been in the works ever since I began writing my A Rickety Stairway to SQL Server Data Mining series, which made it clear to me that I didn’t know enough about what was going on under the hood in SSDM. I still don’t know enough about the reasoning behind the various data mining algorithms implemented by SQL Server and other tools, but I am certain of one thing: I never will know enough, even if I actually became competent in these topics. These fields are just too detailed, broad and rooted in poorly understood corners of pure reason for anyone to master, let alone myself. Like my series on SSDM, this foray into coding all of the basic measures of information theory and related fields may well exemplify University of Connecticut statistician Daniel T. Larose’s witticism that “data mining is easy to do badly.”[1] My purpose in the Rickety series was merely to demonstrate that useful results can still be derived from SSDM, even when it is badly mishandled. In this series, I will try to explain how the metrics used in many data mining algorithms can be used to answer a whole cornucopia of questions about our datasets, such as: How much information might there be, as measured in terms of possible state descriptions and probabilities? How much meaning (i.e. semantic information) might it have? How many state descriptions does it rule out? How much is already known? How random, aperiodic, redundant, complex or ordered is it? Another interesting challenge is determining the shortest possible specifications of a structure.
…………There are literally dozens upon dozens of measures available to answer all of these questions, taken from such diverse fields as information theory, chaos theory, algorithmic complexity and many others which provide the basic building blocks of most data mining algorithms. The techniques provided by these fields are powerful, yet contain many logical stumbling blocks that far smarter people than ourselves have tripped over, often without even knowing it; these range from instances of subtle “definition drift” in the meaning of terms like “randomness” over the course of textbooks, to the development of full-blown crackpot theories by scholars overexcited by the potential of systems like chaos and information theory. I am bound to make mistakes along the way, given that I’m an amateur at this, so by all means take care when implementing my code and trusting my analysis, which is sometimes just plain wrong. On the other hand, these techniques are so powerful and so under-utilized that there is a crying need for some explanation of how they can be applied in a SQL Server environment, even a poor one. I know a little bit more of certain areas of philosophy – especially historical instances of when it has gone very wrong – so I can occasionally make a contribution by commenting on how to avoid fallacious reasoning, which is even more of a problem once these sophisticated topics are clouded over by excess jargon and complex math formulas.
DIY Data Mining and the Scope of the Series
One thing I’ve learned while trying to force-feed myself the underlying math is that the analysis marketplace is decades behind the research in some ways; there is no way that any single company is ever going to be able to code all of the extant mining algorithms, assuming it is even possible to tally them all up. This means that it may be beneficial in the years to come to have the skills to build DIY solutions. Throughout this series I will provide T-SQL code so that SQL Server DBAs and data miners can implement some of these techniques on their own, without waiting for developers of mining software to code the particular algorithms that fit their use cases. Why T-SQL? I could make a strong case that the gradual accretion of features like windowing functions is slowly making set-based languages ideal for this purpose, although they are rarely thought of in that way; it boils down to the fact that most of the problems covered in these interrelated fields are much easier to express in terms of sets. Furthermore, the sheer size of “Big Data” (which has steadily gotten “bigger” ever since the first records were kept; like “globalization”, it has only accelerated in recent years) requires taking computing to a new level of abstraction in order to simplify things, which is a purpose that set-based languages can fulfill. This series will be a learning experience for me as well, in which I hope to at least help others avoid my mistakes, by teaching through misadventure; writing a series like this aids me in absorbing the material a lot faster, while also getting valuable practice in translating the difficult underlying math formulas into code. Since I don’t know what I’ll discover along the way, I suspect that at some point I may resort to using some of my other favorite languages, like Multidimensional Expressions (MDX) and Visual Basic .Net, possibly in conjunction with Common Language Runtime (CLR) stored procedures. One of the benefits I hope to provide is to take most of the math out of the picture, so that readers don’t get bogged down in it; the jargon and formulas are absolutely necessary for the researchers to communicate with each other, but there is no need for data miners to be writing formal mathematical proofs, just as commuters shouldn’t have to give a dissertation on automotive engineering in order to drive their cars. I’ve sometimes received comments to the effect that there’s too much text in these articles, but that’s because they don’t see the hundreds of pages of math formulas that gave rise to them; rather than stringing together some meaningless screenshots or rehashing MSDN tutorials from AdventureWorks, I aim to show how these techniques might be coded and how they can be used appropriately.
…………The goal in this series is to corner the uncertainty in our datasets by shining lights on it from every possible direction, so that organizations can make better decisions that result in more effective actions. To that end, everything from measures used in Bayesian inference to Solomonoff Algorithmic Probability to the calculation of periodicities to the Lyapunov Exponent will be fair game. These metrics vary quite widely in terms of sophistication, so at points we’ll cross the imprecise boundaries separating them from full-blown data mining algorithms; the dividing lines separating statistics, data mining, machine learning, “soft computing,” predictive analytics and the like seem to boil down to degrees of intricacy, rather than differences in kind, especially since their algorithms are derived from the same metrics and building blocks. My last mistutorial series was designed from the ground up to build on existing concepts, one article at a time. This one will be inherently disorganized, since the scope is so wide and I don’t know what I will find along the way. I will have to skip around quite a bit across topics that may only be distantly related, or across levels of sophistication exhibited by the measures of information. It will also be an open-ended series, whereas the Rickety series was merely necessary to cover a specific set of easily denumerable features. We could delve into dozens of obscure metrics if the need arises, or even concoct our own special-purpose metrics, if a use case calls for it.
…………The series may explore a wide-ranging topics along paths are still somewhat unknown, but I can at least kick it off by introducing some of the primordial foundations of information theory. Perhaps the simplest is a function developed in 1928 by electronics pioneer Ralph Hartley[2], who applied it to signal transmission[3] a few decades before Claude Shannon did the same with his own renowned entropy measure. Although Hartley considered it a measure of information, his function did not lead to the use of the term of “information theory,”[4] which was coined when Shannon’s famous equation gave birth to the field. This introduction will be made even easier by the fact that I already discussed a more advanced version of Hartley’s measure in Implementing Fuzzy Sets in SQL Server, Part 9: Measuring Nonspecificity with the Hartley Function. The version for ordinary “crisp” sets of the kind DBAs and data miners are accustomed to working is actually quite a bit easier to code and interpret: all we have to do is count the records in a set and take the logarithm. The code in Figure 1 is actually longer than it has to be, given that I used three different logarithm bases to measure the same quantity, for the sake of completeness. When base 2 is used, the units are known as bits or “shannons.” When the default value of Euler’s Number is used, they’re known as “nats,” but with base 10 we’re measuring in hartleys or “bans” (a term coined by famed cryptographer Alan Turing). It would be trivial to turn this into a stored procedure with an option to select the desired units. It only took about a second to calculate the results in Figure 2 on the first float column of the Higgs Boson dataset I downloaded from University of California at Irvine’s Machine Learning Repository a few tutorial series ago, which I converted to a 5-gigabyte SQL Server table. This was calculated effortlessly across all 11 million rows only because we had to performs some simple counts, without traversing the whole table.
Figure 1: Code for the Ordinary “Crisp” Version of the Hartley Function
DECLARE @HartleyEntropy float, @DistinctCount bigint, @Count bigint
SELECT @DistinctCount = Count(DISTINCT Column1), @Count = Count(*)
FROM Physics.HiggsBosonTable
SELECT Log(@DistinctCount, 2) AS BitsOrShannons, Log(@DistinctCount, 2.7182818284590452353602874713526624977) AS Nats, Log(@DistinctCount, 10) AS Hartleys,
Log(@Count, 2) AS MultisetBitsOrShannons, Log(@Count, 2.7182818284590452353602874713526624977) AS MultisetNats, Log(@Count, 10) AS MultisetHartleys
Figure 2: Results from the Higgs Boson Dataset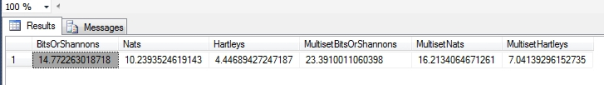
…………The main problem I ran into was a fundamental one: the formula calls for plugging in the cardinality of the set, but in ordinary set theory parlance, duplicate values are only counted in multisets. The set notation includes the symbols |A|, but the bars specify a cardinality measure rather than the use of the ABS function. The question is, which cardinality? I’ve included both versions in Figure 1, which differ solely by the fact that one uses a DISTINCT operator and the other takes a standard COUNT. This discrepancy could have its uses though. I have yet to see this issue raised in the information literature, where Hartley’s metric is often skipped over as a topic of mainly historical interest in comparison to Shannon’s, but it may be possible to derive a third metric based on the difference between the two. A simple subtraction might help us quantify the contribution of the repeated values to the uncertainty, which could have its uses in the kinds of uncertainty management programs I spoke of in the fuzzy set series. In essence, this difference could act as a crude measure of redundancy. If it reflects the information gained by using the DISTINCT operator, we could use this to assess its costs. We know for a fact that the DISTINCT version can’t exceed the multiset version, which acts as a cap on its range. At the other end of the scale, the measure reaches the limit of 0 when all records have the same value, therefore giving us perfect certainty. Another important issue is whether or not the DISTINCT clause adds information, by reducing the amount of uncertainty about how many different values a variable can take on.
…………Of course, the clause might not be necessary at all if we knew in advance precisely which values were permissible for a column, such as the range of a decimal type or a varchar column limited to a handful of known category values. On the other hand, this raises a subtle distinction between values that are permissible for a column, which can be determined by the data type, and the values actually found, which can only be counted through a DISTINCT operator. The issue becomes more sophisticated if we are able to determine the counts of each individual value; these measures of “multiplicity,” as they are known in multiset theory, further reduce the uncertainty associated with the dataset. It is easy enough to implement these internal counts using windowing functions and GROUP BY statements, but the issue of how to factor them in quickly complicates the discussion of the otherwise simple Hartley function. Thankfully, the order of the records is only an issue with tuples, not the kinds of sets or multisets we plug into it – except when we get to the end of the dataset and can determine the last records from the remaining counts, which is something I’ve not seen addressed in the literature. This brings applications without replacement (i.e., the kind of probabilities associated with decks of cards where no reshuffling takes place) into play, at least briefly.
“Newsworthiness”: The Narrow Definition of “Information”
Aside from all of these hidden subtleties, the information provided by both the DISTINCT and multiset versions can be summed up thus: how much am I learning each time I inspect a row and verify the actual value found there? This is equivalent to asking how much we learn from each slip of paper in a drawing, if we know the count of the jar in advance. In more advanced terms, we can think of this as increasing information by reducing the number of possible state descriptions the next record can take on; in such a context, whether or not repeated values are allowed makes a big difference. The same goes for their individual counts, if the answer is yes. Keep in mind that this type of “information” is practically the polar opposite of existing knowledge; basically, the higher the Hartley measure is, the less we don’t already know, so the more the next record can tell us. It is a highly specific type of information, which former journalists like myself might equate with “newsworthiness.” This is the dividing line between existing and new knowledge is precisely where measures of entropy (like the Hartley function) intersect with topics like Bayesian probability, which I will also address at some point in this series; as we shall see, many of these information measures are interrelated in complex ways. This highly specific definition of information is an important distinction that pertains to all of the other measures of entropy we’ll discuss in this series; interpretation is a critical stage in every field associated with data mining, particularly information theory, which should never be shortchanged in any workflow.
…………The Hartley function can be leveraged in a data mining workflow in various ways, such as calculating the reduction in uncertainty between two separate measures; this could be useful, for example, in specifying a numerical cut-off point in bits or bans, after which it’s not worthwhile to go on inspecting rows, for whatever end purpose that might be, such as sampling. The sample code in Figure 3 takes the Hartley measure after the 10 millionth row, or about 9 percent away from the end of the dataset, which is why remaining uncertainty in Figure 4 is so low; as we approach the last uninspected record, the remaining uncertainty would approach zero. This formula would be equivalent to counting the remaining records and plugging the results into the Hartley function. Another interesting question is whether or not we could we pair this with cardinality estimation, to get a ballpark figure of how much we can learn from each record we inspect, before we’ve even traversed a dataset. I don’t know much about cardinality estimation yet, but the possibility is tantalizing
Figure 3: Calculating the Remaining Uncertainty with the Hartley Function
DECLARE @DistinctCountOfKnownValues bigint, @CountOfKnownValues bigint
SELECT @DistinctCountOfKnownValues = Count(DISTINCT Column1), @CountOfKnownValues = Count(*)
FROM Physics.HiggsBosonTable
WHERE ID BETWEEN 1 AND 10000000
SELECT Bits, KnownBits, Bits – KnownBits AS RemainingUncertaintyInBits, MultisetBits, KnownMultisetBits, MultisetBits – KnownMultisetBits AS RemainingMultisetUncertaintyInBits
FROM (SELECT Log(@DistinctCount, 2) AS Bits, Log(@DistinctCountOfKnownValues, 2) AS KnownBits, Log(@Count, 2) AS MultisetBits, Log(@CountOfKnownValues, 2) AS KnownMultisetBits) AS T1
Figure 4: Uncertainty Reduction Results![]()
…………The kinship between the Hartley function and the rest of information theory is evident in some of its alternative names, like the Hartley Entropy or Max Entropy. It is equivalent to the Rényi Entropy[5] with its alpha parameter (a) set to 0, as I’ll explain a few articles from now. It’s also identical to the Shannon Entropy in cases of the uniform distribution, i.e. when all values are equally likely.[6] I’ll be spending a couple of articles on various aspects of entropy early on this series, since it’s such an important concept in information theory. The math and logic can get thick pretty quickly in this field, so it is best to start off with the measure that started it all, Shannon’s infamous “H.” I recognized its signature combination of a negative summation operator and log operation when translating some of the equations used in Implementing Fuzzy Sets in SQL Server, Part 10.2: Measuring Uncertainty in Evidence Theory into T-SQL. As with the Hartley function, this previous exposure to more advanced fuzzy derivatives ought to make the material a little easier to swallow. The difficulty with Shannon’s Entropy, however, is not in its calculation, but in its proper interpretation. Yet as long as we have the rigor to avoid assigning unwarranted shades of meaning to the term “information,” it can be a powerful addition to our data mining toolbelts.
[1] p. xii, LaRose, Daniel T., 2005, Discovering Knowledge in Data: An Introduction to Data Mining. Wiley-Interscience: Hoboken, N.J.
[2] See the Wikipedia articles “Hartley Function” and “Ralph Hartley” at http://en.wikipedia.org/wiki/Hartley_function and http://en.wikipedia.org/wiki/Ralph_Hartley respectively.
[3] p. 5 Ritchie, L. David., 1991, Information. Sage Publications: Newbury Park, Calif.
[4] p. 288, Bar-Hillel, Yehoshua, 1964, Language and Information: Selected Essays On Their Theory and Application. Addison-Wesley Pub. Co.: Reading, Mass.
[5] See the Wikipedia article “Rényi Entropy” at http://en.wikipedia.org/wiki/R%C3%A9nyi_entropy
[6] See the Wikipedia article “Hartley Function” at http://en.wikipedia.org/wiki/Hartley_function
