

By Steve Bolton
…………As I’ve cautioned before, I’m writing this series of amateur self-tutorials in order to learn how to use SQL Server to perform goodness-of-fit testing on probability distributions and regression lines, not because I already know the topic well. Along the way, one of the things I’ve absorbed is that the use cases for the various goodness-of-fit tests are more sharply delineated than the statistical tests for the outlier detection, which was the topic of my last tutorial series. I covered some of the more general measures in Goodness-of-Fit Testing with SQL Server, part 1: The Simplest Methods, but even some of these – like the 3-Sigma Rule – are limited only to the Gaussian or “normal” distribution, i.e. the bell curve. Many of the other metrics we’ll survey later in this series are likewise limited to specific data types, such as the popular Kolmogorov-Smirnov and Anderson-Darling Tests, which cannot be applied to nominal data (i.e. corresponding to the Discrete Content type in SQL Server Data Mining).[1] For that task, you need a metric like the Chi-Squared Test (or ??²), which can handle nominal data types as well as continuous ones, which are measured in infinitesimal gradations; cases in point would include the decimal and float types in SQL Server.
…………In addition to the bell curve, the ??²can handle such other popular distributions as the Poisson, log normal, Weibull, exponential, binomial and logistic, plus any others that have an associated cumulative distribution function (CDF).[2] Ralph B. D’Agostino, one of the inventors of the metric we discussed in Goodness-of-Fit Testing with SQL Server, part 3.2: D’Agostino’s K-Squared Test, cautions though that analyses of the ??² Test indicate this flexibility comes at the cost of decreased statistical power; as he and some of his colleagues put it in a 1990 academic paper, “The extensive power studies just mentioned have also demonstrated convincingly that the old warhorses, the chi-squared test and the Kolmogorov test (1933), have poor power properties and should not be used when testing for normality.”[3] Some experts consider this flaw to be almost fatal, to the point where one writes, “If you want to test normality, a chi-squared test is a really bad way to do it. Why not, say, a Shapiro-Francia test or say an Anderson-Darling adjusted for estimation? You’ll have far more power.”[4] As we shall see in a few weeks, the Anderson-Darling Test has other limitations beyond its inability to handle nominal columns, whereas I believe the Shapiro-Francia Test is based on the Shapiro-Wilk, which is computationally expensive and limited to what the SQL Server community would consider very small sample sizes. Each test has its own unique set of strengths and weaknesses, which ought to strongly influence a data miner’s choices.
More “Gotchas” with the ??² Test (and Its Inventor)
A further caveat of the ??² Test is that the population ought to be ten times more numerous than the sample[5], but one of the strengths of Big Data-era analysis is that we can use modern set-based methods to traverse gigantic datasets, rather than taking dinky slices of the kind normally seen in hypothesis testing. As discussed over the course of the last two tutorial series, I’m shying away from the whole field of hypothesis testing because it is not well-suited to our use cases, which may involve hundreds of millions of rows that might represent a full population rather than 50 or 100 from a sample that rarely does; furthermore, the act of applying the usual confidence and significance levels and the like reduces such tests down to a simple Boolean, yes-no answer. This represents a substantial reduction in the information provided by the test statistics, akin to truncating a float or decimal column down to a SQL Server bit data type; by retaining the full statistic, we can measure how normal or exponential or uniform a particular dataset may be.[6]
That is why in the last article, I skipped the usual step of plugging the Hosmer-Lemeshow Test results into a ??² Test, to derive confidence levels and the like based on how well they approximate a ??² distribution.[7] In fact, such comparisons to the ??² distribution seem to be as common in hypothesis testing as those to Student’s T-distribution, or the F-distribution in the case of Analysis of Variance (ANOVA). Further adding to the confusion is the fact that there is also a ??² Test of Independence, in which contingency tables are used to establish relationships between multiple variables. There is some overlap in the underlying concepts, but the two ??² Tests are not identical.[8] The goodness-of-fit version we’re speaking of here was the developed by Karl Pearson, one of the most brilliant statisticians of the 19th Century – but also one of the most twisted. As I’ve pointed out several times since beginning my series on A Rickety Stairway to SQL Server Data Mining, ordinary mathematicians might be stable people, but a frightening share of the rare geniuses among them have been not just eccentric, but Norman Bates-level crazy. Pearson was a blatant racist and Social Darwinist who sought to extinguish the “unfit” through such schemes as eugenics[9], and thereby helped feed the intellectual current in Europe that eventually brought Hitler to power. We can still use his statistical tests, just as we use the rockets devised by Werner von Braun and the quantum mechanics pioneered by Werner Heisenberg – provided that we put them to better purposes.
Deriving the ??² from CDFs
You don’t have to be a proverbial rocket scientist in order to calculate the ??² Test, nor do you need to do the kind of mental gymnastics required for the Heisenberg Uncertainty Principle. The equation is actually quite simple, especially since it follows a form similar to that of many of the other test statistics surveyed in the last two tutorial series. Like Z-Scores and so many other metrics, the ??² Test involves subtracting one value from another for each row, squaring the result and then summing them across the entire dataset, all of which can be easily implemented with T-SQL windowing functions. The difference is that in this case, we’re putting the data in ascending order, then subtracting probabilities generated by the CDF of the distribution we’re testing from the actual value.
Some CDFs are trivial to calculate, but as I mentioned in Goodness-of-Fit Testing with SQL Server, part 2: Implementing Probability Plots in Reporting Services, I had a hell of a time deriving the correct values for the normal distribution’s CDF – as do many novices, in large part because there is no closed-form solution to that particular formula. Rather than rehash that whole topic of how to use approximations to derive the normal CDF, I’ll simply reuse most of the code from that article to implement that part of the ??² equation. I had to tweak a little so that I could calculate only the handful of CDF values we actually need, rather than every single probability in a defined range; this called for passing it a table parameter of the type shown below, which is populated in the middle of Figure 1. Keep in mind that this Gaussian CDF is based on the simplest approximation I could find, so once you get about five or six places right of the decimal point, some inaccuracy creeps in, which might be magnified in certain cases by the use of float rather than decimal in the type definition.
Figure 1: DDL for the ??²Test
CREATE TYPE [Calculations].[SimpleFloatValueTableParameter] AS TABLE(
[RN] [bigint] NULL,
[Value] float(53) NULL)
CREATE PROCEDURE [Calculations].[NormalDistributionCDFSupplyTableParameterSP]
@Mean decimal(38,21), @StDev decimal(38,21), @InputTableParameter AS [Calculations].[SimpleFloatValueTableParameter] READONLY
AS
DECLARE @StDevTimesSquareRootOf2 as decimal(38,21), @One as decimal(38,37) = 1, @Two as decimal(38,37) = 2, @EulersConstant decimal(38,37) = 2.7182818284590452353602874713526624977
SELECT @StDevTimesSquareRootOf2 = @StDev * Power(@Two, 0.5)
SELECT ColumnValue, CASE WHEN ColumnValue >= @Mean THEN CDFValue ELSE 1 – CDFValue END AS CDFValue
FROM (SELECT Value AS ColumnValue, 0.5 + (0.5 * Power(@One – Power(@EulersConstant, ((-0.147 * Power(ErrorFunctionInput, 4)) – (1.27324 * Power(ErrorFunctionInput, 2))) / (@One + (0.147 * Power(ErrorFunctionInput, 2)))), 0.5)) AS CDFValue
FROM ( SELECT Value, (Value – @Mean) / @StDevTimesSquareRootOf2 AS ErrorFunctionInput
FROM @InputTableParameter
WHERE Value IS NOT NULL) AS T1) AS T2
…………As annoying as it might be to create these extra objects just to run the procedure in Figure 2, it saves us from having to calculate zillions of CDF values on large tables, when we only need the minimum and maximum values for each band. The ??² Test is applied to distributions rather than regression lines as the Hosmer-Lemeshow Test is, but they have at least one thing in common: the division of the dataset into probability bands, which are then graded on how close the expected values match the actual observations. The criteria for membership in these bands is up to you, but in my implementation, I’m simply using the NTILE windowing function to break up a dataset into subsets of almost equal size, in order of the values of the column being tested. Several sources caution that the type of banding can have a strong effect on the final test statistic. As the National Institute for Standards and Technology’s Engineering Statistics Handbook (one of the best online resources for anyone learning statistics) puts it, “This test is sensitive to the choice of bins. There is no optimal choice for the bin width (since the optimal bin width depends on the distribution). Most reasonable choices should produce similar, but not identical, results… The chi-square goodness-of-fit test is applied to binned data (i.e., data put into classes). This is actually not a restriction since for non-binned data you can simply calculate a histogram or frequency table before generating the chi-square test. However, the value of the chi-square test statistic are dependent on how the data is binned.”[10]
They’re not kidding, as I observed first-hand. I set the @NumberOfBands parameter to a default of 10, but you’re probably going to want to run several trials and experiment with higher and lower values, especially when it’s calculated against large tables, because it can dramatically affect the test statistic. Many sources mention that the count of records in each bucket ought to be more than 5, so you don’t want to set the @NumberOfBands so high that the bucket size falls below this threshold. I found it helpful to look at the output of the @FrequencyTable to make sure there weren’t too many bands with identical bounds, which will happen if the @NumberOfBounds is too high. Use some common sense: if you’re operating on nominals that can only be assigned integer values between 0 and 5, then a bin count of 6 might be a wise starting point.
An Explanation of the Sample Code
Most of the rest of the code is self-explanatory, to those who have slogged their way through one of my procedures before. As usual, the first four parameters allow you to run it against any numerical column in any database you have adequate access to, while the first couple of lines in the body help implement this. The rest is all dynamic SQL, beginning with the usual declaration sections and assignments of the aggregate values we’ll need for other calculations. After that I declare a couple of table variables and a table parameter to hold the final results as well as some intermediate steps. Most of the work occurs in the first INSERT, which divides the dataset into bands; a few statements later, the distinct minimum and maximum values that are inserted in this step are fed to the CDF procedure to derive probability values. Note that it can be drastically simplified if the flexible variable ranges that the @DecimalPrecision parameter implements are not needed; in that case, simply return the results from @SchemaAndTableName into a table variable and perform all the math on it outside the dynamic SQL block.
…………If you receive NULL values for your CDFs in the final results, it’s a clue that you probably need to try a @DecimalPrecision parameter (which I normally provide to help end users avoid arithmetic overflows) with a smaller scale; it signifies that the procedure can’t match values in the joins properly due to rounding somewhere. For a distribution other than the normal, simply plug in a different CDF and adjust the degrees of freedom to account for additional parameters, such as the shape parameter used in the Weibull. There might be a more efficient way to do the updates to the @FrequencyTable that follow, but the costs of these statements compared to the rest of the batch are inconsequential, plus the procedure is easier to follow this way. The two cumulative frequency counts are provided just as a convenience and can be safely eliminated if you don’t need them. After that, I return the full @FrequencyTable to the user (since the costs of calculating it have already been incurred) and compute the final test statistic in a single line in the last SELECT.
As mentioned in previous articles, many of these older tests were not designed for datasets of the size found in modern relational databases and data warehouse, so there are no checks built in to keep the final test statistic from being grossly inflated by the accumulation of millions of values. For that reason, I’m using a variant known as “Reduced ??²” that simply divides by the count of records to scale the results back down to a user-friendly, easily readable stat. Note that in previous articles, I misidentified Euler’s Number in my variable names as Euler’s Constant, for obvious reasons. Adding to the confusion is the fact that the former is sometimes also known as Napier’s Constant or the Exponential Constant, while the latter is also referred to as the Euler-Mascheroni Constant, which I originally thought to be distinct from Euler’s Constant. I used the correct constant and high-precision value for it, but applied the wrong name in my variable declarations.
Figure 2: T-SQL for the ??² Goodness-of-Fit Test
CREATE PROCEDURE [Calculations].[GoodnessOfFitChiSquaredTestSP]
@DatabaseName as nvarchar(128) = NULL, @SchemaName as nvarchar(128), @TableName as nvarchar(128),@ColumnName AS nvarchar(128), @DecimalPrecision AS nvarchar(50), @NumberOfBands as bigint = 10
AS
DECLARE @SchemaAndTableName nvarchar(400),@SQLString nvarchar(max)
SET @SchemaAndTableName = @DatabaseName + ‘.’ + @SchemaName + ‘.’ + @TableName
SET @SQLString = ‘DECLARE @Mean decimal(‘ + @DecimalPrecision + ‘), @StDev decimal(‘ + @DecimalPrecision + ‘), @Count decimal(‘ + @DecimalPrecision + ‘),
@EulersNumber decimal(38,37) = 2.7182818284590452353602874713526624977
SELECT @Count=Count(CAST(‘ + @ColumnName + ‘ AS Decimal(‘ + @DecimalPrecision + ‘))), @Mean = Avg(CAST(‘ + @ColumnName + ‘ AS Decimal(‘ + @DecimalPrecision + ‘))), @StDev = StDev(CAST(‘ + @ColumnName + ‘ AS Decimal(‘ + @DecimalPrecision + ‘)))
FROM ‘ + @SchemaAndTableName + ‘ WHERE ‘ + @ColumnName + ‘ IS NOT NULL
DECLARE @CDFTable table
(ID bigint IDENTITY (1,1),
Value decimal(‘ + @DecimalPrecision + ‘),
CDFValue decimal(‘ + @DecimalPrecision + ‘))
DECLARE @FrequencyTable table
(ID bigint,
MinValue decimal(‘ + @DecimalPrecision + ‘),
MaxValue decimal(‘ + @DecimalPrecision + ‘),
LowerCDFValue decimal(‘ + @DecimalPrecision + ‘),
UpperCDFValue decimal(‘ + @DecimalPrecision + ‘),
ActualFrequencyCount bigint,
ExpectedFrequencyCount decimal(‘ + @DecimalPrecision + ‘),
CumulativeActualFrequencyCount decimal(‘ + @DecimalPrecision + ‘),
CumulativeExpectedFrequencyCount decimal(‘ + @DecimalPrecision + ‘)
)
INSERT INTO @FrequencyTable
(ID, MinValue, MaxValue, ActualFrequencyCount)
SELECT DISTINCT BandNumber, Min(CAST(‘ + @ColumnName + ‘ AS decimal(‘ + @DecimalPrecision + ‘))) OVER (PARTITION BY BandNumber ORDER BY ‘ + @ColumnName + ‘) AS BandMin,
Max(CAST(‘ + @ColumnName + ‘ AS decimal(‘ + @DecimalPrecision + ‘))) OVER (PARTITION BY BandNumber ORDER BY ‘ + @ColumnName + ‘ DESC) AS BandMax, — note the DESC to go in the opposite order
Count(*) OVER (PARTITION BY BandNumber) AS BandFrequencyCount
FROM (SELECT ‘ + @ColumnName + ‘, NTile(‘ + CAST(@NumberOfBands as nvarchar(128)) + ‘) OVER (ORDER BY ‘ + @ColumnName + ‘) AS BandNumber
FROM ‘ + @SchemaAndTableName + ‘
WHERE ‘ + @ColumnName + ‘ IS NOT NULL) AS T1
DECLARE @InputTableParameter AS Calculations.SimpleFloatValueTableParameter
INSERT INTO @InputTableParameter
(Value)
SELECT DISTINCT Value FROM (SELECT MinValue AS Value
FROM @FrequencyTable
UNION
SELECT MaxValue AS Value
FROM @FrequencyTable)
AS T1
INSERT INTO @CDFTable
(Value, CDFValue)
EXEC Calculations.NormalDistributionCDFSupplyTableParameterSP @Mean, @StDev, @InputTableParameter
UPDATE T1
SET LowerCDFValue = T2.CDFValue
FROM @FrequencyTable AS T1
INNER JOIN @CDFTable AS T2
ON T1.MinValue = Value
UPDATE T1
SET UpperCDFValue = T2.CDFValue
FROM @FrequencyTable AS T1
INNER JOIN @CDFTable AS T2
ON T1.MaxValue = T2.Value
UPDATE @FrequencyTable
SET ExpectedFrequencyCount = (UpperCDFValue – LowerCDFValue) * @Count
— the Cumulatives are just for convenience and can be safely eliminated from the table if you don’t need them
UPDATE T1
SET T1.CumulativeActualFrequencyCount = T2.CumulativeActualFrequencyCount,
T1.CumulativeExpectedFrequencyCount = T2.CumulativeExpectedFrequencyCount
FROM @FrequencyTable AS T1
INNER JOIN (SELECT ID, Sum(ActualFrequencyCount) OVER (ORDER BY ID) AS CumulativeActualFrequencyCount, Sum(ExpectedFrequencyCount)
OVER (ORDER BY ID) AS CumulativeExpectedFrequencyCount
FROM @FrequencyTable) AS T2
ON T1.ID = T2.ID
— return all of the results
SELECT ID, MinValue, MaxValue, LowerCDFValue, UpperCDFValue, ActualFrequencyCount, ExpectedFrequencyCount, CumulativeActualFrequencyCount, CumulativeExpectedFrequencyCount
FROM @FrequencyTable
ORDER BY ID
— this is an alternate version of the test called “reduced chi squared” in which the degrees of freedom are taken into account to scale the results back down
SELECT Sum(ExpectedFrequencyCountSum) / Count(*) AS ChiSquaredTestReduced,
@Count AS FullPopulationCount, @Mean AS Mean, @StDev AS StDev
FROM (SELECT CASE WHEN ExpectedFrequencyCount = 0 THEN 0 ELSE Power(ActualFrequencyCount – ExpectedFrequencyCount, 2) / ExpectedFrequencyCount END AS ExpectedFrequencyCountSum
FROM @FrequencyTable) AS T1‘
–SELECT @SQLString — uncomment this to debug dynamic SQL errors
EXEC (@SQLString)
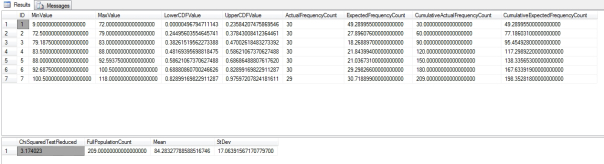
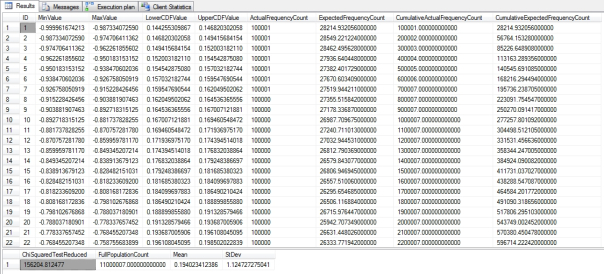
…………As has become standard fare over the past two tutorial series, I first tested the results against a tiny 9-kilobyte table of data on the Duchennes form of muscular dystrophy from the Vanderbilt University’s Department of Biostatistics. Then I stress-tested it against the 11 million rows in the Higgs Boson Dataset I downloaded from the University of California at Irvine’s Machine Learning Repository and converted into a nearly 6-gigabyte SQL Server table. The query in Figure 3 on the Hemopexin protein produced the first resultset below it, while the much longer resultset was the product of a similar query on the first float column in the HiggsBosonTable. An unreasonable selection of bands can also apparently affect performance; on my first trial on the HiggsBosonTable, I forgot to set the number well above 7, which may be why it took 7:26. Subsequent trials with values around 100 took between 5:46 and 5:52; the results depicted here are only for the first 22 out of 110 bands.
…………I’m not surprised that the final test statistic has six digits to the left of the decimal points, given that I know from previous outlier detection and goodness-of-fit tests that Column 1 is highly abnormal. Column 2 follows an obvious bell curve when displayed in a histogram, so it is likewise not surprising that its ??² Test result was only 1,326, or less a hundredth of Column1. I have the feeling that the sheer size of the dataset can distort the final test statistic, thereby making it difficult to compare them across datasets, but probably not as severely as in other measures, particularly the Jarque-Bera and K² Tests. The query on the second float column likewise took 5:45 on my beat-up development machine – which more closely resembles the Bluesmobile than a real server, so your mileage will probably be a lot better. It’s not as quick as the procedure I wrote in Goodness-of-Fit Testing with SQL Server Part 4.1: R2, RMSE and Regression-Related Routines, but certainly faster than many others I’ve done in past articles.
Figure 3: Sample Results from the Duchennes and Higgs Boson Datasets
EXEC @return_value = [Calculations].[GoodnessOfFitChiSquaredTestSP]
@DatabaseName = N’DataMiningProjects‘,
@SchemaName = N’Health‘,
@TableName = N’DuchennesTable‘,
@ColumnName = N’Hemopexin‘,
@DecimalPrecision = N’38,17′,
@NumberOfBands = 7
…………The full execution plan it too large to depict here, but suffice it to say that it consists of 11 separate queries – with one of them, the insert into the @FrequencyTable, accounting for 99 percent of the computational cost of the entire batch. I’m not sure at this point how to go about optimizing that particular query, given that it starts with an Index Seek, which is normally what we want to see; there are also a couple of Nested Loops operators and a Hash Match within that query, but together they only account for about 12 percent of its internal costs. Almost all of the performance hit comes on two Sort operators, which a better-trained T-SQL aficionado might be able to dispose of with a few optimizations.
Efficiency is something I’ll sorely need for next week’s article, in which I tackle the Shapiro-Wilk Test. Many sources I’ve stumbled upon while researching this series indicate that it has better statistical power than most of the competing goodness-of-fit tests, but it has many limitations which severely crimp its usability, at least for our purposes. First, it can apparently only be calculated on just 50 values, although I’ve seen figures as high as a couple of hundred. Either way, that’s about a few hundred million rows short; the sheer sizes of datasets available to DBAs and data miners today are one of their strengths, and we shouldn’t have to sacrifice that hard-won advantage by taking Lilliputian slices of it. Worst of all, the calculations are dogged by a form of combinatorial explosion, which can be the kiss of death for Big Analysis. I have learned to fear the dreaded factorial symbol n! and the more insidious menace posed by calculations upon infinitesimal reciprocals, of the kind that afflicted the Hosmer-Lemeshow Test in last week’s article. My implementation of the Shapiro-Wilk Test will sink or swim depending on whether or not I can find a reasonable workaround for the covariance matrices, which are calculated based on a cross product of rows. In a table of a million rows, that means 1 trillion calculations just to derive an intermediary statistic. A workaround might be worthwhile, however, given the greater accuracy most sources ascribe to the Shapiro-Wilk Test.
[1] See National Institute for Standards and Technology, 2014, “1.3.5.15 Chi-Square Goodness-of-Fit Test,” published in the online edition of the Engineering Statistics Handbook. Available at http://www.itl.nist.gov/div898/handbook/eda/section3/eda35f.htm
[2] IBID.
[3] p. 316 D’Agostino, Ralph B.; Belanger, Albert and D’Agostino Jr., Ralph B, 1990, “A Suggestion for Using Powerful and Informative Tests of Normality,” pp. 316–321 in The American Statistician. Vol. 44, No. 4. Available online at http://www.ohio.edu/plantbio/staff/mccarthy/quantmet/D’Agostino.pdf
[4] See the reply by the user named Glen_b in the CrossValidated thread “How to Get the Expected Counts When Computing a Chi-Squared Test?” dated March 14, 2013, which is available at the web address
[5] See the StatTrek webpage titled “When to Use the Chi-Square Goodness of Fit Test” at http://stattrek.com/chi-square-test/goodness-of-fit.aspx
[6] I may be a novice, but am apparently not alone in my reluctance to use tests that enforce either-or choices. See the reply by the user named Glen_b in the CrossValidated thread “How to Get the Expected Counts When Computing a Chi-Squared Test?” dated March 14, 2013, which is available at the web address http://stats.stackexchange.com/questions/52209/how-to-get-the-expected-counts-when-computing-a-chi-squared-test as well as the reply by the same user to the thread “What Tests Do I Use to Confirm That Residuals are Normally Distributed?” posted Sept. 13, 2013 at the CrossValidated forum web address http://stats.stackexchange.com/questions/36212/what-tests-do-i-use-to-confirm-that-residuals-are-normally-distributed/36220#36220 He makes several very good points about goodness-of-fit testing that are worth quoting here. In the first, he says that
“No test will prove your data is normally distributed. In fact I bet that it isn’t. (Why would any distribution be exactly normal? Can you name anything that actually is?)
2) When considering the distributional form, usually, hypothesis tests answer the wrong question
What’s a good reason to use a hypothesis test for checking normality?
I can think of a few cases where it makes some sense to formally test a distribution. One common use is in testing some random number generating algorithm for generating a uniform or a normal.
In the second thread, he similarly points out that:
“1.No test will tell you your residuals are normally distributed. In fact, you can reliably bet that they are not.”
“2.Hypothesis tests are not generally a good idea as checks on your assumptions. The effect of non-normality on your inference is not generally a function of sample size*, but the result of a significance test is. A small deviation from normality will be obvious at a large sample size even though the answer to the question of actual interest (‘to what extent did this impact my inference?’) may be ‘hardly at all’. Correspondingly, a large deviation from normality at a small sample size may not approach significance…”
“…If you must use a test, Shapiro-Wilk is probably as good as anything else. (But it’s answering a question you already know the answer to – and every time you fail to reject, giving an answer you can be sure is wrong.)”
[7] Just a side note on terminology: I see both the tests and the distribution referred to as “Chi-Squared” with a final D as often as I do “Chi-Square” without one, which are sometimes mixed together in the same sources. I’ll stick with a closing D for the sake of consistency, even if it turns out to be semantically incorrect.
[8] For a readable explanation of the independence test, see Hopkins, Will G., 2001, “Contingency Table (Chi-Squared Test),” published at the A New View of Statistics website address http://www.sportsci.org/resource/stats/continge.html
[9] For a quick introduction to this sordid tale, see the Wikipedia page “Karl Pearson” at http://en.wikipedia.org/wiki/Karl_Pearson
[10] See National Institute for Standards and Technology, 2014, “1.3.5.15 Chi-Square Goodness-of-Fit Test,” published in the online edition of the Engineering Statistics Handbook. Available at http://www.itl.nist.gov/div898/handbook/eda/section3/eda35f.htm The formula for the goodness-of-fit test is widely available, but I depended mostly on this NIST webpage when writing my code because their equation was more legible.

![]()
