

I am resuming technical blogging after a gap of nearly a month. I will continue to blog my re learning of statistics and basic concepts, and illustrate them to the best of my ability using R and T-SQL where appropriate.
For this week I have chosen a statistical concept called ‘Empirical Rule’.
The empirical rule is a test to determine if or not the dataset belongs to a normal distribution.
- 68% of data falls within the first standard deviation from the mean.
- 95% fall within two standard deviations.
- 99.7% fall within three standard deviations.
The rule is also called the 68-95-99 7 Rule or the Three Sigma Rule. The basic reason to test if a dataset follows this rule is to determine whether or not it is a normal distribution. When it is normally distributed and follows the bell curve – it lends itself easily to a variety of statistical analysis, especially forecasting. There are many other tests for normalisation that are more rigorous than this – and the wiki link has a good summary of those, but this is a basic and easy test.
For my test purpose I used the free dataset from WHO 0n life expectancies around the globe. It can be found here. I imported this dataset into sql server. I ran a simple TSQL script to find out if this dataset satisfies the empirical rule.
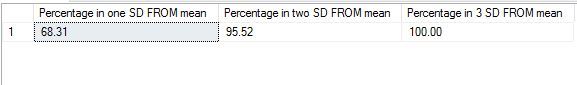
DECLARE @sdev numeric(18,2), @mean numeric(18, 2), @sigma1 numeric(18, 2), @sigma2 numeric(18, 2), @sigma3 numeric(18, 2)
DECLARE @totalcount numeric(18, 2)
SELECT @sdev = SQRT(var(age)) FROM [dbo].[WHO_LifeExpectancy]
SELECT @mean = sum(age)/count(*) FROM [dbo].[WHO_LifeExpectancy]
SELECT @totalcount = count(*) FROM [dbo].[WHO_LifeExpectancy]
SELECT @sigma1 = (count(*)/@totalcount)*100 FROM [dbo].[WHO_LifeExpectancy] WHERE age >= @mean-@sdev and age<= @mean+@sdev
SELECT @sigma2 = (count(*)/@totalcount)*100 FROM [dbo].[WHO_LifeExpectancy] WHERE age >= @mean-(2*@sdev) and age<= @mean+(2*@sdev)
SELECT @sigma3 = (count(*)/@totalcount)*100 FROM [dbo].[WHO_LifeExpectancy] WHERE age >= @mean-(3*@sdev) and age<= @mean+(3*@sdev)
SELECT @sigma1 AS 'Percentage in one SD FROM mean', @sigma2 AS 'Percentage in two SD FROM mean',
@sigma3 as 'Percentage in 3 SD FROM mean'
The results I got are as below. As we can see ,68.31 % of data falls between one difference of mean and standard deviation, 95 % falls between two differences and 100% falls between 3. This is a near perfect normal distribution – one that lends itself to statistical analysis very easily.
To do the same analysis in R, I used script as below:
install.packages("RODBC")
library(RODBC)
cn <- odbcDriverConnect(connection="Driver={SQL Server Native Client 11.0};server=MALATH-PC\\SQL01;database=WorldHealth;Uid=sa;Pwd=Mysql1")
data <- sqlQuery(cn, 'select age from [dbo].[WHO_LifeExpectancy] where age is not null')
agemean<-mean(data$age)
agesd<-sd(data$age)
sigma1<-(sum(data$age>=agemean-agesd & data$age<=agemean+agesd)/length(data$age))*100
sigma2<-(sum(data$age>=agemean-(2*agesd) & data$age<=agemean+(2*agesd))/length(data$age))*100
sigma3<-(sum(data$age>=agemean-(3*agesd) & data$age<=agemean+(3*agesd))/length(data$age))*100
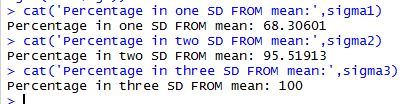
cat('Percentage in one SD FROM mean:',sigma1)
cat('Percentage in two SD FROM mean:',sigma2)
cat('Percentage in three SD FROM mean:',sigma3)My results are as below:
I can use the same script within TSQL and call it –
EXEC sp_execute_external_script
 @language = N'R'
 ,@script = N'agemean<-mean(InputDataSet$age)
agesd<-sd(InputDataSet$age)
sigma1<-(sum(InputDataSet$age>=agemean-agesd & InputDataSet$age<=agemean+agesd)/length(InputDataSet$age))*100
sigma2<-(sum(InputDataSet$age>=agemean-(2*agesd) & InputDataSet$age<=agemean+(2*agesd))/length(InputDataSet$age))*100
sigma3<-(sum(InputDataSet$age>=agemean-(3*agesd) & InputDataSet$age<=agemean+(3*agesd))/length(InputDataSet$age))*100
print(sigma1)
print(sigma2)
print(sigma3)'
 ,@input_data_1 = N'select age from [dbo].[WHO_LifeExpectancy] where age is not null;'
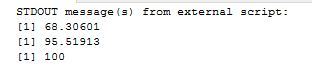
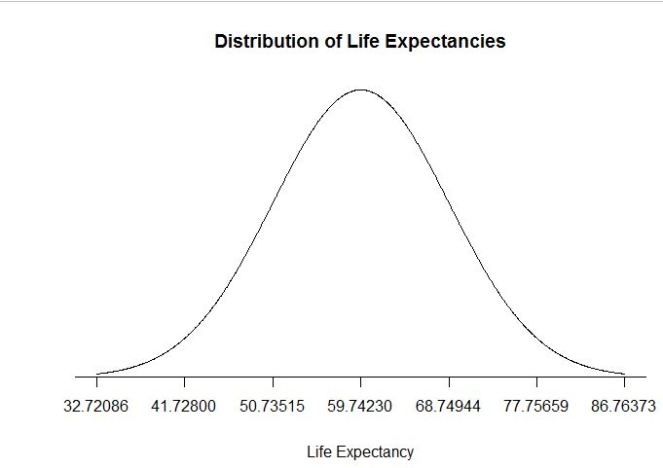
As we can see, the results are exactly the same in all 3 methods. We can also draw a bell curve with this data in R and see that it is a perfect curve, proving that the data is from a normally distributed set. The code I wrote to draw the graph is as below:
lower_bound <- agemean - agesd * 3
upper_bound <- agemean + agesd * 3
x <- seq(-3, 3, length = 1000) * agesd + agemean
y <- dnorm(x, agemean, agesd)
plot(x, y, type="n", xlab = "Life Expectancy", ylab = "", main = "Distribution of Life Expectancies", axes = FALSE)
lines(x, y)
sd_axis_bounds = 5
axis_bounds <- seq(-sd_axis_bounds * agesd + agemean, sd_axis_bounds * agesd + agemean, by = agesd)
axis(side = 1, at = axis_bounds, pos = 0)

![]()
